Articles

Eight Common Commercial Real Estate Investor Questions

Whether you are just beginning your investing journey or are looking to take your portfolio to the next level, Arbor stands ready with our talented team and decades of expertise. Given our vast experience and national footprint of successful deals, we are familiar with many common commercial real estate investor questions, such as the ones answered in this article.

Articles

Multifamily is Well-Positioned for Short- and Long-Term Growth

With the macroeconomy maintaining its underlying strength and a handful of rate cuts expected by the Fed within the next 18 months, green shoots of optimism within the multifamily sector are multiplying. Even as high interest rates impede normal operations, stabilization is underway while the sector’s long-term prospects remain unwavering. In this deep dive, our research teams will explore the tailwinds underpinning the multifamily sector’s short- and long-term outlook.

Refinance of Existing HUD-Insured Loan

FHA® Interest Rate Reduction (IRR) Refinance of Existing HUD-Insured Loan   Arbor provides this program to reduce the interest rate on qualified existing HUD-insured multifamily loans. The HUD-insured loan remains in place, with reduced payments based on the new rate, the current balance, and the remaining term. The existing prepayment penalty must be paid in full. V041624

Mortgage Insurance for Rental Housing for Urban Renewal and Targeted Redevelopment

FHA®220 Mortgage Insurance for Rental Housing for Urban Renewal and Targeted Redevelopment*   Arbor provides FHA-insured, long-term, fixed rate financing for new construction and substantial rehabilitation of multifamily projects nationwide. This program provides for both construction and permanent financing for projects in urban renewal areas and other areas where local governments have undertaken designated revitalization activities. Applications are typically processed in two stages (preliminary application followed by firm application). Affordable/rental assisted projects and HUDexperienced development teams may request a “straight to firm” application, saving significant time by eliminating the preliminary application stage. V020224

Articles

Regional Construction Trends: Annual Multifamily Completions Surged in the South and West

After the volume of newly issued multifamily permits hit a 37-year high in 2022, multifamily completions surged another 22.3% last year. As the sector continues to gain strength, its growth has remained concentrated in the southern and western regions of the country, according to an analysis of new data from the U.S. Census Bureau’s Survey of Construction.

Articles

The Evolving Characteristics of Multifamily Construction

During the post-global financial crisis (GFC) cycle, a disproportionate share of new multifamily construction was of high-rise units in properties with amenities. However, the tides have turned. The rising cost of homeownership has brought the need for more affordable housing development in the U.S. to the top of many legislative agendas. In this deep dive, our research teams utilize data from the U.S. Census Bureau’s Annual Survey of Construction to show how and why the characteristics of new multifamily properties continue to evolve alongside shifting market needs.

Articles

Video: Growing LGBTQIA+ Visibility in the CRE Industry

LGBTQIA+ Pride Month is recognized in June, but its lessons are timeless. During a recent conversation between Tres Seippel, Director, Construction Management at Arbor, and Dr. Sam Chandan, Founder of Chandan Economics, Founding Director, NYU Chen Institute for Global Real Estate Finance, and Co-Chair of the Real Estate Pride Council, Seippel shared why it is more important than ever for the industry to embrace visibility and show support for employees who identify as LGBTQIA+ or other diverse backgrounds.

General: 800.ARBOR.10

Q2 2021
Small Multifamily
Investment Trends Report

Small Multifamily Sector Returns to Normalcy as the Recovery Takes Hold

Key Findings

  • Small multifamily cap rates continued to edge down, sinking to 5.2%, down from 5.3% last quarter
  • Acquisitions drove a larger share of lending volume as refinancings settled near pre-crisis levels
  • Asset prices rose 10.2% year over year and 1.3% quarter over quarter

State of the Market

From the second quarter of 2020 to the second quarter of 2021, the U.S. has gone from experiencing all-out public health and economic crises to a recovery mode so robust that the debate du jour is whether policymakers are letting the economy run too hot.


The 2021 macroeconomic recovery is gaining steam as it comes back from the 3.5% annual decline it suffered in 2020, which was the largest contraction in the post-war era and the outcome of historic volatility in quarterly GDP figures. Inflation-adjusted GDP grew at a 6.4% annualized rate in the first quarter of 2021. According to the Federal Reserve Bank of Atlanta’s GDPNow projection, second-quarter growth is forecast to land near 7.9%. 


According to the U.S. Bureau of Labor Statistics, labor market progress has become more consistent. The three-month moving average for job gains gradually increased from 518,000 to 567,000 between March and June 2021. Additionally, June’s employment increase of 850,000 positions represented the highest level of job growth since August 2020 and still nearly four times the monthly average seen through the recovery following the last recession.


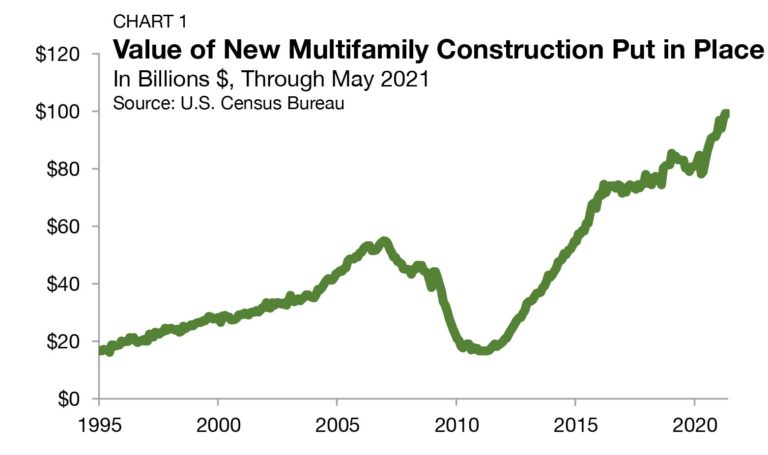
By some measures, the U.S. multifamily sector is an industry in recovery — by others, it is already shaking off the rust and moving into expansion. After dipping slightly during the depths of the COVID-19 recession, the value of new multifamily construction put in place returned to growth mode by July 2020, and it has broken its all-time high record for the past nine months in a row (Chart 1). As a comparison, after reaching a high point in 2007, it then took the value of new multifamily construction more than eight years to eclipse pre-Great Recession levels.

Trends within the small multifamily sub-sector match the broader industry, with measures of health ranging from ‘in recovery’ to ‘fully recovered.’ Driven by ample liquidity and continued downward pressure on cap rates, valuations of small multifamily assets are gaining momentum. The balance between refinancings and acquisitions is settling back into its pre-pandemic norms, reflecting a stable interest rate environment and the return of active buyers.


However, challenges remain. Some operators may still see some COVID-related distress. Smaller mom-and-pop landlords who are subject to the CDC’s eviction moratorium are asymmetrically impacted by the Federal policy. Since these landlords typically have fewer units, a non-performing unit diminishes a greater share of potential income than if the same non-performing unit were to reside in a larger multifamily property.


In a June letter addressed to the Biden Administration signed by 12 of the nation’s leading rental housing advocacy and trade groups (including National Multifamily Housing Council, Mortgage Bankers Association and others), industry leaders commended the Federal Government’s role in staving off a rental housing crisis. However, they urged the Administration to suspend the CDC’s eviction moratorium. The letter states, “the continuation of a nationwide, one-size-fits-all” approach at this point will only place “insurmountable levels of debt on renter households and prevent recovery in the housing sector.” Despite these calls, CDC Director Dr. Rochelle Walensky extended the eviction moratorium by another month. However, it came with the announcement that it

was intended to be the final extension, setting up an expiration of the moratorium on July 31.


All else equal, the small multifamily recovery is well underway. The second half of 2021 has a firming outlook for the small asset sector. Macroeconomic tailwinds and the sunset of the CDC’s eviction moratorium will take the reins from the reliable underlying demand and the agencies’ (Fannie Mae and Freddie Mac) support that kept small multifamily going during the pandemic-related recession.

Lending Volume

Annualized 2021 estimates of new multifamily lending volume on loans with original balances between $1 million and $7.5 million1 — including loans for rental apartment building sales and refinancing — are on pace to finish the year at $57.1 billion (Chart 2). The current estimate would represent a 0.5% annual decline, or a decrease of about $315 million (Chart 3). The current 2021 annualized estimate is a downward revision from the $60.2 reported last quarter, reflecting the impact of a normalizing pace of refinancings. According to Chandan Economics, small multifamily originations reached an all-time high of $59.2 billion in 2019. In 2020, origination volumes only fell by 2.9% — a drop-off that would have proven much worse had a surge in refinancing activity not buoyed loan production.

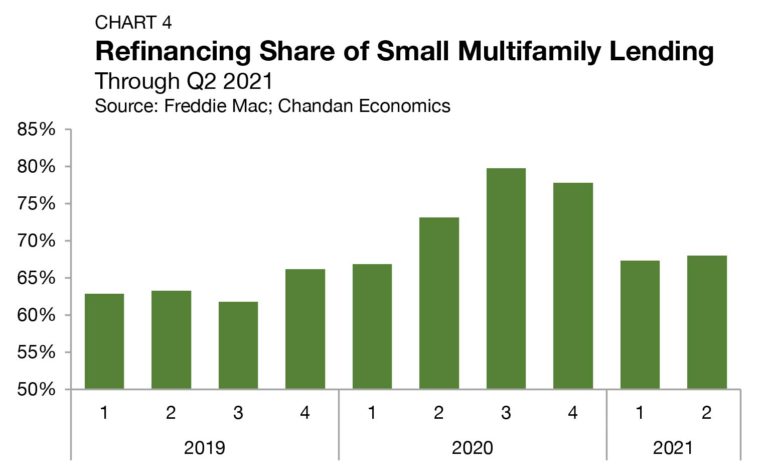
Refinancing activity continues to make up the bulk of new lending activity, though the balance between refinancings and acquisitions has fallen back in line with pre-crisis levels, averaging 67.3% and 68.0% in the first and second quarters of 2021, respectively (Chart 4).

With the interest rate environment proving more stable in 2021 than it had in 2020, the overwhelming rush to refinance has normalized.

Last year, as buyers and sellers were far apart in their asset value assessments, operators turned to mortgage lenders to pull equity out of their properties. Moreover, rapidly falling interest rates meant that operators could also lower their monthly debt servicing costs through refinancing. After rising for four consecutive quarters, the refinancing share of small multifamily reached a high watermark of 79.7% in the third quarter of 2020.

1All data, unless otherwise stated, are based on Chandan Economics’ analysis of a limited pool of loans with original balances of $1 million to $7.5 million and loan-to-value ratios above 50%.

Arbor Small Multifamily Price Index

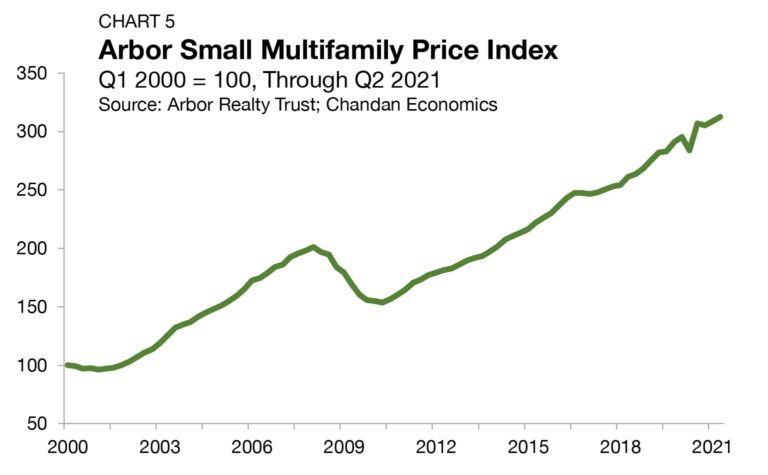
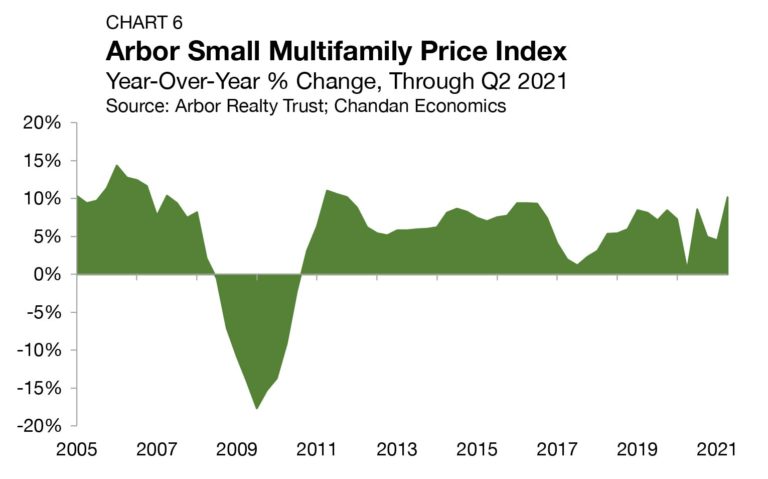
As measured by the Arbor Small Multifamily Price Index2, small multifamily asset valuations continued their trajectory of improvement in the second quarter of 2021, notching solid quarterly and annual gains of 1.3% and 10.2%, respectively. (Chart 5 and Chart 6).


The robust annual growth is in part due to base effects, where declines in asset values measured last year make this year’s data appear particularly strong. Nonetheless, on average, small multifamily valuations have already more than recovered from the COVID-19 disruption, rising 5.8% above their pre-pandemic mark.

2The Arbor Small Multifamily Price Index (ASMPI) uses model estimates of small multifamily rents and compares them against small multifamily cap rates. The index measures the estimated average price appreciation on small multifamily properties with 5 to 50 units and primary mortgages of $1 million to $7.5 million. For the full methodology, visit arbor.com/asmpi-faq.

Cap Rates & Spreads

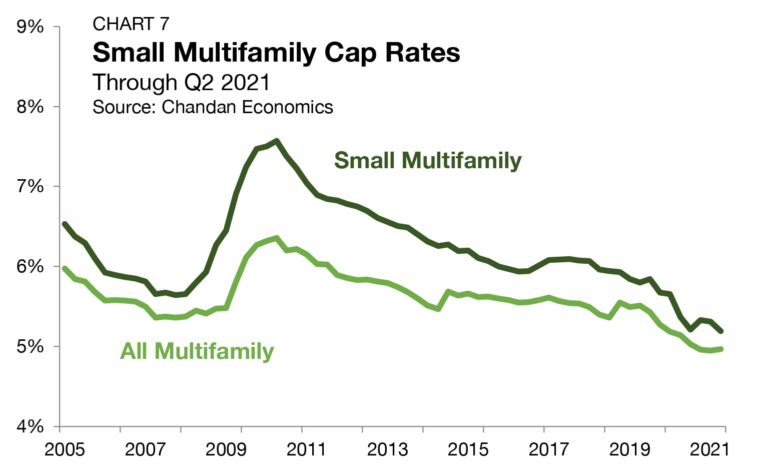
National average cap rates for small multifamily properties continued their long-term trend of steady declines in the second quarter of 2021, shaving off 12 basis points (bps) from the previous quarter and settling at 5.2% (Chart 7). Small multifamily cap rates have, except briefly during the pandemic, compressed since 2011, falling an average of 21 bps annually. Through second-quarter 2021, small multifamily cap rates are down 18 bps from one year ago, in line with the post-Great Recession trajectory.


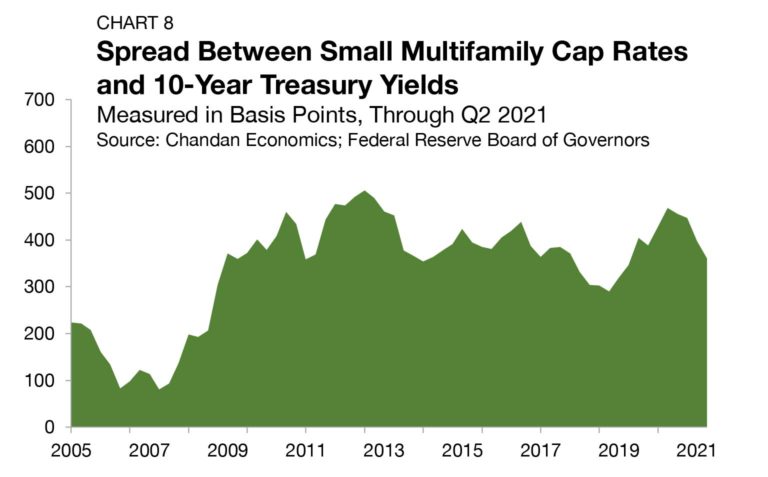
The small multifamily risk premium, a measure of additional compensation demanded by investors to account for higher levels of risk, is best measured by comparing cap rates to 10-year Treasury yields. The credit quality of the U.S. government is perceived as unmatched, making the price it pays for its debt an approximation for the risk-free interest rate. The small multifamily risk premium averaged 360 bps in the second quarter of 2021, down from 397 bps the previous quarter, and a pandemic-triggered 468 bps one year ago (Chart 8). These risk premiums have now sunk for four consecutive quarters as widespread fears have continued to ease with the recovery.

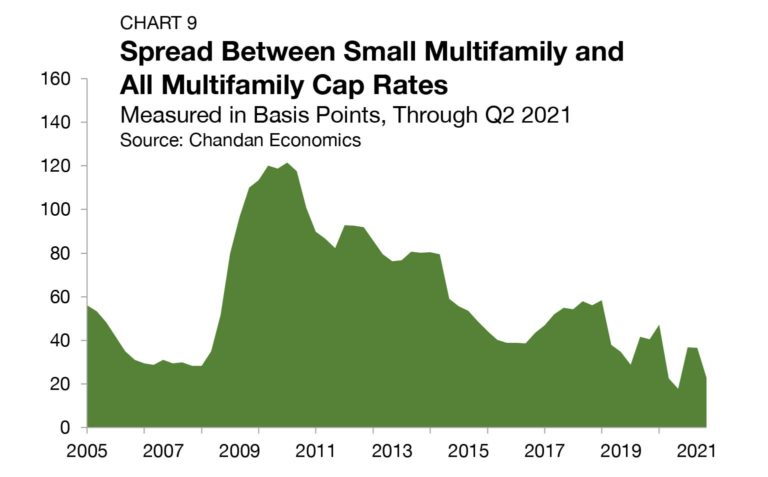
The cap rate spread between small multifamily assets and the rest of the multifamily sector, a measure of the idiosyncratic risk of smaller properties, shaved off 14 bps from the previous quarter, settling at 23 bps (Chart 9). The small versus all multifamily cap rate spread hit an all-time high of 121 bps in 2010 and an all-time low of just 18 bps in third-quarter 2020. Over time, the yield structure of small assets has come to look more like the rest of the sector as liquidity has improved and technological adoptions have added operational efficiencies.

Leverage & Debt Yields

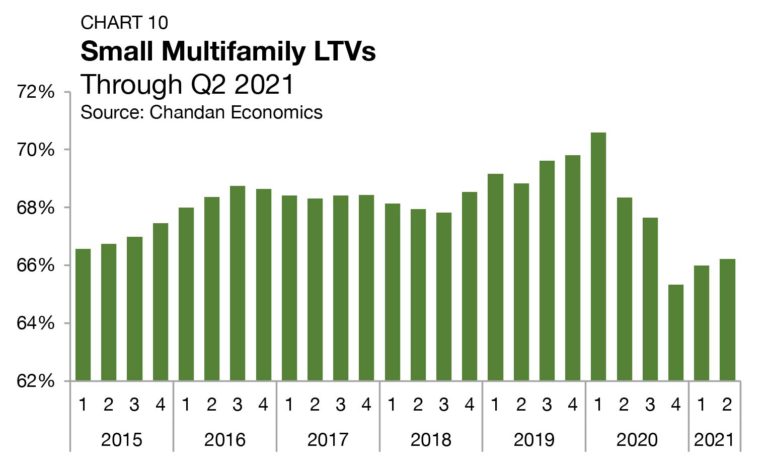
Between the first quarter and fourth quarters of 2020, loan-to-value ratios (LTVs) on newly originated small multifamily loans cratered from a high of 70.6% to a low of 65.3% (Chart 10).

For a sense of scale, between the end of 2011 and the start of 2020, small multifamily LTVs rose an average of exactly 1.0% annually, making the pandemic-induced 5.3% drop-off appear particularly severe. Now in 2021, with the small multifamily sector already in recovery mode, LTVs have started the process of reversing their freefall and climbing back to their pre-pandemic conditions. Through the second quarter of 2021, LTVs on small multifamily loans averaged 66.2%, up 23 bps from the previous quarter and up 90 bps from their recent low of 65.3% measured in fourth-quarter 2020.


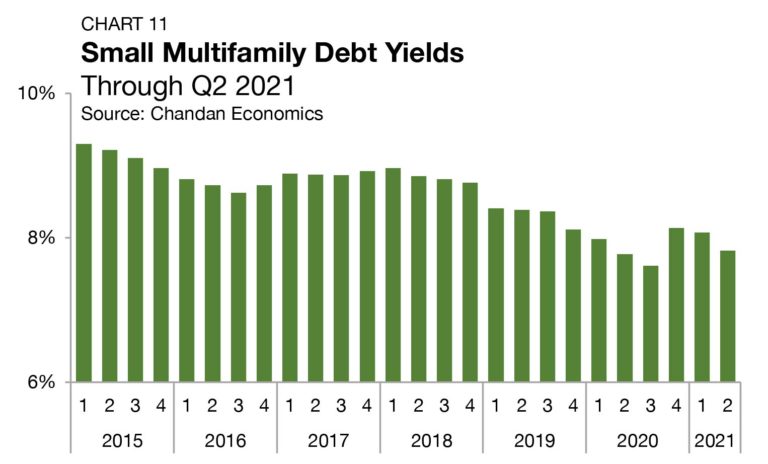
Debt yields — the ratio of net operating income (NOI) and loan balance — for small multifamily loans fell by 25 bps to 7.8% in the second quarter of 2021, the most sizable decrease in six quarters (Chart 11)After shooting up by 53 bps in late-2020, small multifamily debt yields have now fallen for two consecutive quarters and are only 21 bps above their all-time low. Debt per dollar of NOI, the inverse of debt yields, increased for small multifamily loans in the second quarter. Small multifamily borrowers were securing an average of $12.78 in new debt for every $1 of property NOI, up 39 cents from the previous quarter.

Outlook

The COVID-19 pandemic and subsequent recession offered a rare jolt of volatility for a sector that has proven reliable as they come since post-Great Recession. With the recovery taking hold, getting back to the small asset sector’s steady progress is downright exhilarating. A recent Arbor Realty Trust-Chandan Economics analysis indicates that transaction volume across the multifamily sector is improving on last year’s drop-off, with the Sun Belt already running ahead of its pre-pandemic pace in 2021.


Some uncertainty exists around vaccination rates and the path of the virus. Vaccine hesitancy will likely prevent many U.S. communities from reaching local herd immunity. The rise of Delta variant, and the specter for others like it, may mean that the COVID-19 threat will persist long beyond the full resumption of our pre-pandemic lives. Even with the uncertainty, days of empty streets in Times Square and crowded lines at mass testing sites, thankfully, appear firmly behind us.


All else equal, between a growing pool of returning buyers and the end of the CDC’s eviction moratorium, the ingredients for sustained expansion are falling into place, and the outlook for the small multifamily is both positive and improving.


For more small multifamily research and insights, visit arbor.com/articles

Disclaimer All content is provided herein “as is” and neither Arbor Realty Trust, Inc. or Chandan Economics, LLC (“the Companies”) nor their affiliated or related entities, nor any person involved in the creation, production and distribution of the content make any warranties, express or implied. The Companies do not make any representations regarding the reliability, usefulness, completeness, accuracy, currency nor represent that use of any information provided herein would not infringe on other third party rights. The Companies shall not be liable for any direct, indirect or consequential damages to the reader or a third party arising from the use of the information contained herein.