Sponsors today are increasingly choosing bridge lending solutions to capitalize on opportunities during the lease-up and stabilization phases, with multifamily completions projected to remain elevated through 2030. Bridge loans, when paired with a lender equipped to support your investment needs from construction through permanent financing, can effectively position borrowers for long-term success.
Single-Family Rental Investment Trends Report Q3 2022
New Construction Soars as Rent Growth Retreats from its Peak
Key Findings
- SFR rent growth slows, although it remains elevated, as renewal rent growth gains steam.
- Cap rates remain unchanged at 5.3% despite rising interest rates.
- Build-to-Rent (BTR) construction starts totaled 69,000 over the past year, another new record high.
Table of Contents
State of the Market
If there is any corner of the U.S. housing market that is still maintaining the momentum of the past few years, it’s the single-family rental (SFR) sector.
Broadly, the single-family housing market has reached an inflection. The 30-year fixed rate mortgage averaged 5.6% in the third quarter of 2022 and then accelerated to eclipse 7.0% in October for the first time since 2002. Rising capital costs for potential homeowners have curtailed buying activity and diminished market pricing. In their October 2022 forecast, Fannie Mae predicted that home prices will fall 1.5%
next year.
Within the SFR sector, the overall slowdown likely means a mixed bag of outcomes. On the one hand, SFR asset prices operate within the entire single-family housing ecosystem, meaning any deterioration in the overall housing market will negatively impact SFR valuations. On the other hand, SFR will likely benefit from being well-positioned as a primary alternative for would-be homeowners who have been priced out in the current high-interest-rate housing market.
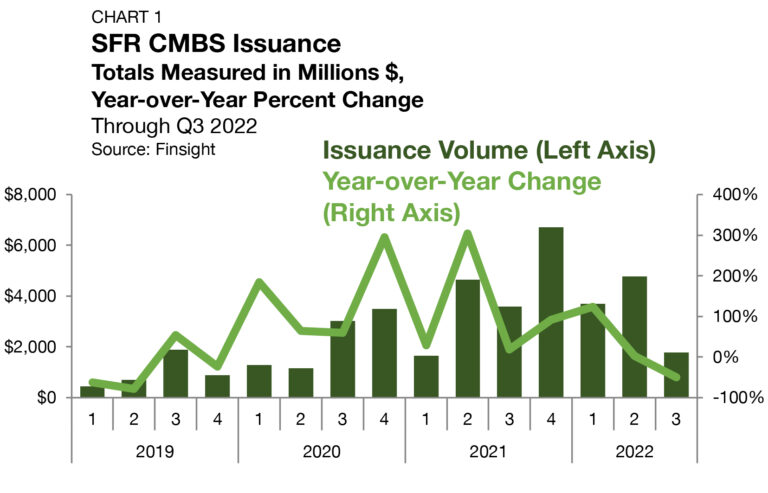
In the CMBS market, SFR issuance remains active, though the pace of new issuance has slowed since 2021. According to Finsight, SFR CMBS issuance has totaled $10.2 billion through the third quarter of 2022 (Chart 1). At its current pace, SFR CMBS deal activity would finish the year 17.7% below 2021’s record $16.6 billion.
While the housing market sits on shaky ground, the SFR sector has a secure foundation. Several indicators continue to point in a positive direction for SFR. The sector’s share of total construction activity has reached new heights and renewal rent growth is still picking up. At the same time, lenders have started to adjust risk pricing through higher debt yields, while equity investors have yet to meaningfully change their cap rate targets — a possible sign that an adjustment period is on the horizon. All else remaining equal, SFR will have some exposure to changing housing market conditions, though the sector is countercyclically balanced as financial obstacles to homeownership often transfer housing demand to rental units.
Performance Metrics
Originations
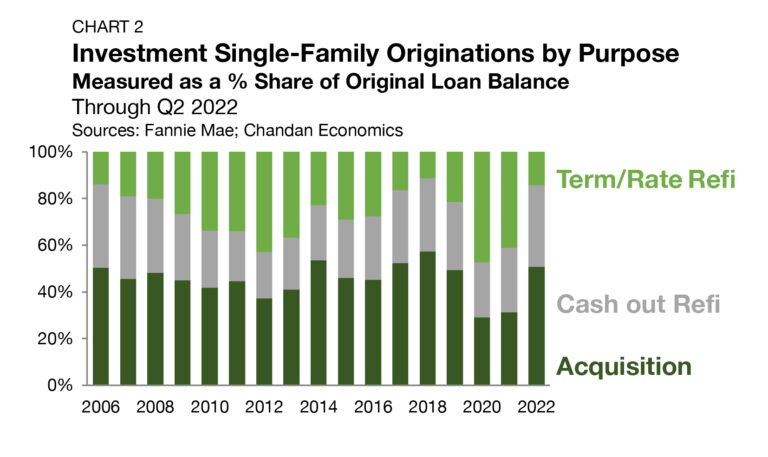
Loans for purchasing, not refinancing, accounted for a majority (50.7%) of originations to single-family investors in 2022 for the first time since 2018, according to Fannie Mae (Chart 2).
The immediate cause of the market shift is the Federal Reserve’s monetary tightening cycle. On November 2, the Fed moved up its benchmark Federal Funds rate by 75 bps for the fourth consecutive meeting in a row. The impact of the Fed’s tightening cycle on interest rates has been dramatic. Mortgage interest rates, which started 2022 just above 3%, have now climbed above 7%.
The significant rise in mortgage borrowing costs has meant that fewer existing SFR owners would benefit from refinancing their existing mortgages. Term/rate refinancings, which accounted for 47.3% and 41.2% of originations in 2020 and 2021, respectively, have fallen to 14.2% in 2022. Meanwhile, cash-out refinancings have continued to hold up this year, despite the impact of higher borrowing costs. Through the second quarter of 2022, cash-outs have accounted for 35.1% of SFR lending activity. Often, for smaller investors, accrued equity in existing properties represents the capital needed for a down payment on another.
Occupancy
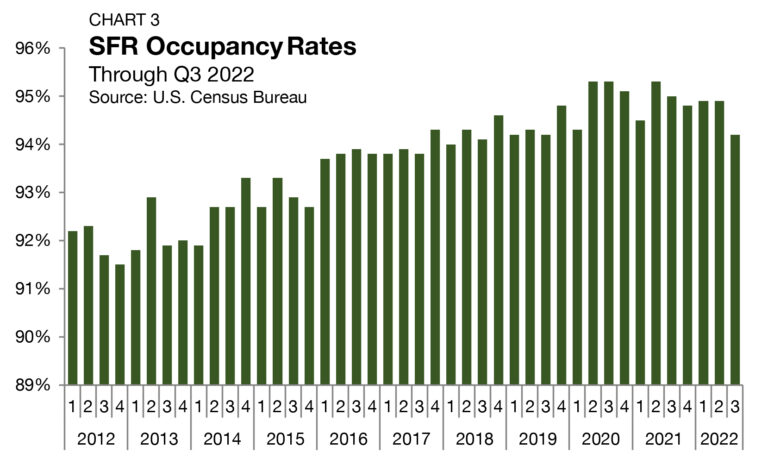
As measured by the U.S. Census Bureau, occupancy rates across all SFRs averaged 94.2% in the third quarter of 2022, dropping by 70 bps from the previous quarter (Chart 3). The third-quarter decline was the largest on record since 2013. These data may reflect a slight change in market dynamics, especially as there are increasing reports of rents dropping on a month-over-month basis. As rents fluctuate, tenants opting for new rental units over existing leases could slightly increase the share of vacant units and lower the occupancy rate. Still, the current SFR occupancy rate remains 141 bps above the 2010-2019 average.
Rent Growth
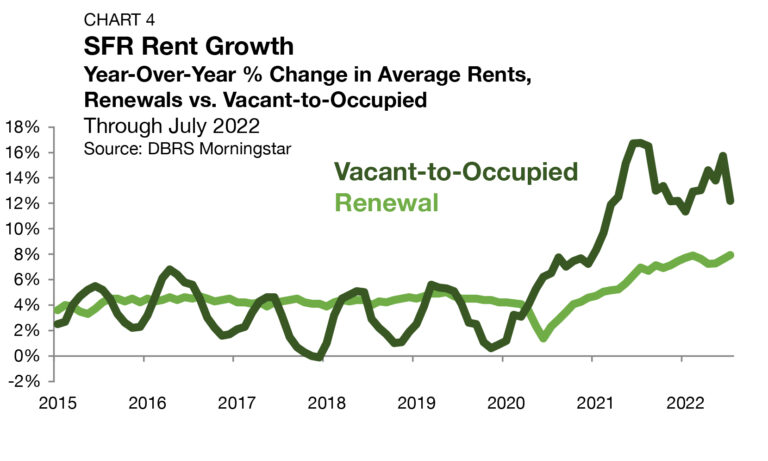
According to DBRS Morningstar, vacant-to-occupied (V2O) annual rent growth has sharply decelerated in recent months, although it remains elevated. In the year ending July 2022, V2O rents are up 12.2% (Chart 4). By comparison, annual V2O rent growth did not eclipse 8.0% from 2015 to 2021. Still, the most recent data represents a clear market inflection. The pace of annual V2O growth fell by 355 bps from a month earlier — the largest single-period decline on record.
For lease renewals, annual rent growth hit a new all-time high in July 2022, reaching 7.9%. Between 2015 and 2019, SFR renewal rent growth consistently ranged between 3.3% and 5.0%. Since February 2021, SFR renewal rent growth has topped 5.0% in 18 consecutive months, marking an unrivaled period of sustained gains.
Even if V2O rent growth continues to slow, renewal rent growth is likely to have a longer stretch of above-average increases. From 2015 through the end of 2020, renewal rent growth, on average, outpaced V2O by 0.5% per year. Since 2020, the trend has flipped, with V2O rent growth outpacing renewals by an average of 4.8% per year. As a result, renewal rent growth is likely to close that gap over the next several months.
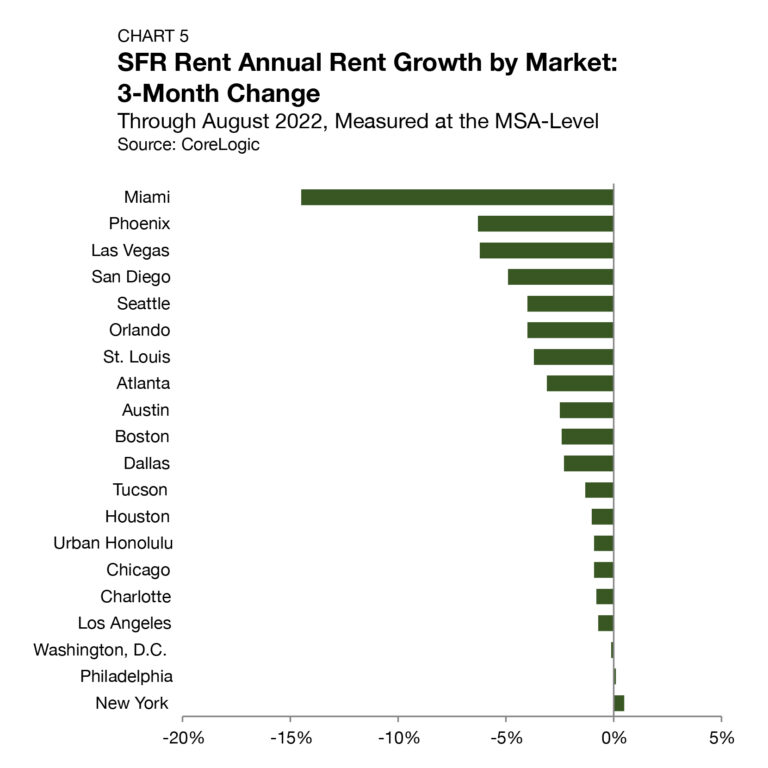
Looking at annual rent growth at the market level, the Sun Belt continues to be a national leader even as growth rates have reached an inflection. According to CoreLogic’s Single-Family Rent Index (SFRI), Miami, Orlando, and Atlanta had the highest annual rent growth across the top 20 U.S. metros through August, climbing by 25.0%, 20.8%, and 11.7%, respectively. However, compared to three months ago, annual growth rates have slowed sharply. Miami has seen the most dramatic slowing, with its annual growth rate dropping by 14.5 percentage points (Chart 5). Of the 20 markets tracked by CoreLogic, only two (New York and Philadelphia) posted higher annual growth totals in August than in May.
Cap Rates
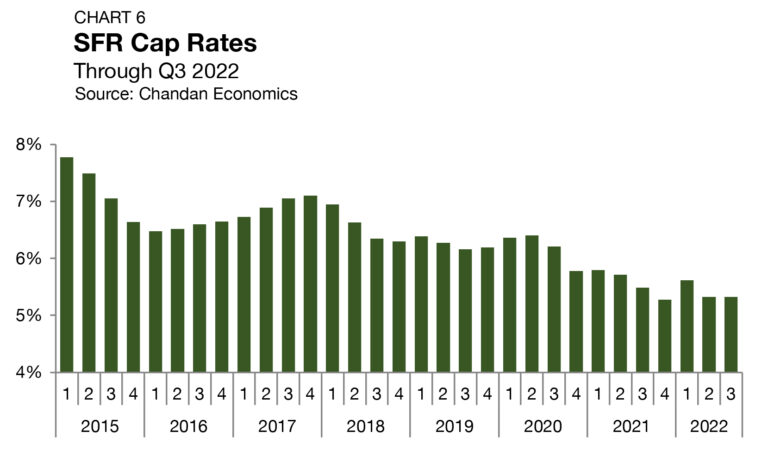
Property-level yields for SFR assets remained flat in the third quarter of 2022, holding at 5.3% (Chart 6).1 The most recent observation keeps SFR cap rates anchored at their all-time low. While cap rates have been compressing, single-family homes have been consistently appreciating. However, the ground has started to shift in recent months. According to the S&P/Case-Shiller Home Price Index, average U.S. home prices fell in both July and August.
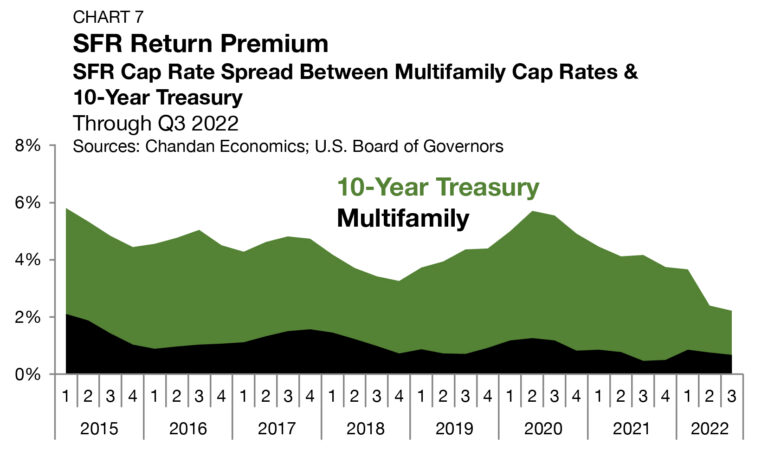
The spread between SFR cap rates and 10-year Treasury yields approximates the SFR risk premium. Unwavering SFR cap rates in the third quarter of 2022, matched with growing Treasury yields, narrowed the risk spread by 17 bps — its fourth consecutive quarterly decrease. In total, the risk premium sits at just 223 bps, which is another record low (Chart 7). Compared to one year ago, this risk premium is down by 194 bps.
The cap rate spread between SFR assets and multifamily properties marginally narrowed, by 9 bps, settling at 68 bps. Over the past decade, SFR-multifamily cap rate spreads have fallen from a high of 496 bps in 2012. Increased liquidity and tech adoption have allowed the SFR sector to operate more efficiently over the past decade, generating a bid-down of its risk premium. Over the long term, some positive yield differential between SFR and multifamily assets remains likely — accounting for the co-location efficiencies and shared physical inputs.
Pricing
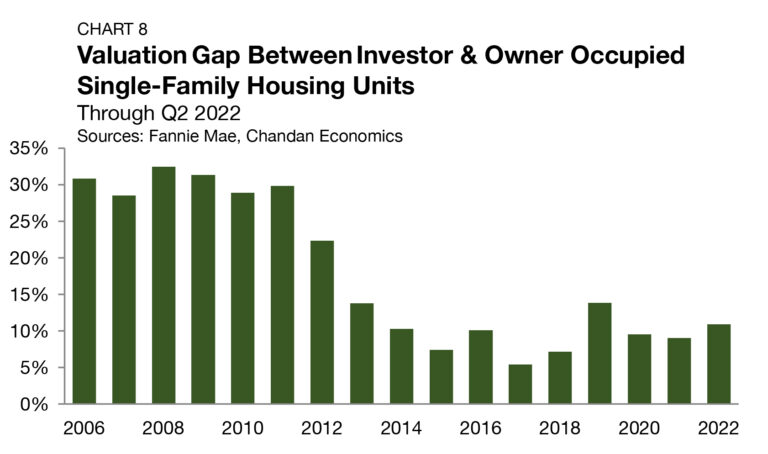
There are consistent differences between the average assessed property values on mortgages originated to single-family owner-occupants versus single-family investors since 2006. Investors are incentivized to target value-add assets rather than paying top dollar for value that already exists. Additionally, investor-owned SFR properties have vacancies, turnover, and management-related expenses that owner-occupied units do not have, contributing to lower values for the rental units.
Nevertheless, the gap has narrowed dramatically over the past decade, coming down from above 30% in the aftermath of the Financial Crisis to the 10% range where it sits today, according to an analysis of Fannie Mae securitized mortgages. The valuation gap has averaged 10.9% in 2022, rising 189 bps from its average last year (Chart 8).
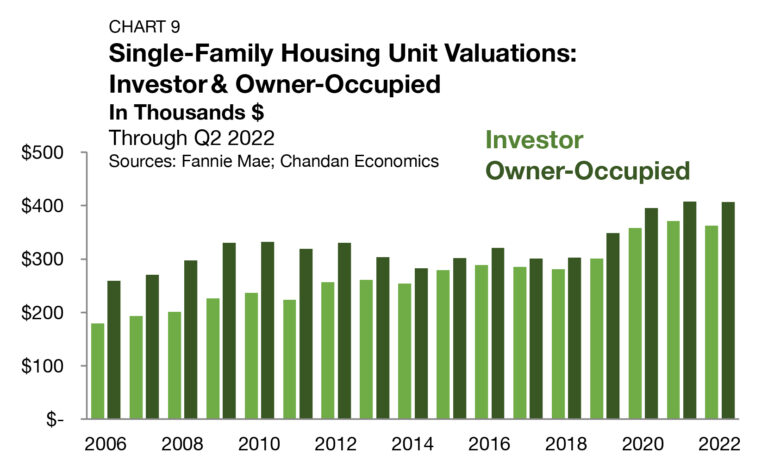
A slight annual increase in the valuation gap has emerged as valuations across all single-family properties have declined this year. The average underwritten value of a single-family investment property through the first half of 2022 was $362,302, a drop-off of 2.3% from the 2021 average. Owner-occupied units held an average underwritten valuation of $406,541 in 2021, down 0.3% from last year (Chart 9).
Debt Yields
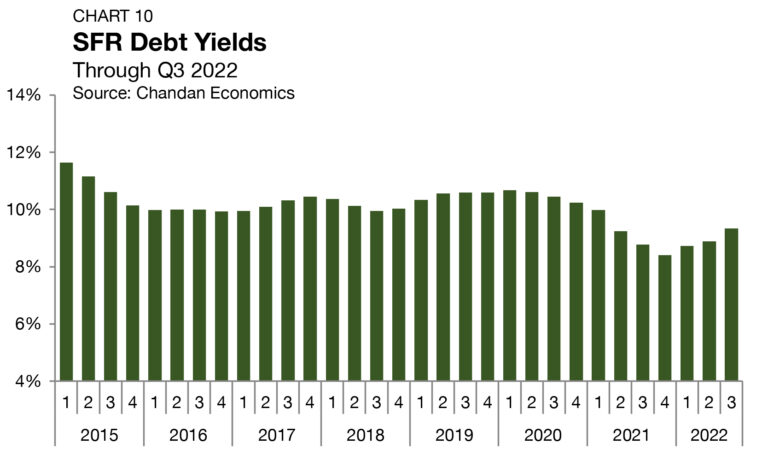
Debt yields, a key measure of credit risk, rose by 46 bps during the third quarter of 2022, jumping to 9.3% (Chart 10). The rise marked the third consecutive quarterly increase, signaling that lenders are exercising caution as economic headwinds mount and the housing market slows.
The rise in debt yields over the past three quarters translates to SFR investors securing marginally less debt capital for every dollar of property-level net operating income (NOI). Through the third quarter of 2022, SFR debt declined to $10.70 for every dollar of NOI, a decrease of $0.55 from the second quarter and $0.69 from the same time last year.
Supply & Demand Conditions
Residential Default Rates
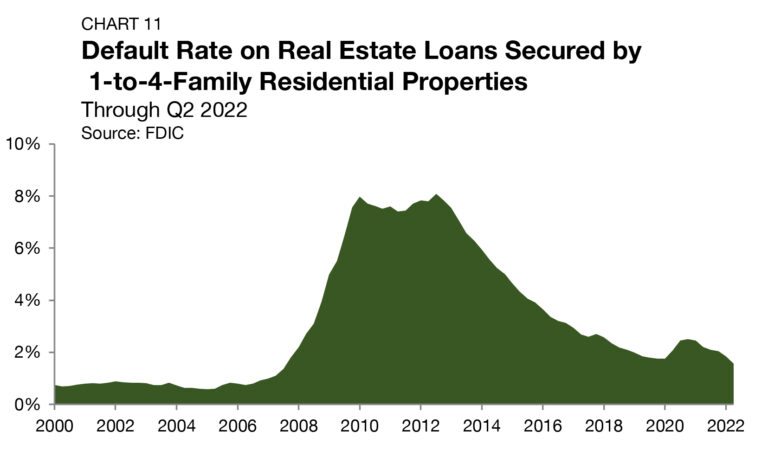
According to the Federal Deposit Insurance Corporation (FDIC), mortgage default rates fell to a new post-Financial Crisis low of 1.6% in the second quarter of 2022 — a positive sign that, despite the housing market’s pricing slowdown, borrower distress remains exceptionally limited (Chart 11).
In the aftermath of the 2008 housing crisis, investors with available financing took advantage of the market dislocation, acquiring large portfolios of single-family assets at steep discounts. A similar scenario happening again in this current market is extremely unlikely. Central to the 2008 housing market crash were several factors, such as a deteriorating labor market, relatively high average debt burdens for households, and overexposure of the U.S. banking system to mortgages, which are not present today.
Build-to-Rent
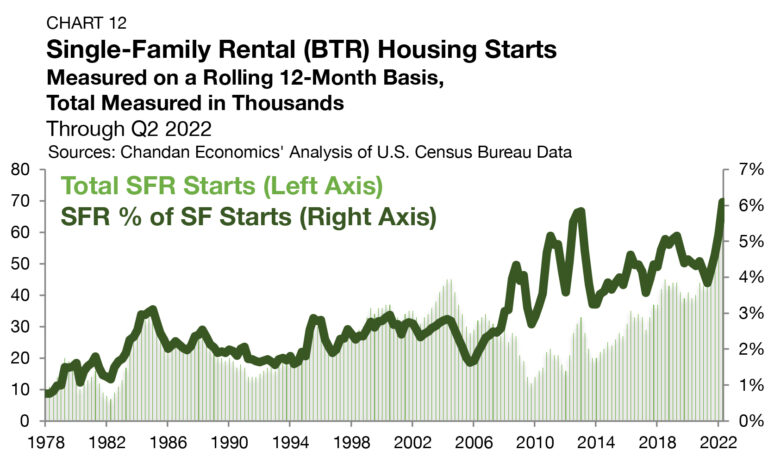
Purpose-built SFR properties, known as BTR communities, are becoming a defining feature of the SFR sector, especially within the institutional slice of the market. In the past year, BTR has accounted for 6.1% of all single-family construction starts, a new record for the product type.
Between 1975 and the start of the prior recession in 2007, BTRs accounted for a little less than 2.0% of all single-family construction starts, according to an analysis of Census Bureau data.
Over the past decade, BTR construction activity has risen appreciably. By unit count, there were 69,000 BTR construction starts in the year ending in the second quarter of 2022 — a 60% growth rate from a year earlier and a new all-time high (Chart 12). The second-quarter total is a 17% jump from its previous all-time high, which was reached just in the prior quarter.
While recent construction totals represent significant market expansion, they are also likely to be understated. The BTR estimate does not include units that have been started and sold to SFR operators (build-for-rent or BFR), as covered in a recent Arbor-Chandan article.
Tracking Demand
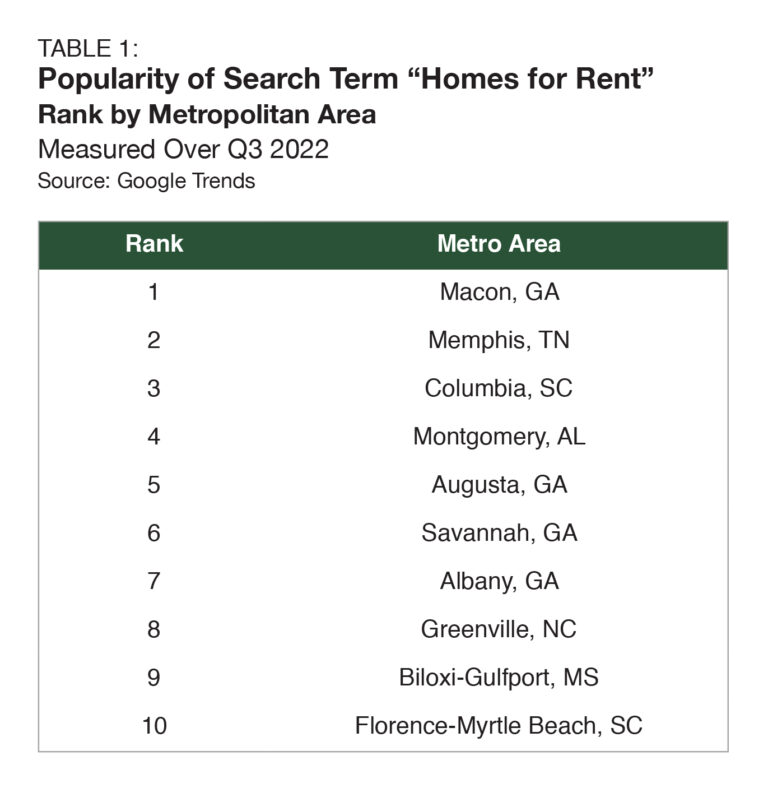
Using Google Trends to track the popularity of the search term “homes for rent” can help identify potential hotspots for SFR demand. Macon, GA, was the area where “homes for rent” was searched most during the third quarter of 2022, dethroning Memphis, TN (Table 1). All the metros within the top 10 most searched locations are found in the Sun Belt — further evidence of the region’s epicenter status for the SFR industry. In addition to demand-side factors, lower average land prices in the Southeast have made the region more attractive to large-scale SFR strategies.
Outlook
Following 2022’s marquee year, SFR’s outlook remains highly favorable. In the newly released ULI-PwC 2023 Emerging Trends in Real Estate, rental housing investors remain firmly upbeat about the sector, giving it the second-highest “buy” rating of the six polled residential sub-types. A plurality (42.3%) of investors rate SFR as a buy, compared to just 17.0% giving the sector a “sell” rating. On the horizon, there are some warning signs to watch. Namely, the sustainability of record-low capitalization rates should be in question as home prices decline and lenders raise their required debt yields. However, the immediate outlook for the SFR sector remains positive. All else being equal, its position as the homeownership alternative should be seen as a sign of countercyclical stability in the current market environment while the long-term tailwinds of institutionalization and professionalization will remain at the sector’s back.
1 Unless otherwise noted, the Chandan Economics data covering single-family rental cap rates and debt yields are based on model estimates and a sample pool of loans. Data are meant to represent conditions at the point of origination.
For more single-family rental research and insights, visit arbor.com/articles


