Whether you are just beginning your investing journey or are looking to take your portfolio to the next level, Arbor stands ready with our talented team and decades of expertise. Given our vast experience and national footprint of successful deals, we are familiar with many common commercial real estate investor questions, such as the ones answered in this article.
Top Opportunities in Large Multifamily Investment Report 2022
Overview
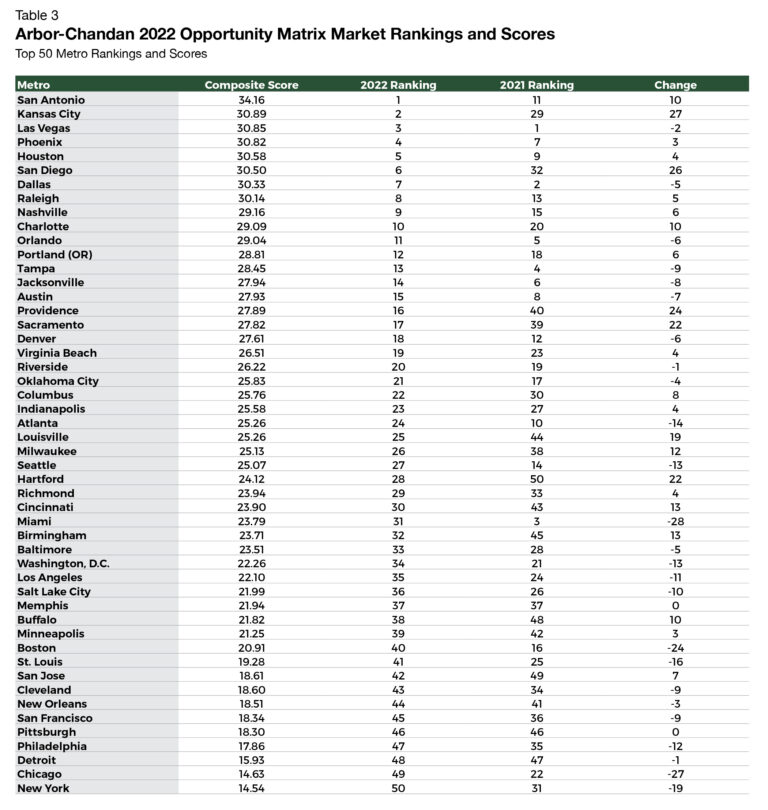
In an otherwise uneven economic environment, multifamily real estate and other investment classes adept at absorbing inflationary pressures have outperformed the rest. Within the surging multifamily sector, certain markets shined brightly this year. The 2022 Arbor Realty Trust-Chandan Economics Large Multifamily Opportunity Matrix highlights the top 50 U.S. metros for investment.
Methodology
This report presents an analytical framework to develop a cross-market comparison for large multifamily investments. For the purposes of this analysis, “large multifamily” is considered to be assets containing 50 or more units with a valuation exceeding $20 million (note: $15 million original balance was used as a cutoff for large multifamily loans).
The top 50 U.S. metros1 are ranked using the Arbor-Chandan Large Multifamily Opportunity Matrix based on a composite of performance metrics. The Opportunity Matrix pays specific attention to how well metro-level economies have maintained strength over the past year and how markets have been positioned to benefit from continued labor and housing market shifts in 2023 and beyond. Overall, the matrix finds three western markets best suited to build on their strengths in the year ahead: San Antonio, Kansas City, and
Las Vegas.
Key Findings
- Robust population growth and a relatively low level of new development make San Antonio the top target for multifamily investment.
- Orlando stands out as the nation’s leading WFH importer, boasting a high share of new remote workers, many of them recent arrivals.
- Las Vegas, previously the third-ranked market, remains near the top of the matrix largely due to its success in attracting remote workers.
PDF link below
The Opportunity Matrix
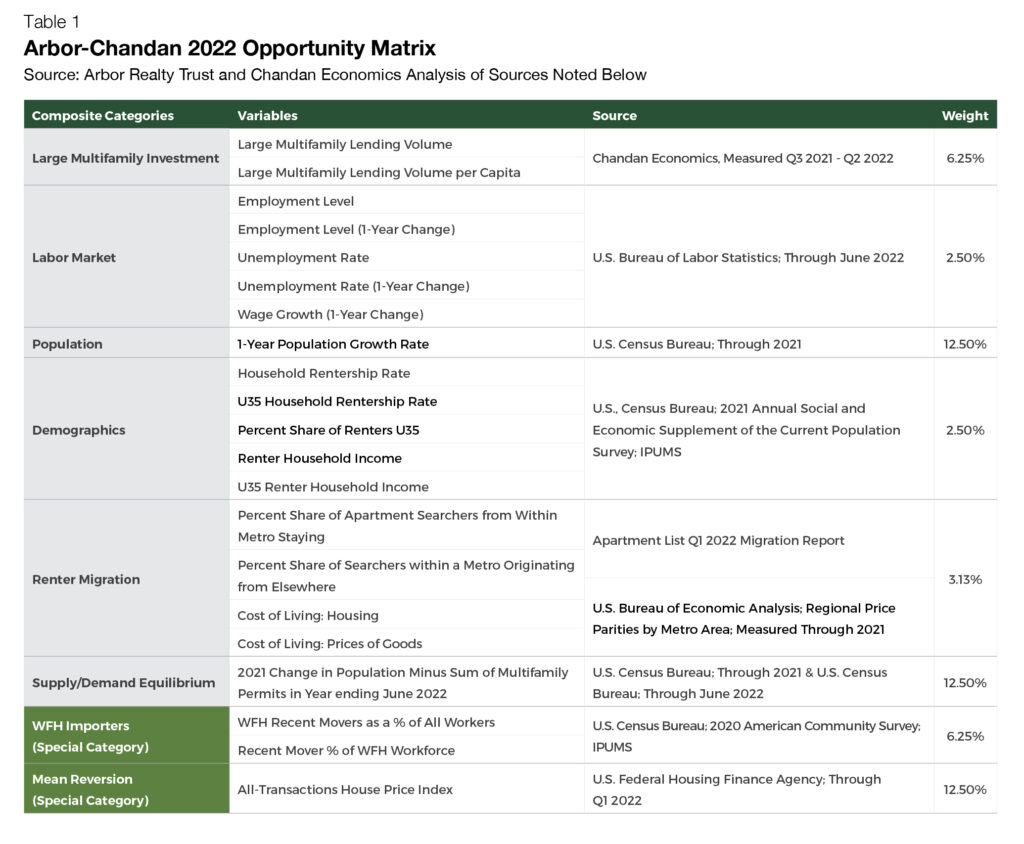
The 2022 Arbor-Chandan Large Multifamily Opportunity Matrix (Table 1) measures eight key categories:
- Large Multifamily Investment: measured as a proxy for debt financing availability, overall liquidity, and a market’s ability to support additional multifamily investment. Multifamily loans (both acquisitions and refinancings) with original balances above $15 million are included for analysis.
- Labor Market: topline profile of key labor market performance indicators, including market size and growth, unemployment rate, change in the unemployment rate over the past year, and wage growth.
- Population Growth: overall growth of a metro over the short and medium term.
- Renter Demographics: spending power and age profile of existing renters (higher household incomes and younger householders assumed as conducive for higher levels of multifamily demand).
- Renter Migration: measures the market’s ability to retain existing renters and attract renters from elsewhere, as well as market-level affordability.
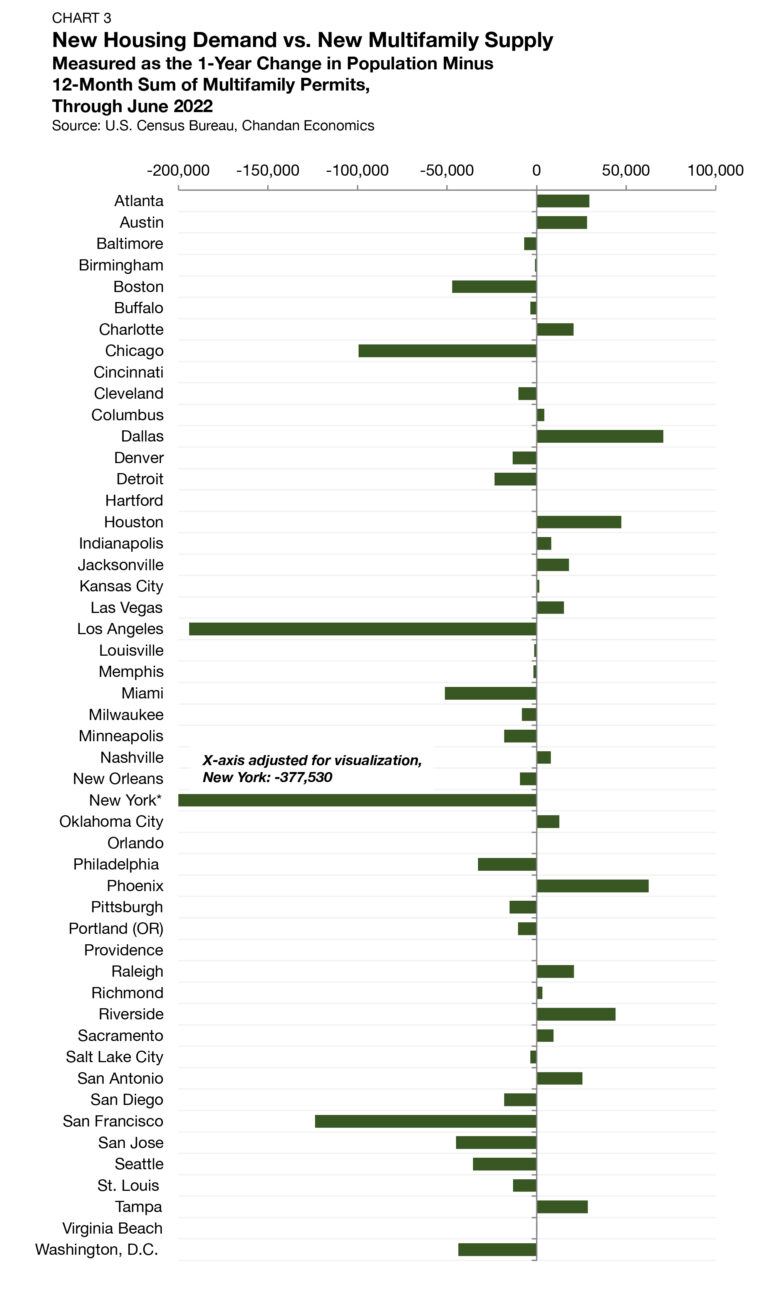
- Supply/Demand Equilibrium: compares aggregate population increases to the volume of new multifamily permitting activity as a proxy for market tightness and ability to absorb new, large-scale multifamily supply.
- Work From Home (WFH) Importers: proxy measures of which markets are attracting WFH workers from elsewhere.
- Mean Reversion: a control that accounts for 2021’s rapid increase in residential asset values and the possibility of a price correction.
Top Ranked Markets
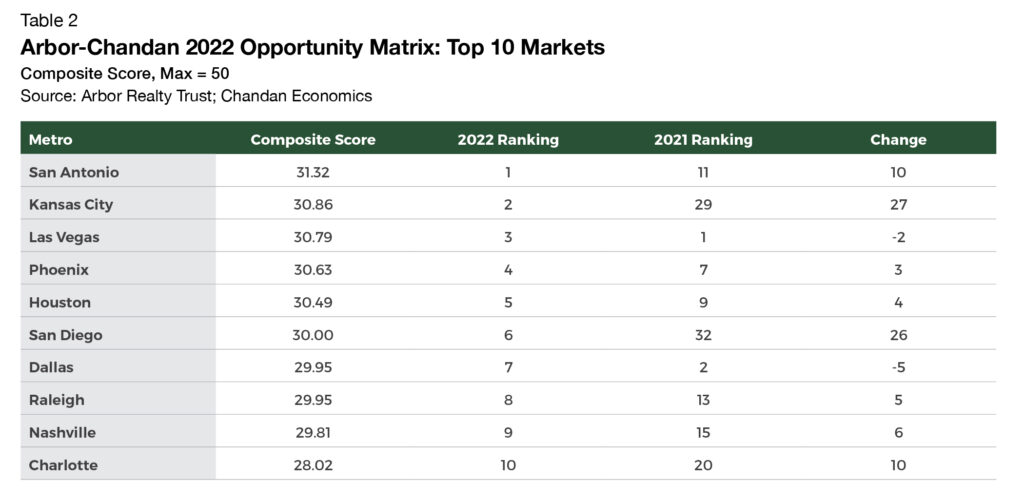
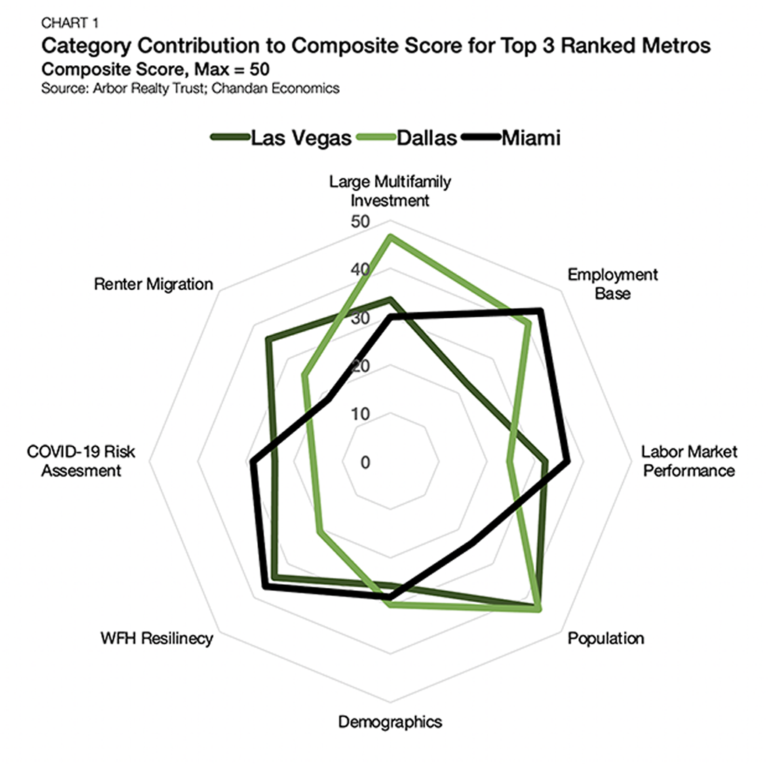
San Antonio is 2022’s top-ranked market, thanks to a well-rounded set of fundamentals, including one of the highest population growth rates in the country (Chart 1). Across the 21 data point inputs in the matrix, San Antonio scored better than the median metro in 15. Further, when comparing San Antonio’s population in-flows to the amount of new multifamily supply that is coming on board, it has one of the nation’s largest supply gaps, which should benefit multifamily investment outcomes. With the largest state-level economy in the country, Texas has made recent concerted efforts to increase inter-city mobility. While not as ambitious as the planned high-speed rail between Dallas and Houston, San Antonio and Austin are adding new public bus routes between the two cities — doubling down on their geographic proximity.
For a full breakout of the 2022 and 2021 MSA composite scores and rankings, see Table 3 in the Appendix at the back of the report.
After appearing as a middle-of-the-pack metro in 2021 (ranked 29 out of 50), Kansas City claimed the No. 2 spot in the 2022 rankings. Relative to its population, Kansas City had the 4th-most large multifamily lending volume of all top 50 metros in the year ending in the second quarter of 2022. Kansas City also performed favorably in key measures of renter attractiveness. It had the 10th most affordable cost of housing and the 10th highest share of apartment searchers looking to stay within the metro. In other words, Kansas City has a strong pitch for alluring new rental demand and succeeds at retaining renters to stay once they get there. Missouri’s largest city is also proving to be a laboratory for modern urbanism. In 2020, Kansas City became the first major metropolitan metro to launch a zero-fare mass transit pilot program. According to REBusinessOnline, there is currently “no end in sight” for Kansas City’s expanding multifamily housing needs.
Large Multifamily Lending
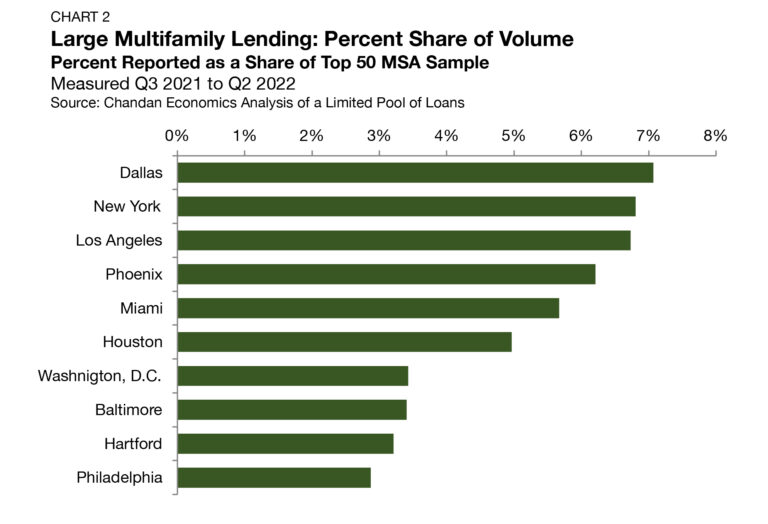
Large multifamily investment across U.S. markets has been anything but uniform. Here, we analyze a pool of loans across the top 50 metros with originations between July 2021 and June 2022 and original balances above $15 million. Lending volumes include loans originated for both investment sales and refinancings. These data are leveraged as a proxy to determine which markets have the most liquidity to support large multifamily investments. Leading the way were Dallas, New York, and Los Angeles, which accounted for 7.1%, 6.9%, and 6.8% of the observed sample, respectively (Chart 2).
Supply/Demand Equilibrium
In this category, we compared metro markets’ 2021 population inflows to the volume of multifamily permitting activity over the 12 months ending June 2022. This framework is intended to proxy market tightness and demand for new supply. Markets with greater population inflows relative to the addition of new multifamily housing supply could expect upward pressure on pricing. Applying the logic on the reverse side of the spectrum, markets with population outflows or high levels of new multifamily construction relative to incoming housing demand could expect a softening of price pressures.
Dallas, which was the 7th ranked market in the overall matrix, ranked first in this category (Chart 3). Dallas’ population increased by 97,290 people in 2021 while 26,537 multifamily permits were tracked over the sample window. Other top performers in this category were Phoenix and Houston. New York and Los Angeles trailed behind thanks to sizable population outflows in 2021.
Work From Home
Historically, housing demand has been viewed as a function of local labor demand. The more jobs in an area, the more people would choose to co-locate in proximity, creating upward pressure on rental demand. The proliferation and diffusion of remote employment in recent years has disrupted the geographic relationship between where people work and where they live.
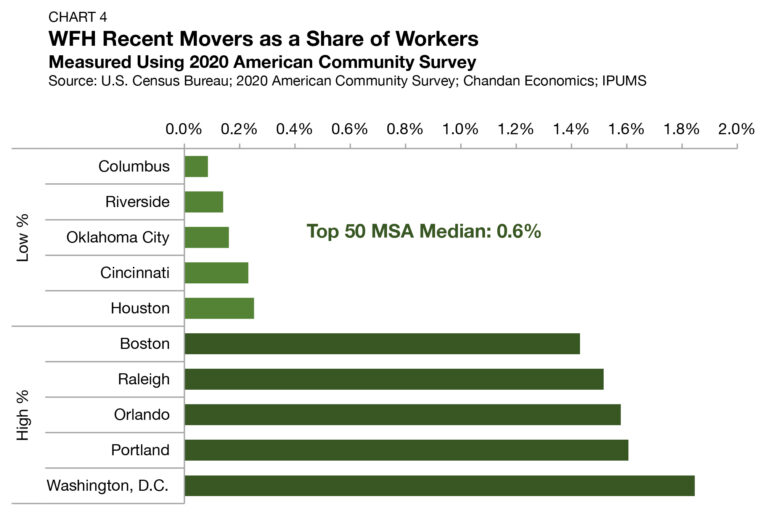
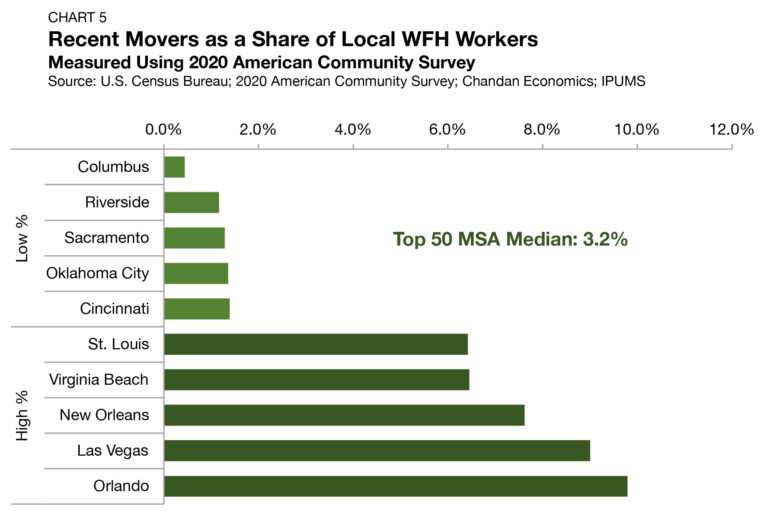
For this analysis, we sought to establish a framework that would identify which markets have been successful at attracting remote workers. Markets that are WFH importers should have an advantage in growing their rental demand base. Utilizing the 2020 American Community Survey, the following two data points were calculated and factored into the opportunity matrix:
1. WFH recent movers as a % of all local workers
2. Recent movers as a % of the local WFH workforce
For this analysis, individuals who reported having a job while having no commute time were considered “WFH workers.”
Measuring newly arriving remote workers as a percentage of total workers in the metro area, Washington, D.C., had the highest share in the nation, at 1.8% (Chart 4). Next were Portland (1.6%) and Orlando (1.6%). On the other end of the spectrum, Columbus (0.1%), Riverside (0.1%), and Oklahoma City (0.2%) had some of the lowest shares of newly arriving remote workers.
Looking only at the WFH workforce and what share had recently moved to each market, a different set of metros rises to the top. The only crossover was Orlando, where 9.8% of its WFH workers had recently moved — the highest share in the nation (Chart 5). Following Orlando were Las Vegas (9.0%) and New Orleans (7.0%).
Mean Home Price Reversion
Factoring heavily into the 2022 opportunity matrix are considerations for mean reversion. For this analysis, the mean is the national growth rate for all home values last year. Metros were compared based on how far local home price growth differed from the national average.
All of 2021 and early 2022 were exceptionally robust periods for residential valuation growth. On average, home prices grew 19.5% over the 12 months ending in March 2022 — 14.3% above their 2015-2019 average (5.2%). The trend held up for apartments as well. According to the MSCI Real Capital Analytics CPPI for apartments, asset prices grew by a steep 21.8% in 2021, rising 11.9% above their 2015-2019 average growth rate (9.8%).
There is a higher risk for downward price adjustments in markets that saw the most appreciation over the past year. In other words, given how quickly and by how much property values soared through 2021 and early 2022, mean reversion may be at play.
In designing this framework, the model assesses and ranks how closely home prices rose in respective markets compared to the national average. In doing so, the model penalizes some of last year’s most standout markets, including Austin (+33.3%), Phoenix (+30.1%), and Tampa (+29.0%). At the same time, some of last year’s laggards also received poor rankings here, including San Francisco (+9.5%), New York (+11.4%), and Philadelphia (+13.4%). The markets that tracked most closely to the national average last year, Portland (+19.1%), Los Angeles (18.9%), and Indianapolis (19.8%) were rewarded in this ranking system.
Market Spotlight: San Antonio
The San Antonio metropolitan area has dug in its spurs, rising to the top of the 2022 Opportunity Matrix. Simply put, San Antonio is expanding its metro-level population and is proving to be an attractive destination for renters.
Population trends in the San Antonio metro area point to sustained growth in multifamily demand. In 2021, the San Antonio population grew by 35,105 people. Its 1.4% annual growth rate was the fifth highest in the country. Since 2011, San Antonio’s population has swelled, expanding by 18.6% over that time — nearly three times higher than the national growth rate over the same period (+6.4%). Looking ahead, San Antonio’s “population is forecasted to grow at twice the national rate, and even faster in the 20–34-year-old prime renting cohort,” according to Fannie Mae.
Beyond the inflow of new housing demand, demographic trends are also broadly supportive of San Antonio’s multifamily sector. It ranked 11th for the highest share of renter households and the highest rentership rate for households headed by persons under the age of 35. Further, the ascending Texas metro had the 10th highest average renter household income in the country.
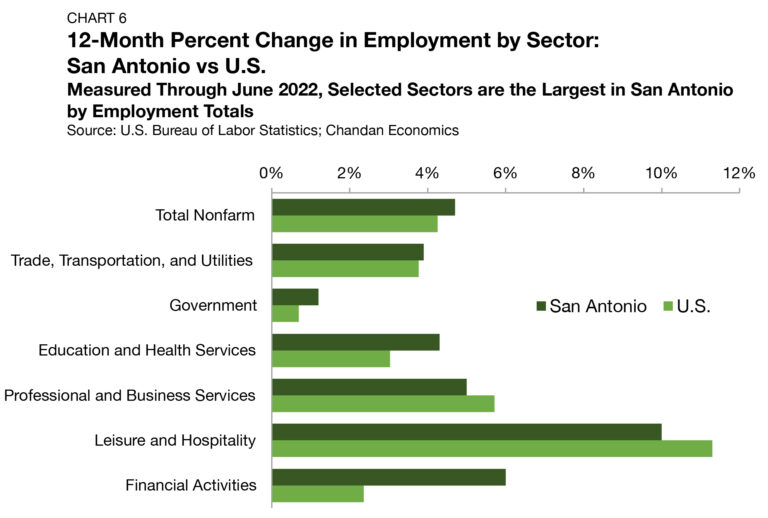
The San Antonio labor market has both retained its strength throughout the pandemic, as well as built upon it. While Austin often receives a lot of attention as Texas’ dominant tech hub, San Antonio is quietly making a name for itself in this arena as well. According to a Brookings analysis, San Antonio was among a collection of secondary metros to gain from the dispersion of tech jobs as workers no longer needed to co-locate near a physical office place during the pandemic. Financial services, while just San Antonio’s sixth largest sector, is also a significant area of opportunity. Through June 2022, San Antonio had already eclipsed its pre-pandemic financial employment peak by 3.9% (Chart 6). Further, its finance sector is growing at a 6.0% annual rate, more than twice the national average (+2.4%).
Altogether, the San Antonio multifamily market is ripe with possibility. According to Yardi Matrix’s May 2022 report on the metro, occupancy rates were holding above 95%, and a slowed pipeline of apartment deliveries is likely to keep upward pressure on rents in the near term. Desirable urban amenities (such as the River Walk), the availability of developable downtown sites, strong population growth, and desirable demographic factors all combine to make San Antonio the rising star of the Lone Star state.
Outlook
In 2022, the multifamily investment environment finds itself in uncharted territory once again. Historic increases in asset prices over the past year reasonably should give investors pause, especially since the Federal Reserve appears unlikely to slow its monetary tightening cycle. At the same time, multifamily assets are uniquely positioned to capture additional housing demand as the cost of homeownership has risen. All else equal, the U.S. multifamily market is likely to remain balanced by headwinds and tailwinds over the year ahead. The future of WFH, and most critically, the geographic relationship between one’s home and job, is one of the biggest open questions for rental housing demand in the years to come. On a metro-by-metro basis — whether it be along the lines of WFH attractiveness, affordability, urban amenities, or taxes — competition for residents is poised to see an escalation in the years ahead.
Appendix
Disclaimer
All content is provided herein “as is” and neither Arbor Realty Trust, Inc. or Chandan Economics, LLC (“the Companies”) nor their affiliated or related entities, nor any person involved in the creation, production and distribution of the content make any warranties, express or implied. The Companies do not make any representations regarding the reliability, usefulness, completeness, accuracy, currency nor represent that use of any information provided herein would not infringe on other third party rights. The Companies shall not be liable for any direct, indirect or consequential damages to the reader or a third party arising from the use of the information contained herein.


