Articles

Eight Common Commercial Real Estate Investor Questions

Whether you are just beginning your investing journey or are looking to take your portfolio to the next level, Arbor stands ready with our talented team and decades of expertise. Given our vast experience and national footprint of successful deals, we are familiar with many common commercial real estate investor questions, such as the ones answered in this article.

Articles

Multifamily is Well-Positioned for Short- and Long-Term Growth

With the macroeconomy maintaining its underlying strength and a handful of rate cuts expected by the Fed within the next 18 months, green shoots of optimism within the multifamily sector are multiplying. Even as high interest rates impede normal operations, stabilization is underway while the sector’s long-term prospects remain unwavering. In this deep dive, our research teams will explore the tailwinds underpinning the multifamily sector’s short- and long-term outlook.

Refinance of Existing HUD-Insured Loan

FHA® Interest Rate Reduction (IRR) Refinance of Existing HUD-Insured Loan   Arbor provides this program to reduce the interest rate on qualified existing HUD-insured multifamily loans. The HUD-insured loan remains in place, with reduced payments based on the new rate, the current balance, and the remaining term. The existing prepayment penalty must be paid in full. V041624

Mortgage Insurance for Rental Housing for Urban Renewal and Targeted Redevelopment

FHA®220 Mortgage Insurance for Rental Housing for Urban Renewal and Targeted Redevelopment*   Arbor provides FHA-insured, long-term, fixed rate financing for new construction and substantial rehabilitation of multifamily projects nationwide. This program provides for both construction and permanent financing for projects in urban renewal areas and other areas where local governments have undertaken designated revitalization activities. Applications are typically processed in two stages (preliminary application followed by firm application). Affordable/rental assisted projects and HUDexperienced development teams may request a “straight to firm” application, saving significant time by eliminating the preliminary application stage. V020224

Articles

Regional Construction Trends: Annual Multifamily Completions Surged in the South and West

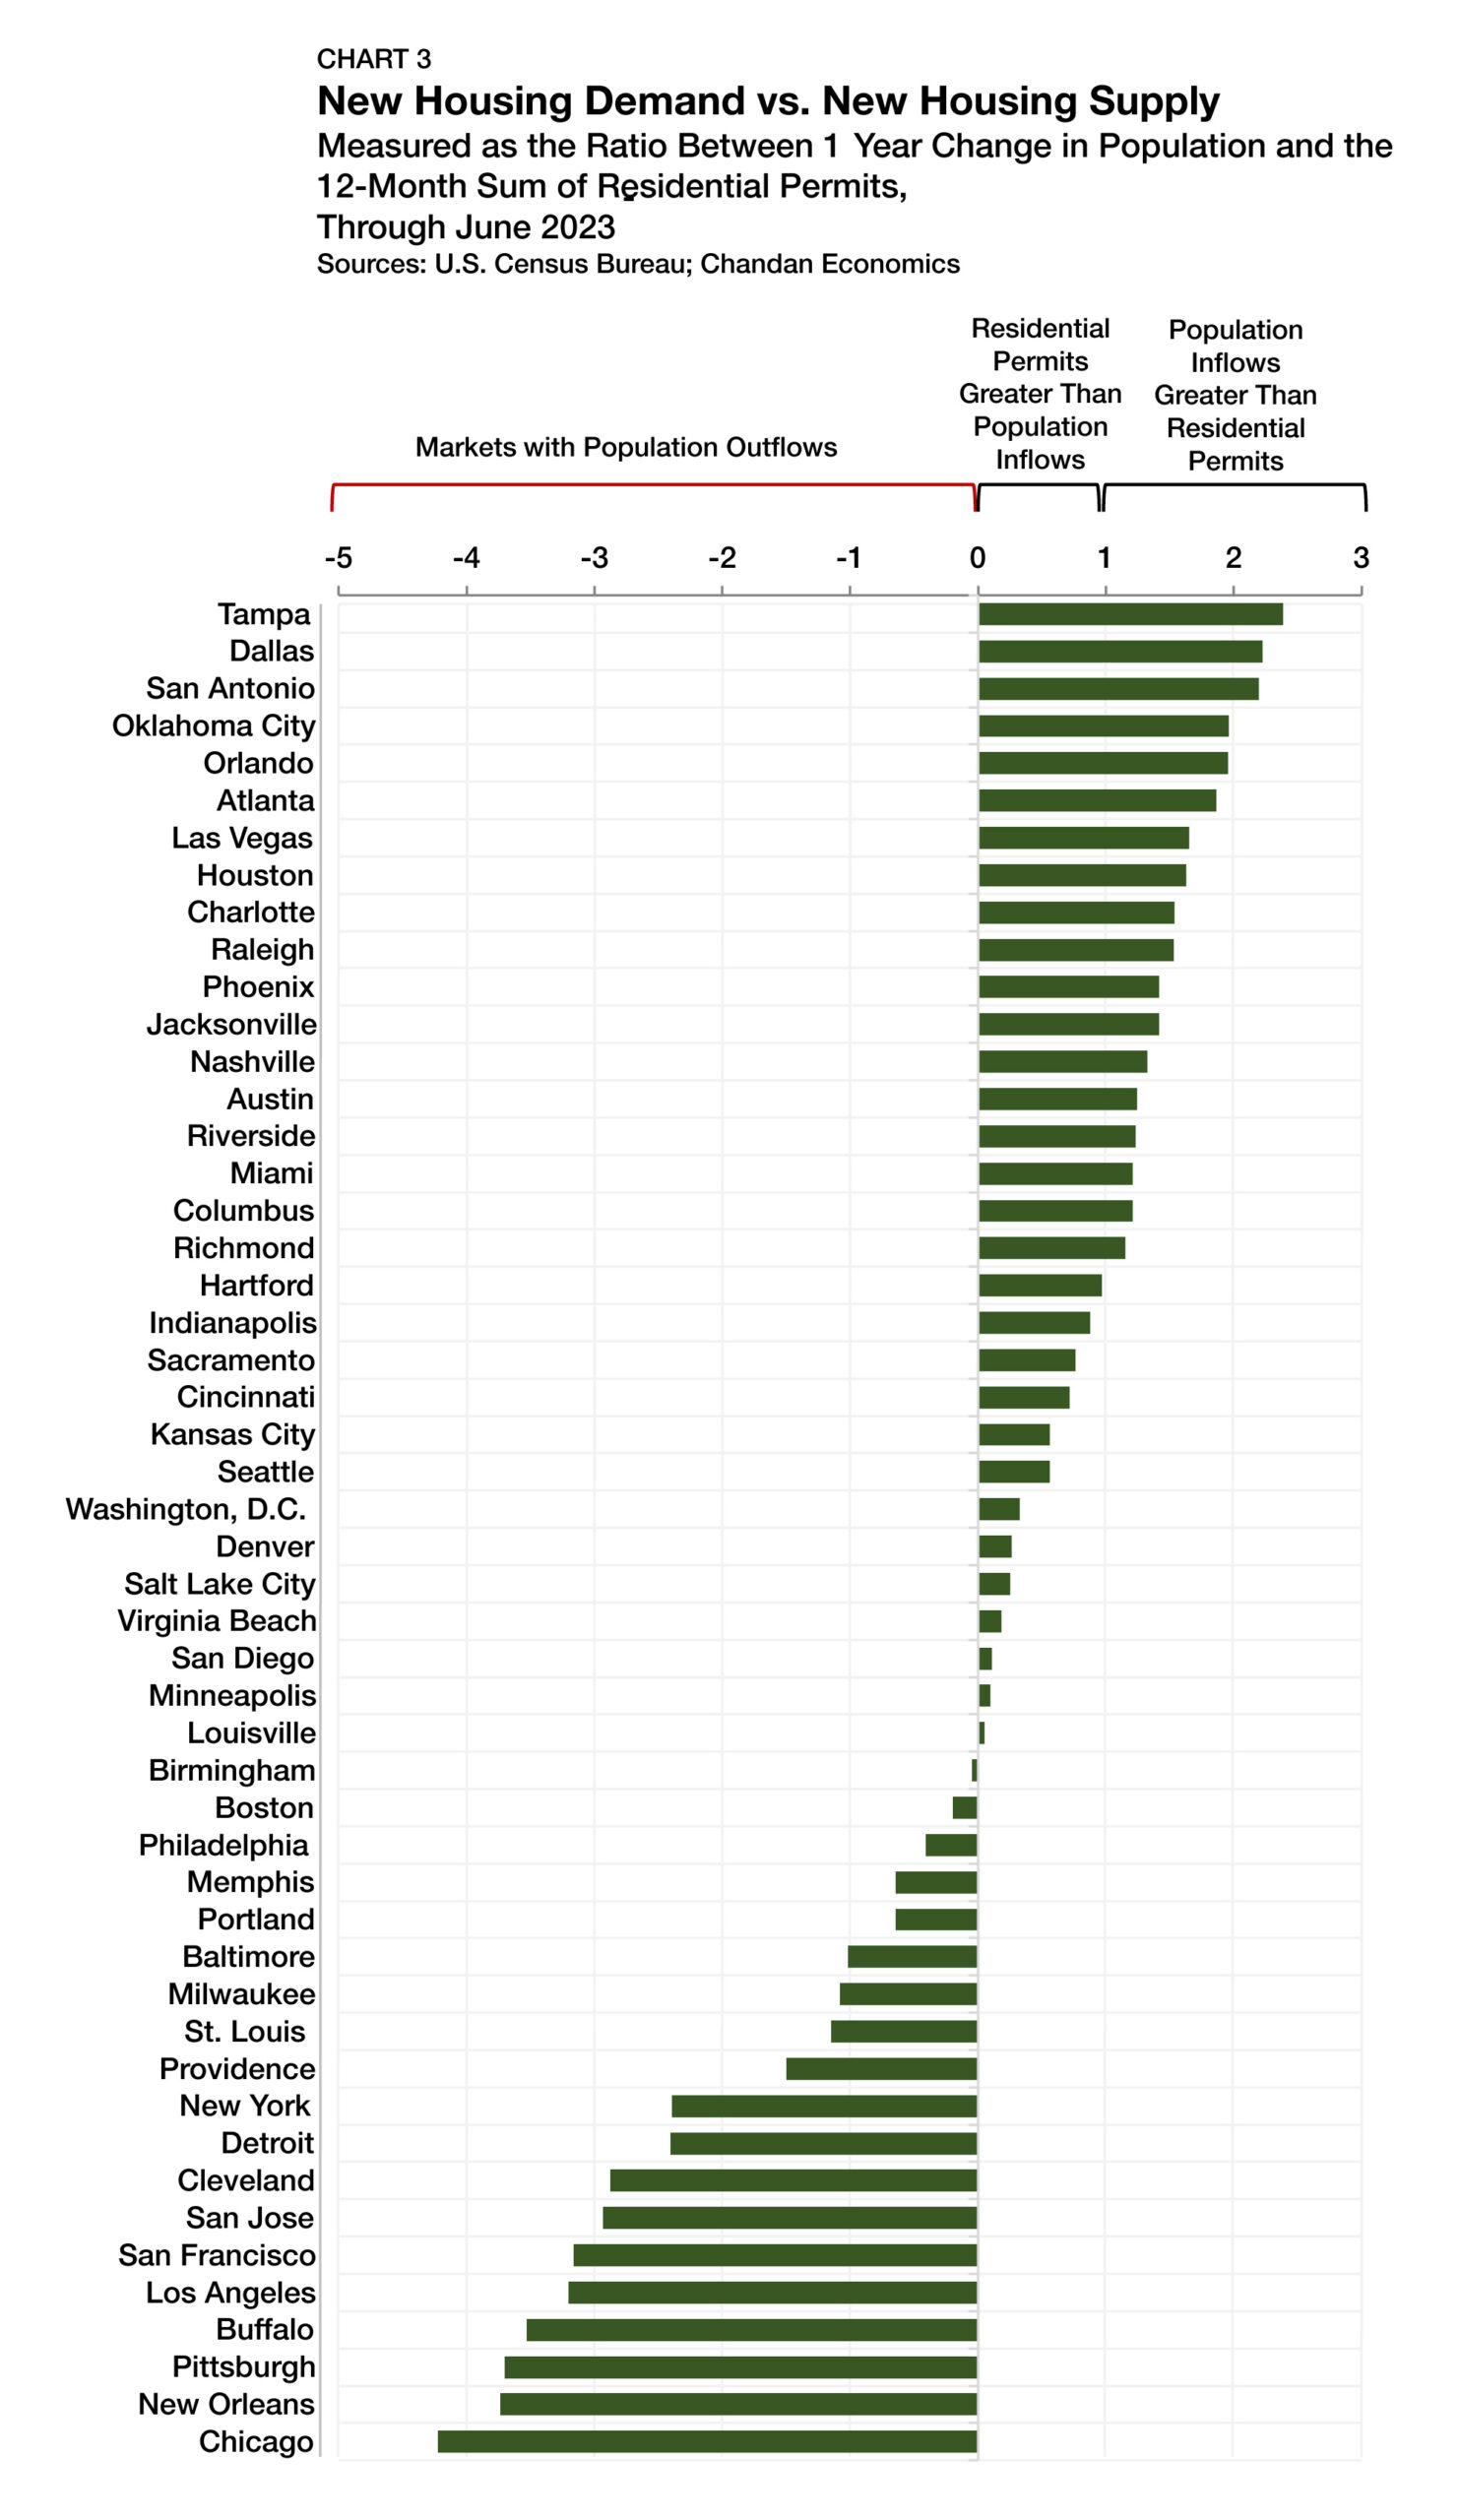
After the volume of newly issued multifamily permits hit a 37-year high in 2022, multifamily completions surged another 22.3% last year. As the sector continues to gain strength, its growth has remained concentrated in the southern and western regions of the country, according to an analysis of new data from the U.S. Census Bureau’s Survey of Construction.

Articles

The Evolving Characteristics of Multifamily Construction

During the post-global financial crisis (GFC) cycle, a disproportionate share of new multifamily construction was of high-rise units in properties with amenities. However, the tides have turned. The rising cost of homeownership has brought the need for more affordable housing development in the U.S. to the top of many legislative agendas. In this deep dive, our research teams utilize data from the U.S. Census Bureau’s Annual Survey of Construction to show how and why the characteristics of new multifamily properties continue to evolve alongside shifting market needs.

Articles

Video: Growing LGBTQIA+ Visibility in the CRE Industry

LGBTQIA+ Pride Month is recognized in June, but its lessons are timeless. During a recent conversation between Tres Seippel, Director, Construction Management at Arbor, and Dr. Sam Chandan, Founder of Chandan Economics, Founding Director, NYU Chen Institute for Global Real Estate Finance, and Co-Chair of the Real Estate Pride Council, Seippel shared why it is more important than ever for the industry to embrace visibility and show support for employees who identify as LGBTQIA+ or other diverse backgrounds.

General: 800.ARBOR.10


Overview

In 2023, investors need a sharp eye to pinpoint the top multifamily real estate opportunities. With elevated interest rates and volatility becoming the new normal, the risk vs. opportunity assessments of individual markets have shifted as domestic migration and insurance market corrections have changed the calculus.

The Arbor Realty Trust-Chandan Economics Large Multifamily Opportunity Matrix analyzed the top 50 U.S. metros for real estate investment to identify those markets most prime for apartment sector growth in 2023. Rising to the top this year were Orlando, Austin, and Charlotte, three attractive Sun Belt markets ripe with opportunity.

Methodology

This report presents an analytical framework to develop a cross-market comparison for opportunistic multifamily investments. For the purposes of this analysis, “large multifamily” is considered to be assets containing 50 or more units with a combined valuation exceeding $20 million.

The top 50 U.S. metros1 are ranked using the Arbor-Chandan Large Multifamily Opportunity Matrix based on a weighted average of performance metrics. The Opportunity Matrix pays specific attention to how well metro-level economies have maintained strength over the past year and how they are positioned to handle shifting market conditions in 2024 and beyond.


1 The top 50 metros are based on population estimates. All metros are reported at the Metropolitan Statical Area (MSA) level.

Key Findings

  • Orlando is 2023’s most desirable metropolitan market for large multifamily investment due to its robust population growth, a rapidly growing financial services sector, and low risk of natural hazards.
  • The biggest cities in the U.S., including New York, Los Angeles, San Francisco, and Chicago, have become less attractive to multifamily investors as these metros become less affordable and more renters move elsewhere.
  • Austin ranked second out of 50 as it continues attracting new residents and has the highest percentage of renters under 35 of all metros on the list.

PDF link below

The Opportunity Matrix

The Opportunity Matrix measures eight key categories, each described in more detail on the next section.

  1. Large Multifamily Investment: measured as a proxy for debt financing availability, overall liquidity, and a market’s ability to support additional multifamily investment. Multifamily loans (both acquisitions and refinancings) with original balances above $15 million are included for analysis.
  2. Labor Market: topline profile of key labor market performance indicators, including market size and growth, unemployment rate, change in the unemployment rate over the past year, and wage growth.
  3. Population Growth: overall growth of a metro over the short and medium term.
  4. Renter Demographics: spending power and age profile of existing renters (higher household incomes and younger renters assumed as conducive for higher levels of multifamily demand).
  5. Renter Vacancy: measures the current market tightness for all existing
    metro-level rental inventory.
  6. Supply and Demand Equilibrium: compares aggregate population increases to the volume of new multifamily permitting activity as a proxy for market tightness and ability to absorb new, large-scale multifamily supply.
  7. Affordability: minimum income needed to rent an apartment without
    being rent-burdened, included to capture a market’s attractiveness for
    incoming rental demand.
  8. Climate Risk: measures both risk and readiness, included to account
    for the increasing frequency of natural hazards and the evolving property insurance landscape.

The Opportunity Matrix includes factors a multifamily investor might consider in their market selection process. All eight categories have received equal weighting. In categories with more than one variable, each variable received equal weighting.

Top Ranked Markets

Orlando is 2023’s top ranked market due to its well-rounded fundamentals and impressive labor market performance over the past year (Chart 1). A premier travel destination, this central Florida city performed better than the average metro in a majority of the variables measured in the matrix. For instance, Orlando’s population inflows were impressive. In 2022, the Orlando metropolitan area saw its resident population swell by 2.4% — the second-highest mark in the country. Due in part to its inland location (42 miles from the ocean), Orlando has not only the lowest climate risk score in Florida but one of the lowest in the country.

For a full breakout of the 2023 scores and rankings, see Table 3 in the Appendix at the end of the report.

Now, with the introduction of Brightline, a privately operated high-speed train line, Orlando and Miami are enjoying the benefits of integrating two thriving economies.

Austin, the home of many large tech companies, claims the No. 2 spot in this year’s rankings. With the rental vacancy rate in Austin sitting at 7.3%
(1.6 percentage points above the top 50 median) and rents falling 1.8% year-over-year through July, the capital of Texas is going through a transition phase as it absorbs a deluge of new housing supply. Still, signs of a turnaround are already underway, and Austin’s demand drivers are too strong to ignore. Austin’s 2022 population growth rate reached 2.7%, which was 0.3 percentage points higher than any of the other 50 metros. Further, 50.8% of Austin’s renters are below 35 years of age, leading all other markets.

After ranking 10th in 2022, Charlotte has shot up the board to round out this year’s top 3. North Carolina’s largest city, where households can comfortably rent an apartment with an income of about $75,000, remains more affordable than the top 50 market average of $78,557.
Charlotte features major-city urban amenities in an affordable environment, making it a popular destination for young relocating renters. Charlotte’s population growth rate reached 1.8% in 2022 — the eighth-highest pace of the top 50 metros in the Opportunity Matrix. This southern commercial hub, which has the fifth-highest average rental household income ($95,007), also contains a strong base of higher-income renters.

Large Multifamily Investment

Large multifamily investment across U.S. markets has been anything but uniform. Here, we analyze a pool of loans across the top 50 metros with originations between July 2021 and June 2022 and original balances above $15 million. Lending volumes include loans originated for both investment sales and refinancings. These data are leveraged as a proxy to determine which markets have the most liquidity to support large multifamily investments. Leading the way were Dallas, New York, and Los Angeles, which accounted for 7.1%, 6.9%, and 6.8% of the observed sample, respectively (Chart 2).

Supply and Demand Equilibrium

To analyze the supply and demand equilibrium, we compared metropolitan markets’ 2022 population inflows to the volume of residential permitting activity from July 1, 2022, to June 30, 2023, to determine market tightness and the demand for new housing. For example, a market that is gaining new residents faster than adding new housing supply would theoretically exert upward pressure on pricing.

Applying this logic on the reverse side of the spectrum, markets with population outflows or high levels of new residential construction relative to incoming housing demand could expect softening prices. Tampa, No. 14 on the Opportunity Matrix, ranked first in the supply and demand equilibrium category (Chart 3). Tampa’s population increased by 61,653 people in 2022, while 25,854 housing permits were tracked from the third quarter of 2022 to the second quarter of 2023.

Other top performers in this category were Dallas, San Antonio, Oklahoma City, and Orlando. New York (41st), Los Angeles (46th), and Chicago (50th) — the country’s three largest cities — all rank in the bottom 10 in this category as a result of sizable population outflows in 2022.

Rental Affordability

One of 2023’s most compelling topics, housing affordability, factored heavily in the 2023 Opportunity Matrix. According to an analysis of the U.S. Census Bureau’s 2022 Current Population Survey, a desire for cheaper housing, better/new housing, a more desirable neighborhood, or another housing-centric reason motivated 35.6% of renter-moving decisions last year. Due in part to the adoption of remote work, Americans are less constrained by location than they were pre-pandemic, giving them greater flexibility in their housing choices. As a result, migration has begun accelerating to affordable metros. According to a recent analysis by Freddie Mac, “the pandemic amplified existing urban de-concentration by threefold, from large, expensive metro areas to smaller, more affordable destinations.”

To measure housing affordability in the Opportunity Matrix, we reviewed data from Waller, Weeks, and Johnson Rental Index — a collaborative research series produced by teams at Florida Atlantic University, Florida Gulf Coast University, and the University of Alabama, who calculate the minimum income required in each metro for households not to be considered rent-constrained. Those metros with lower income thresholds for affordability were then rewarded in our matrix since they are more attractive to renters in search of low-cost, high-quality housing options.

Milwaukee leads the country in terms of rental affordability in 2023. With an average monthly rental price of $1,344 through July 2023, households earning $53,760 or more are not considered rent-burdened in Wisconsin’s largest city. Just behind Milwaukee is St. Louis, another powerhouse city in the Midwest, where the rent-burdened threshold is $53,880. Rounding out the top 5 in this category are Buffalo ($54,440), Louisville ($54,640), and Oklahoma City ($54,960). Meanwhile, the threshold is more than twice as high in the coastal cities of New York ($137,800), San Jose ($137,000), and San Diego ($128,200).

Climate Risk and Readiness

A topical inclusion to this year’s opportunity matrix is climate risk and climate risk preparedness. According to a recent analysis by Redfin, migration into disaster-prone areas has accelerated in recent years. With incidences of major storms, extreme heat, and wildfires all on the rise, property owners now need to incorporate the risks into their investment decisions. Moreover, the risk to rental operators extends beyond direct damage from a climate event. Property insurance prices have skyrocketed in coastal markets in Florida, while some major coverage providers have pulled out of California due to wildfire risks. As insurance markets recalibrate to shifting climate risks, rental property owners may face a combination of rising costs and growing risk exposure.

To assess climate risk, we utilized the Federal Emergency Management Agency’s (FEMA) National Risk Index for Natural Hazards (NRI). FEMA describes the NRI as a “tool that shows which communities are most at risk to natural hazards. It includes data about the expected annual losses to individual natural hazards, social vulnerability, and community resilience.” Within our opportunity matrix, we included two composite indices tracked by the FEMA NRI: overall risk and overall readiness.

On the risk front, Miami is the most hazard-prone metro among the top 50, driven primarily by exposure to hurricanes and flooding. Following behind Miami are Chicago, Los Angeles, and Hartford. On the positive end of the spectrum are Oklahoma City, Orlando, and Charlotte — all of which are set away from the coast by at least 40 miles. When it comes to natural hazard readiness, Seattle, Minneapolis, and Raleigh receive the highest ratings among the top 50, while Riverside, Sacramento, and Providence are the least prepared metros for natural hazards.

Market Spotlight: Orlando

Does Orlando have a touch of magic — or just a strong set of economic fundamentals? Perhaps it’s a bit of both.

Driving Orlando up to the top spot in the 2023 Opportunity Matrix is a labor market continuing to grow at an impressive clip, which is, in turn, attracting new residents to Central Florida’s economic epicenter. Through July 2023, Orlando had an unemployment rate of just 2.8% while the number of jobs in the metro is up by 2.9% from the same time last year — the 6th highest mark of all 50 metros. With Orlando businesses hiring and local labor in short supply, firms have been bidding against each other for talent, leading to significant wage growth.

The largest industry in town is, of course, tourism. Orlando is America’s number one travel destination, welcoming 74 million visitors in 2022. Leisure and hospitality jobs have grown by 7.5% year-over-year and account for 20.2% of Orlando’s employment, making it the metro’s dominant sector. While tourism provides a comfortable bedrock of support, Orlando’s accelerating diversification is spurring optimism. Notably, Orlando’s financial sector has gained significant momentum since the start of the pandemic as more firms and households relocate to the area. Through July 2023, the financial services sector has swelled by 14.2% above its pre-pandemic peak.

Placing Orlando on an encouraging growth track is the Brightline — the country’s first high-speed private railway, which began service in September 2023. The Brightline runs from Orlando to Miami and completes its journey in about 3.5 hours — 30 minutes less than the average drive time. Fortress Investment Group, Brightline’s owner, estimates that ridership will stabilize at eight million people annually. This new interconnectivity of Central Florida with the state’s southeast corridor is expected to pump an additional $6.4 billion into Florida’s gross domestic product over the next eight years, Brightline has projected.

It appears that word of Orlando’s economic prowess has become universal, with the population growth rate for the metro reaching 2.4% in 2022 — more than six times higher than the national average. Looking ahead, there are credible reasons to believe that Orlando will maintain the wind in its sails. The Orlando City Government anticipates that the urban population will grow another 46% by 2050. However, the changing dynamics of climate risk may contribute to an even larger population increase. Due to its low natural hazard/climate risk and close proximity to high-risk cities, Orlando is strategically positioned to attract migrating households and businesses.

The present success of the Orlando economy and favorable outlook for its future are strengthening rental housing’s fundamentals. According to data from the U.S. Census Bureau, Orlando’s rental vacancy rate averaged 4.5% in the first quarter of 2023 — placing it 11th among our top 50. Further, it has surpassed all other Florida markets in terms of multifamily sales activity in the past year, according to CoStar, making it ripe for investment into 2024.

Outlook

In 2023, multifamily investors are in uncharted waters. Cap rates have risen and transaction volumes have slumped, a reflection of a challenging interest rate environment. But at the same time, property-level operations have held up remarkably well, and high mortgage costs have strengthened demand for multifamily properties. All else being equal, the U.S. multifamily market is balanced by a favorable combination of headwinds and tailwinds that are likely to remain into 2024.

Looking ahead, natural hazards (and their impact on insurance markets) are beginning to have more influence on the risk/opportunity calculus of multifamily investors. Concurrently, conventional considerations of local economic success and their ability to attract new residents are as relevant as ever, especially with the U.S. population growth rate continuing to sink lower.

On a metro-by-metro basis, competition for residents is poised to escalate in the years ahead, creating new opportunities for large multifamily investment in metropolitan areas.

Appendix

About Us
Arbor Realty Trust, Inc. (NYSE: ABR) is a nationwide real estate investment trust and direct lender, providing loan origination and servicing for multifamily, single-family rental (SFR) portfolios, and other diverse commercial real estate assets. Headquartered in Uniondale, New York, Arbor manages a multibillion-dollar servicing portfolio, specializing in government-sponsored enterprise products. Arbor is a leading Fannie Mae DUS® lender, Freddie Mac Optigo® Seller/Servicer, and an approved FHA Multifamily Accelerated Processing (MAP) lender. Arbor’s product platform also includes bridge, CMBS, mezzanine, and preferred equity loans. Arbor is rated by Standard and Poor’s and Fitch. In June 2023, Arbor was added to the S&P SmallCap 600® index. Arbor is committed to building on its reputation for service, quality, and customized solutions with an unparalleled dedication to providing our clients excellence over the entire life of a loan.

Disclaimer
All content is provided herein “as is” and neither Arbor Realty Trust, Inc. or Chandan Economics, LLC (“the Companies”) nor their affiliated or related entities, nor any person involved in the creation, production and distribution of the content make any warranties, express or implied. The Companies do not make any representations regarding the reliability, usefulness, completeness, accuracy, currency nor represent that use of any information provided herein would not infringe on other third party rights. The Companies shall not be liable for any direct, indirect or consequential damages to the reader or a third party arising from the use of the information contained herein.