The U.S. multifamily market finished 2025 with growing optimism and resilience. Investment volume accelerated to a three-year high, bolstered by greater interest rate clarity and the tightest cap rates across major real estate sectors.
Top Markets for Multifamily Investment Report Spring 2025
Table of Contents
Overview
Even as macroeconomic uncertainties persist nationally, many large metropolitan markets have made positive gains this year. Prices stabilized, and market activity increased nationwide as buyers and sellers secured attractive opportunities in a volatile climate. But with anticipation building for the next shift in the cycle, actionable insights into the best locations to deploy capital are invaluable.
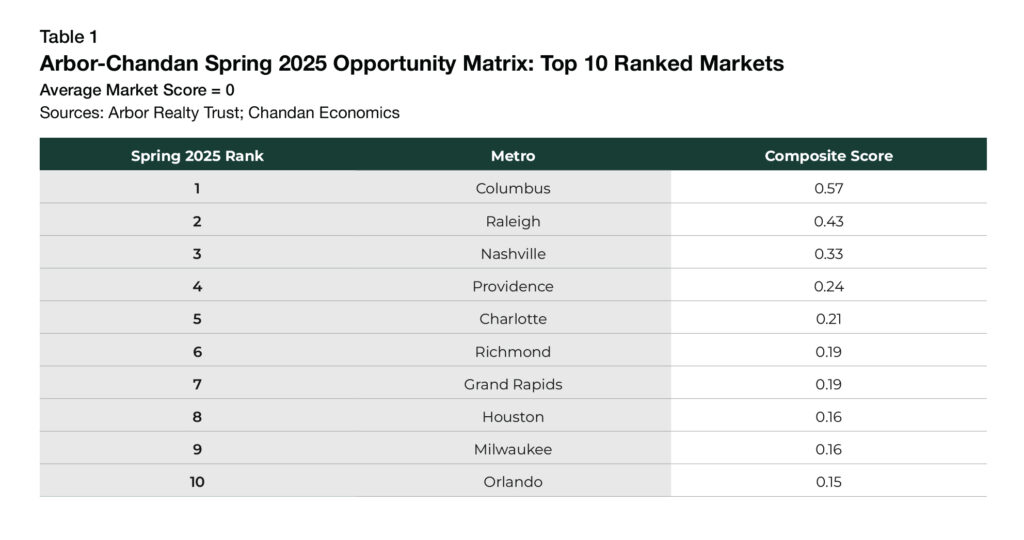
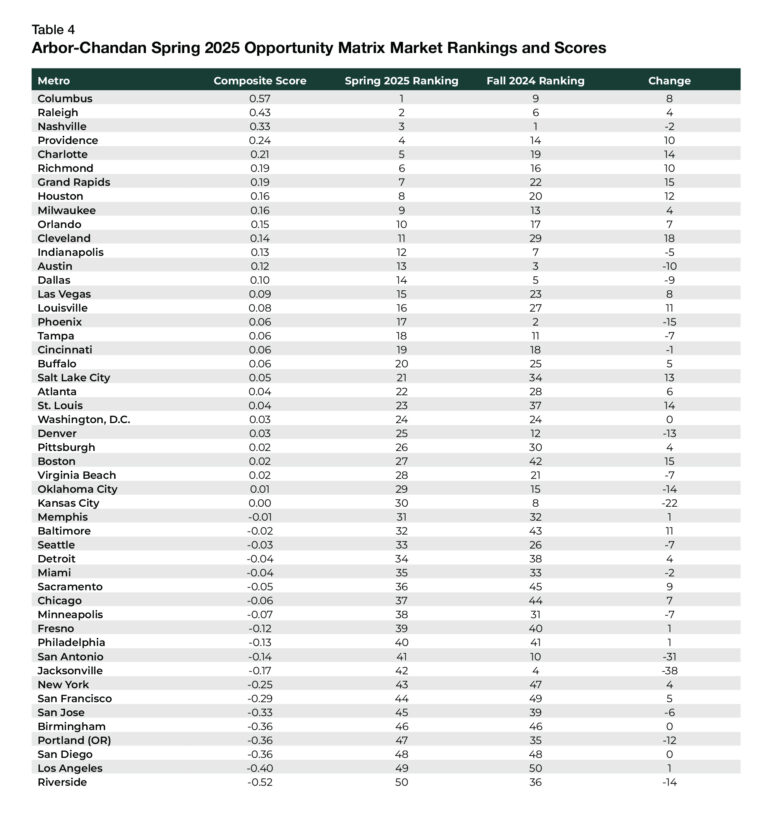
The Arbor-Chandan Multifamily Opportunity Matrix, exclusive to the Top Markets for Multifamily Investment Report series, provides an analysis of a wide range of factors to determine the economic strength of the largest 50 U.S. metros and assess their ability to navigate evolving conditions. This spring, affordable and high-growth markets, such as first-place Columbus, OH, outperformed. Raleigh, NC, and Nashville, TN, which ranked second and third, had attractive attributes, including affordability, population growth, and high liquidity.
Developed for multifamily investors, Arbor’s roadmap to the nation’s top markets is rich with opportunity.
Key Findings
-
Columbus, OH, is the most appealing major metropolitan market for multifamily investing due to robust population growth, high market liquidity, and strong rental affordability.
-
Affordable and high-growth markets in the Midwest and Sun Belt outperformed.
-
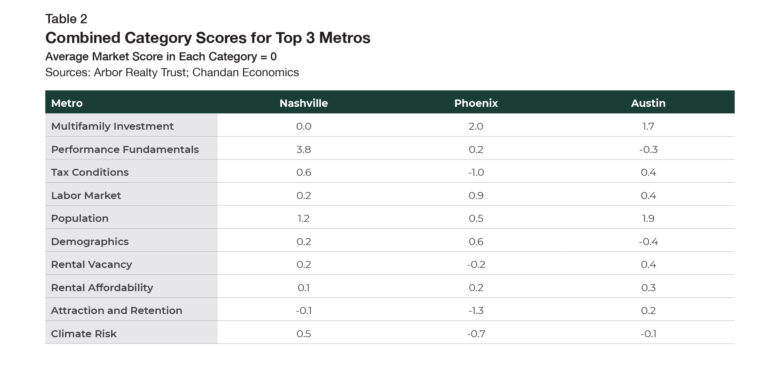
Raleigh, NC, and Nashville, TN, second and third, respectively, had dynamic labor markets and attracted out-of-market residents.
PDF link below
Top Ranked Markets
Columbus
Columbus ranked first in the Multifamily Opportunity Matrix due to well-rounded fundamentals. A dynamic and diversified local labor market and business-friendly state taxes have helped attract robust inflows of new residents and investment capital (Table 1). Ohio’s interconnected metroplex (Columbus, Cincinnati, and Cleveland) has flown under the radar over the past decade but has recently received its due. Ohio ranks third in the country for new economic development projects per capita, making the Midwestern state an attractive landing spot for long-term capital deployment.
For a full breakout of the Spring 2025 scores and rankings,
see Table 4 in the Appendix at the end of the report.
Raleigh
Just behind Columbus in the Opportunity Matrix is second-place Raleigh, which has one of the country’s most robust rental and labor markets. Raleigh is home to Research Triangle Park, where IBM, Cisco, Apple, and several biotech firms have sizeable footprints. North Carolina’s capital city has one of the lowest unemployment rates (3.2%) and the highest annual wage growth rates (+5.5%) among markets analyzed.
Located near several top-tier universities, the Research Triangle is a thriving area. Duke University, the University of North Carolina at Chapel Hill, and NC State University are all located nearby, providing market-leading firms with a deep and youthful talent base. Raleigh’s tendency to turn its students of today into its workforce of tomorrow has contributed to a renter base among the country’s most youthful. More than half (53.4%) of apartments in Raleigh are rented by someone under 35, the third highest percentage of markets analyzed.
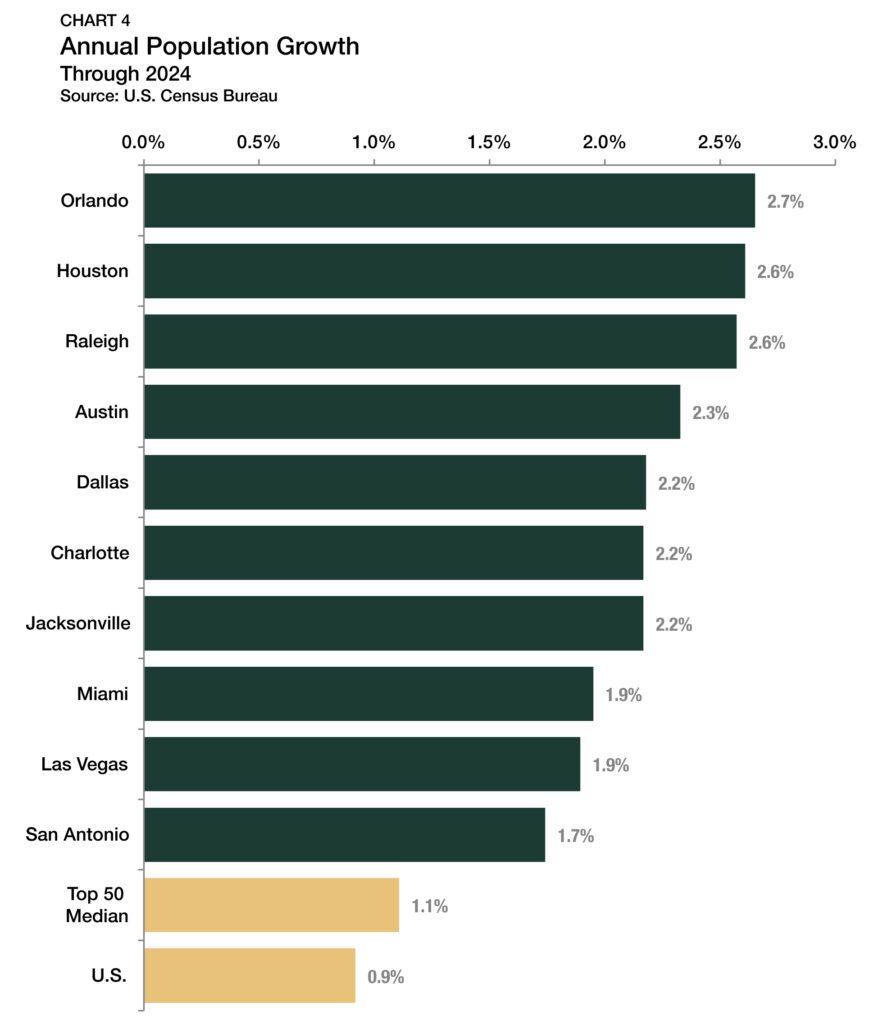
Beyond Raleigh’s internal pipeline of residents, it is now one of the most sought-after destinations for relocators. In 2024, Raleigh’s population grew 2.6%, trailing only Orlando, FL, and Houston, TX.
Nashville
Nashville, last fall’s top-ranked market, remained in the top three. While Nashville’s thriving cultural scene attracts droves of tourists, an increasing number of visitors to Music City are arriving with a one-way ticket. Nashville’s resident population increased by 1.7% last year, continuing its streak of outpacing the national growth rate every year since the turn of the century.
Beyond the sights and sounds of Broadway, Nashville’s local labor market is a driving force behind its success. While many business sectors in Nashville are booming, technology, healthcare, and tourism are the most significant engines of growth. Tech giants like Oracle, Amazon, and Meta have all carved out substantial footprints, pumping billions into the Nashville economy and growing a long-term base of high-paying jobs. At 3.0% through January 2025, Nashville tied for the lowest unemployment rate among the top 50 metros.
Multifamily Investment
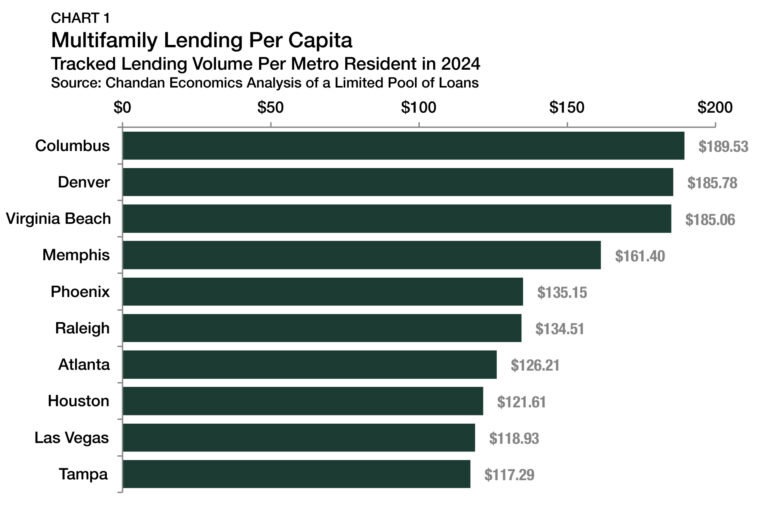
Multifamily investing across U.S. markets is rarely uniform. To locate the best areas of opportunity, Chandan Economics analyzed a pool of multifamily loans tracked across the largest 50 metros that were originated in 2024 for both investment sales and refinancings to determine the markets that have the most liquidity to support new multifamily investments. Measured per capita, Columbus had the highest total multifamily lending volume ($189.53 per person) within the past year relative to its existing population (Chart 1). Denver, CO ($185.78), and Virginia Beach, VA ($185.06), performed similarly, albeit lower. Memphis, TN, a distant fourth place, had a lending volume per capita that was more than $20,000 behind the top three.
Performance Fundamentals
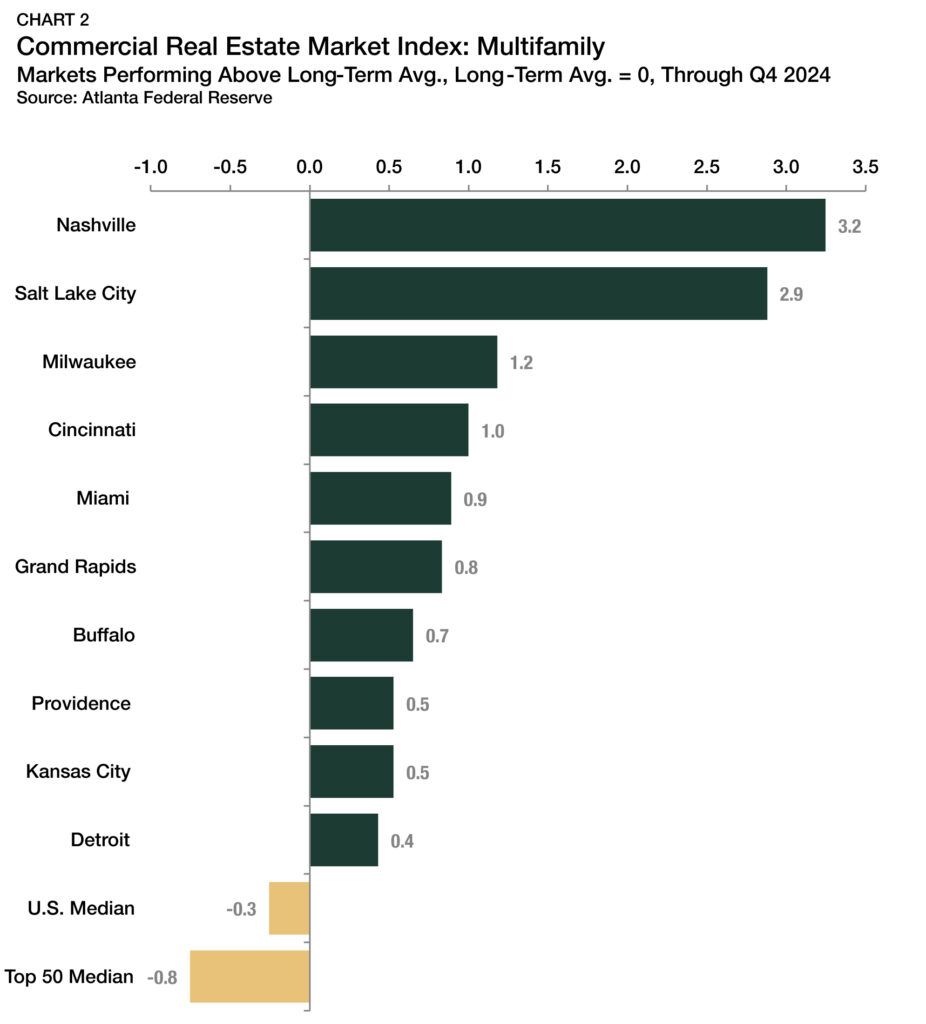
The Federal Reserve Bank of Atlanta’s Commercial Real Estate Market Index (CREMI) for multifamily properties was a significant factor in the Multifamily Opportunity Matrix rankings. CREMI comprehensively scores how well metro-level multifamily sectors hold up relative to their historical patterns. Net operating income, cap rates, valuations, and absorption are just a few inputs the Atlanta Fed uses to calculate its quarterly indices. With every market having a long-term average score of zero, 64% of metros continued to see below-average multifamily sector performance through the fourth quarter of 2024. Similarly, 80% of the markets in our sample saw below-average performance relative to their historical standards.
However, there were several significant standouts this year, with Nashville, Spring 2025’s third-ranked market, leading the way (Chart 2). Regionally, CREMI underscores the recent outperformance of the Midwest region. Of the 10 markets with a positive score, half are in the Midwest: Milwaukee, WI, Cincinnati, OH, Grand Rapids, MI, Kansas City, MO, and Detroit, MI.
Rental Affordability
Housing affordability remains a primary concern for U.S. residents in 2025. According to an analysis of the U.S. Census Bureau’s 2024 Current Population Survey, a desire for lower-priced housing, better/new housing, a more desirable neighborhood, or another housing-centric reason motivated the moving decisions of more than one-third (34.3%) of renters last year.
Housing affordability in the Multifamily Opportunity Matrix was determined by reviewing Waller, Weeks, and Johnson Rental Index data, which calculates the minimum income required in each metropolitan area for a household not to be considered rent-constrained. Metros with a lower income threshold for affordability scored higher because they are more attractive to budget-conscious renters.
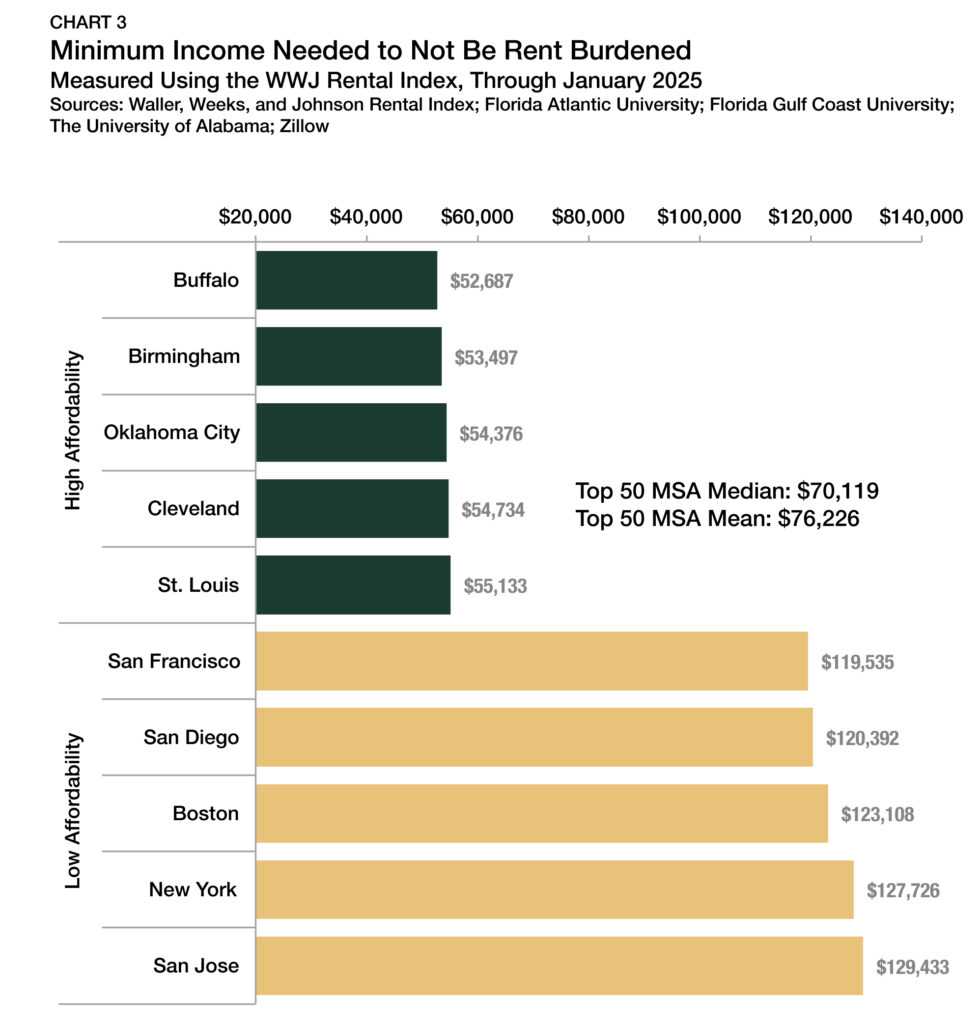
Buffalo, NY, led the country in rental affordability this spring, with an average monthly rental price of $1,317 through January 2025. Households earning $52,687 or more are not considered rent-burdened there (Chart 3). Just behind Buffalo was Birmingham, AL, where the rent-burdened threshold was slightly higher at $53,497. Rounding out the top five in rental affordability are Oklahoma City, OK ($54,376), Cleveland, OH ($54,734), and St. Louis, MO ($55,133).
Meanwhile, coastal cities have seen very different trends. The threshold to be considered not rent-constrained is more than twice as high in several major coastal markets at the opposite end of the affordability spectrum, including San Jose, CA ($129,433), New York, NY ($127,726), and Boston, MA ($123,108).
Population Growth
The Multifamily Opportunity Matrix Spring 2025 incorporates one-year population growth rates as a standalone category, highlighting the weight it can carry in current and future real estate success. A metro’s ability to maintain and expand its population is essential for solidifying rental demand. However, the ability to count on population growth as a reliable, long-term tailwind across all markets may be a thing of the past. Nationally, population growth has been forecasted to languish in the decades ahead as birth rates decline and immigration declines. As a result, intra-market competition for residents is expected to accelerate.
Orlando had the fastest population growth rate, with its base of residents swelling by 2.7% in 2024, three times the national growth rate of 0.9% (Chart 4). In addition to Orlando, six other markets had population growth rates above 2%, including Houston, Raleigh, and Austin. A closer look at the list reveals that every market in the top 12 is in the Sun Belt, underscoring this region’s consistent ability to attract households. With many high-growth markets, like Austin, challenged by weakening rent growth amid cresting apartment deliveries, robust population growth provides optimism to the long-term view of the fundamental health of the region’s rental sector.
Market Spotlight: Columbus
The Midwest is proving that the adage “slow and steady wins the race” has as many applications in real estate as it does in track and field. Columbus, Spring 2025’s overall leader, has been consistently strong across many performance fundamentals.
Ohio’s capital city has quietly built one of the most attractive investment cases anywhere in the country, and capital-deep buyers have been paying attention. Within our sample pool of approximately $15 billion in loans originated in 2024, Columbus had the highest multifamily lending activity per capita ($189.53 per resident).
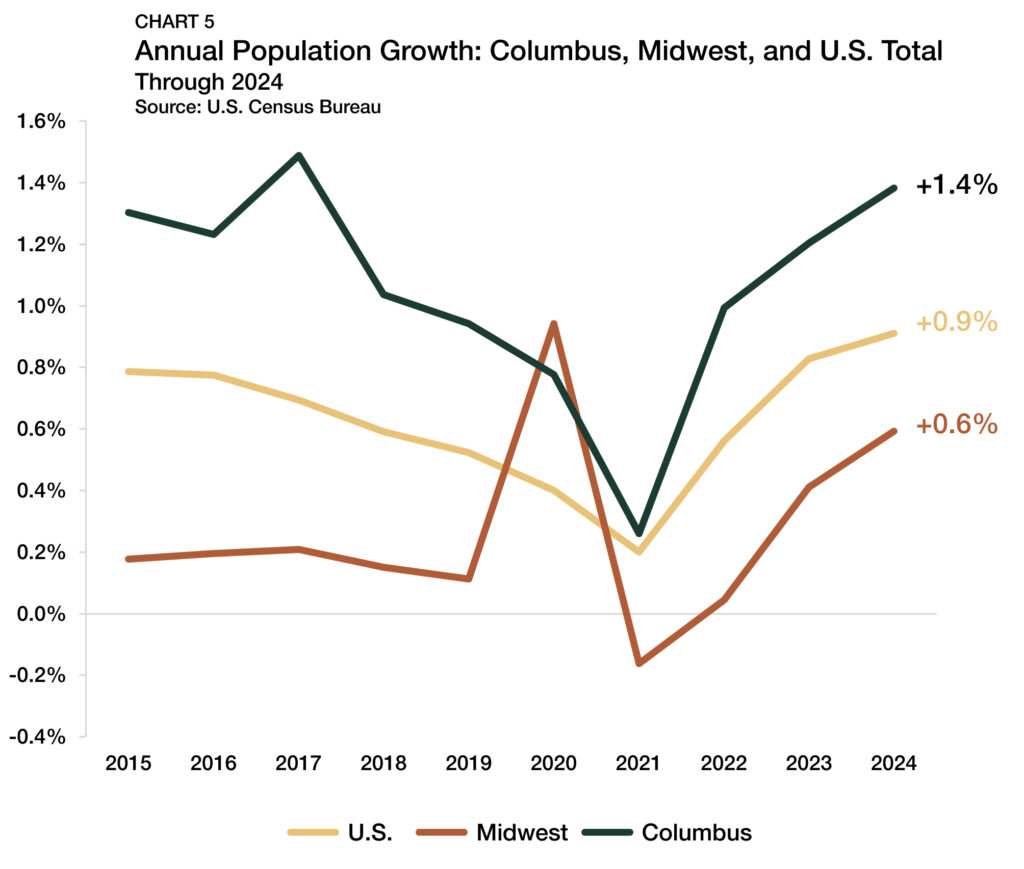
Compared to population growth rates in other parts of the country, the 1.4% increase in Columbus last year may not seem all too impressive. But there is more to that than meets the eye. Columbus had the fastest population growth rate of any Midwest metro in the top 50. The region as a whole saw its population increase by only 0.6% in 2024, a pace that Columbus more than doubled as the city’s population growth rate accelerated in each of the past three years (Chart 5).
Supporting the population inflow into Columbus and the Midwest are several structural tailwinds, including comparative affordability. Out of the top 50 metros, Columbus has the 12th lowest average monthly rent at $1,459 through January 2025. Out of the top 15 most affordable metros, eight are in the Midwest, and another four (Buffalo, Oklahoma City, Louisville, and Pittsburgh) are Midwest-adjacent. Whether a relocating household is looking to rent or buy, the region’s relative affordability is a clear advantage.
The favorable climates in Columbus and the Midwest region also make it an attractive landing spot for long-term housing and investment decisions. Whether it is wildfires in the West, flooding and wind in the Southeast, or hail in the Central Plains, the rising risks of natural hazards have spared few pockets of the country. Resultingly, investors must consider the physical safety of life and property, as well as the viability of local insurance markets, before making a long-term acquisition. Of the Multifamily Opportunity Matrix’s top 50 markets, Columbus has the seventh-most resilient climate risk score, according to FEMA data.
Complementing Columbus’ structural strengths, private and public capital have poured in. Ohio, which ranked third in the nation in 2024 for the most economic development projects per capita, has projects in progress like a proposed high-speed rail connecting Cincinnati, Cleveland, Columbus, and Dayton. The Columbus area has also seen a recent surge in announced investments, including an advanced manufacturing facility by Anduril and a data center expansion by Amazon Web Services.
While the Midwest hasn’t received as much attention as other regions in recent years, investors are now paying full attention to Columbus and its neighboring metros.
Outlook
The light at the end of the tunnel is in sight, and well-positioned multifamily investors are set to take advantage of new opportunities. Even as long-term interest rates remain anchored well above pre-pandemic levels, pricing, yields, and expectations have adjusted to a new reality. There is a rising tide of optimism for the multifamily sector nationally, and fundamental strengths make some markets better candidates for growth than others in 2025. With U.S. population growth forecasted to slow in the decades ahead, cross-market competition for residents will escalate, making market knowledge a crucial advantage to investors.
The Opportunity Matrix
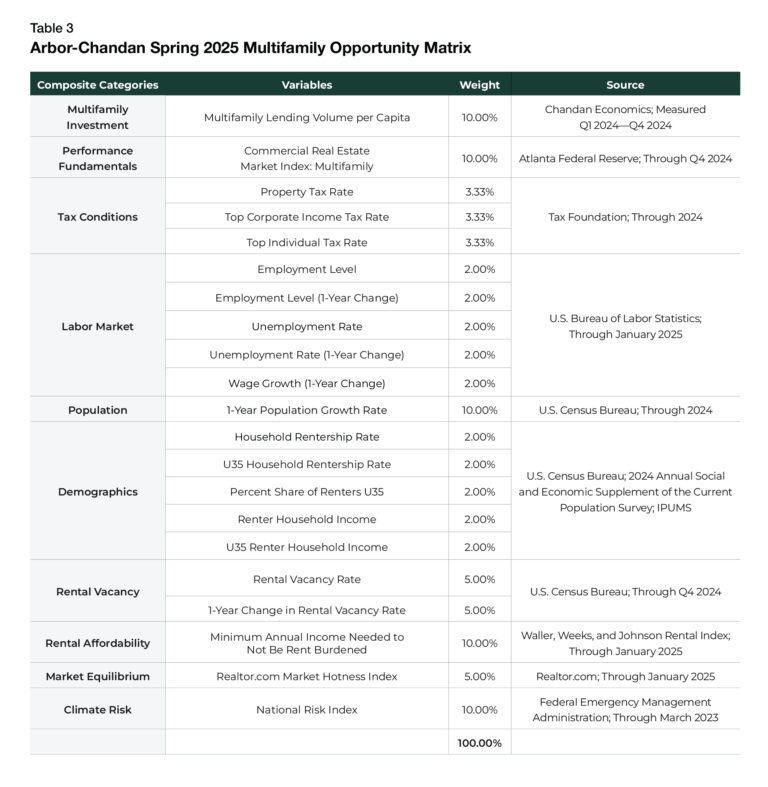
- Multifamily Investment: measured as a proxy for the availability of debt financing, overall liquidity, and a market’s ability to support additional multifamily investment. Both acquisitions and refinancing are tracked in this analysis.
- Performance Fundamentals: comprehensive mix of recent multifamily sector performance and momentum.
- Tax Conditions: tax burdens for firms, properties, and individuals — measuring monetary and human capital attractiveness.
- Labor Market: topline profile of key labor market performance indicators, including market size and growth, unemployment rate, change in the unemployment rate over the past year, and wage growth.
- Population Growth: overall growth of a metro over the short and medium term.
- Renter Demographics: spending power and age profile of existing renters (higher household incomes and younger householders assumed as conducive for higher levels of multifamily demand).
- Renter Vacancy: measures the current market tightness for all existing metro-level rental inventory.
- Market Equilibrium: utilizing Realtor.com’s Market Hotness Index as a proxy, considers the pace of incoming housing demand against existing housing supply.
- Affordability: minimum income needed to rent an apartment without being rent-burdened, included to capture a market’s attractiveness for incoming rental demand.
- Climate Risk: a composite measure of risk, preparedness, and social vulnerability, which is included to account for the increasing frequency of natural hazards and the evolving property insurance landscape.
Methodology
This report presents an analytical framework to develop a cross-market comparison for opportunistic multifamily investments. The largest 50 U.S. metros1 are ranked using the Arbor-Chandan Multifamily Opportunity Matrix based on a weighted average of performance metrics. It considers how well metro-level economies have maintained strength over the past year and their ability to handle shifting market conditions through 2025 and beyond. The Multifamily Opportunity Matrix includes factors a multifamily investor might consider in their market selection process. All 10 categories have received equal weighting. In categories with more than one variable, each variable received equal weighting.
Appendix
About Us
Arbor Realty Trust, Inc. (NYSE: ABR) is a nationwide real estate investment trust and direct lender, providing loan origination and servicing for multifamily, single-family rental (SFR) portfolios, and other diverse commercial real estate assets. Headquartered in Uniondale, New York, Arbor manages a multibillion-dollar servicing portfolio, specializing in government-sponsored enterprise products. Arbor is a leading Fannie Mae DUS® lender, Freddie Mac Optigo® Seller/Servicer, and an approved FHA Multifamily Accelerated Processing (MAP) lender. Arbor’s product platform also includes bridge, CMBS, mezzanine, and preferred equity loans. Arbor is rated by Standard and Poor’s and Fitch. In June 2023, Arbor was added to the S&P SmallCap 600® index. Arbor is committed to building on its reputation for service, quality, and customized solutions with an unparalleled dedication to providing our clients excellence over the entire life of a loan.
Disclaimer
This report is intended for general guidance and information purposes only. This report is under no circumstances intended to be used or considered as financial or investment advice, a recommendation, or an offer to sell, or a solicitation of any offer to buy any securities or other form of financial asset. Please note that this is not an offer document. The report is not to be considered as investment research or an objective or independent explanation of the matters contained herein and is not prepared in accordance with the regulation regarding investment analysis. The material in the report is obtained from various sources per dating of the report. We have taken reasonable care to ensure that, and to the best of our knowledge, material information contained herein is in accordance with the facts and contains no omission likely to affect its understanding. That said, all content is provided herein “as is” and neither Arbor Realty Trust, Inc. or Chandan Economics, LLC (“the Companies”) nor their affiliated or related entities, nor any person involved in the creation, production and distribution of the content make any warranties, express or implied. The Companies do not make any representations or warranties, express or implied, as to the reliability, usefulness, completeness, accuracy, currency nor represent that use of any information provided herein would not infringe on other third-party rights. The Companies shall not be liable for any direct, indirect, or consequential damages to the reader or a third party arising from the use of the information contained herein. There may have been changes in matters which affect the content contained herein and/or the Companies subsequent to the date of this report. Neither the issue nor delivery of this report shall under any circumstance create any implication that the information contained herein is correct as of any time subsequent to the date hereof or that the affairs of the Companies have not since changed. The Companies do not intend and do not assume any obligation to update or correct the information included in this report. The contents of this report are not to be construed as legal, business, investment, or tax advice. Each recipient should consult with its legal, business, investment, and tax advisors as to legal, business, investment and tax advice. The information contained herein may be subject to changes without prior notice. This report is only intended for the recipients, and should not be copied or otherwise distributed, in whole or in part, to any other person.


