As renters face a national shortage of 7 million low-income rental homes, the U.S. Department of Housing and Urban Development’s (HUD) Low-Income Housing Tax Credit (LIHTC) program is pivotal in helping to close the affordability gap for renters. It is the nation’s most significant resource for affordable apartment housing construction, which gives state and local agencies approximately $10 billion in annual budget authority to issue tax credits for affordable housing development.
Small Multifamily Prices Rise as Refinancing Activity Remains Robust
Key Findings
- Small multifamily prices rose 1.6% quarter-over-quarter and 2.0% year-over-year
- Origination volume finished the year down 6.1% from 2019 levels
- Refinancings remained elevated, accounting for 78.5% of small multifamily originations in the fourth quarter
State of the Market
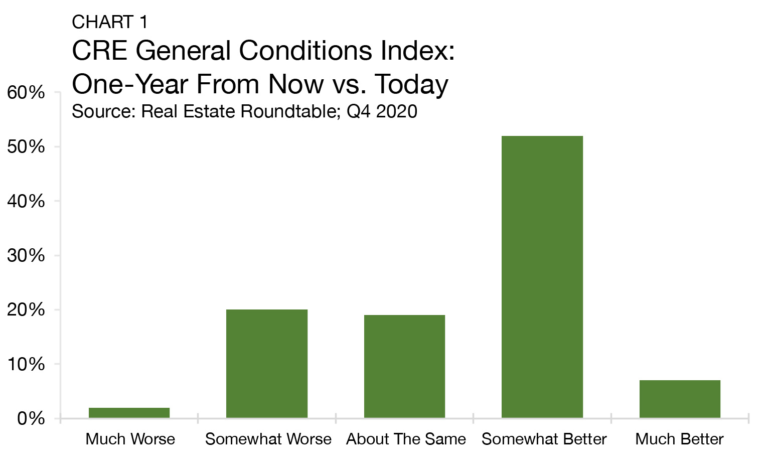
If there is one thing that most Americans can agree on, it’s that 2020 will not be missed. As the calendar flips to 2021, the US finds itself at a moment of both peril and promise. Daily new infections topping 200,000 has become commonplace through the first few weeks of the year. Still, there is hope that 2021 will be a year of gradual recovery. According to the WSJ Economic Forecasting Survey, a number of economists believe the COVID-19 vaccines will have a substantial impact on a labor market rebound. Within commercial real estate, the latest Real Estate Roundtable Sentiment Index results suggest the industry expects a more supportive set of economic conditions in the year ahead (Chart 1).
When the full weight of the pandemic hit in March, the swift passage of the CARES Act helped to lessen the immediate damage of an unparalleled economic shock. In the first 10 weeks of the crisis alone, nearly 41 million people filed for first-time unemployment benefits. The inclusion of disaster relief unemployment benefits as part of the CARES Act helped safeguard the ability of renters to pay their monthly rent. In turn, the circular flow of rental payments, mortgage payments and mortgage availability remained unbroken, allowing the multifamily market to function.
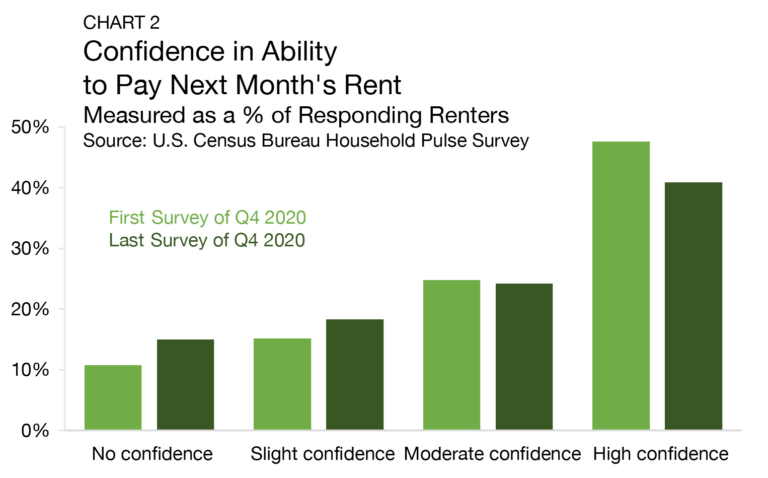
Through the fourth quarter, the financial health of renter households is still a pressing concern. The labor market recovery has transitioned from a period of slowing improvement to a period of outright reversal, and the winter months ahead will likely prove challenging. The expiration of many of the market-fortifying features of the CARES Act further fuel anxieties. According to the U.S. Census Bureau’s Household Pulse Survey, the share of U.S. renter households with either high or moderate confidence to pay their next rent bill slipped from 72.4% at the beginning of the quarter to 65.1% near the end (Chart 2).1
Reinforcements, however, are on their way. After months of legislative inaction, the 2021 Consolidated Appropriations Act passed both congressional chambers on December 21 and became law on December 27. The newly approved spending earmarks $900 billion for additional COVID-19 relief aid, including a partial reinstatement of the disaster unemployment benefits and a $25 billion Emergency Rental Assistance program. While the rental assistance program is undoubtedly a welcome sign to struggling renters and landlords alike, a RealPage analysis of the program indicates that the $25 billion is likely not enough to address all concerns. Moreover, the analysis suggests the allocation process is not well-aligned with state and local needs.
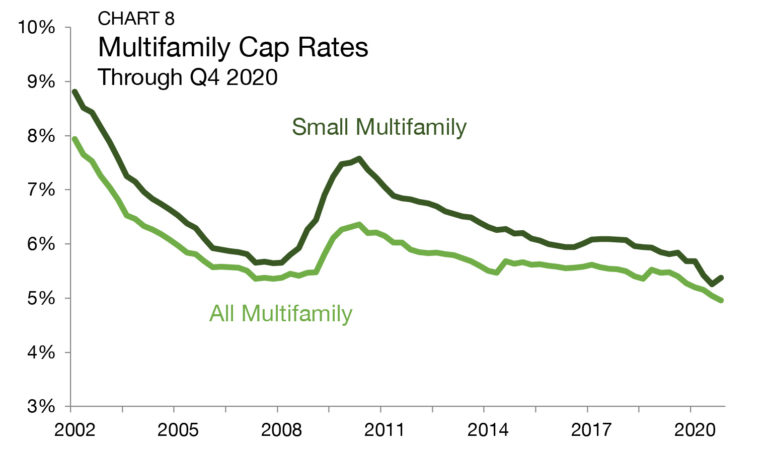
According to Chandan Economics, small multifamily asset pricing has recovered from the early spring — a positive symptom of the market’s deep pool of liquidity. While cap rates remain exceptionally low by historical standards, they did jump by their widest quarterly margin since 2009. All else equal, the ongoing pressures created by the pandemic and continuing recession are not overly affecting the small asset subsector compared to the rest of the multifamily market, and targeted agency support has, to date, been effective in avoiding worst-case scenarios.
1The first survey of Q4 2020 is taken from the Census Bureau’s Week 16 HPS, which covers responses from 9/30 through 10/12. The last survey of Q4 2020 is taken from the Census Bureau’s Week 21 HPS, which covers responses from 12/9 through 12/21.
Lending Volume
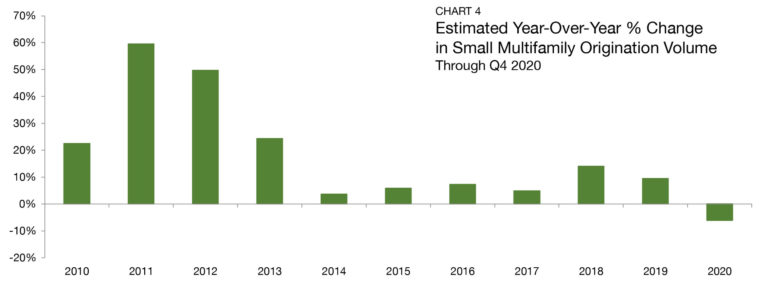
Estimates of new multifamily lending volume on loans with original balances between $1.0 million and $7.5 million — including loans for rental apartment building sales and refinancing — finished 2020 at $55.7 billion.2 In 2019, small multifamily originations reached an all-time high of $59.2 billion, according to Chandan Economics’ post-financial crisis market tracking and model estimates (Chart 3). The current estimate represents a $3.6 billion shortfall and a 6.1% decline in lending activity (Chart 4). Notably, a significant surge in refinancing activity muted the severity of 2020’s drop-off.
2All data, unless otherwise stated, are based on Chandan Economics’ analysis of a limited pool of loans with original balances of $1.0 million to $7.5 million and loan-to-value ratios above 50%.
Buyers pulled back in second-quarter 2020, with multifamily transaction volume for the quarter falling 67% from the year prior, according to Real Capital Analytics. While buyers have started to return in recent months, the pace of recovery remains slow. The prospect of finding distressed deals has kept many would-be buyers on the sideline.
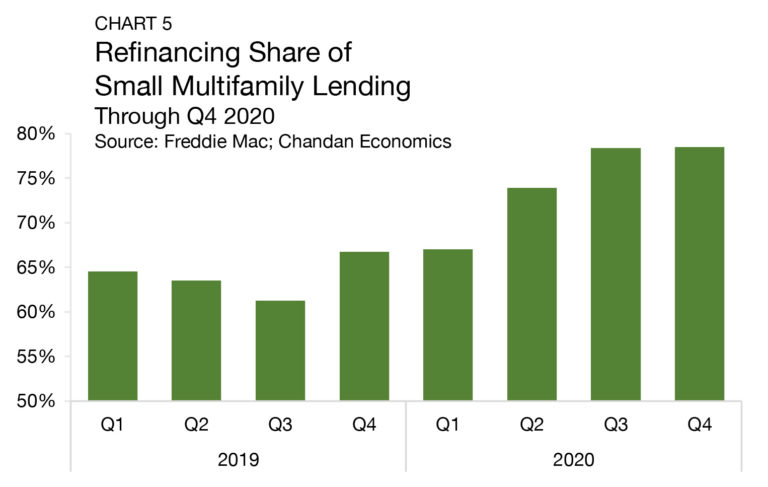
Lenders, meanwhile, have remained active. The availability of refinancing capital has meant that property owners with expiring mortgages, or simply those that want to access their accrued equity, are not disposing of their assets from a disadvantaged position. Refinancing activity as a share of total small multifamily lending ranged from 61.2% to 66.7% between first-quarter 2019 and first-quarter 2020. Since the onset of the pandemic, the refinancing share has soared, reaching a new high of 78.5% in the fourth quarter (Chart 5).
Arbor Small Multifamily Price Index
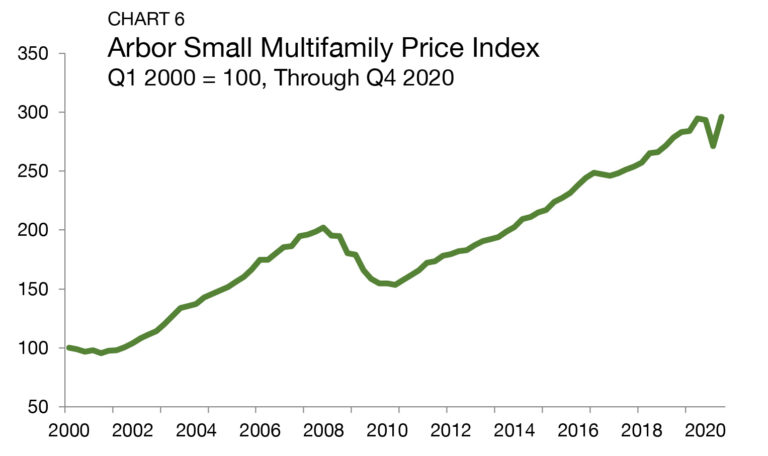
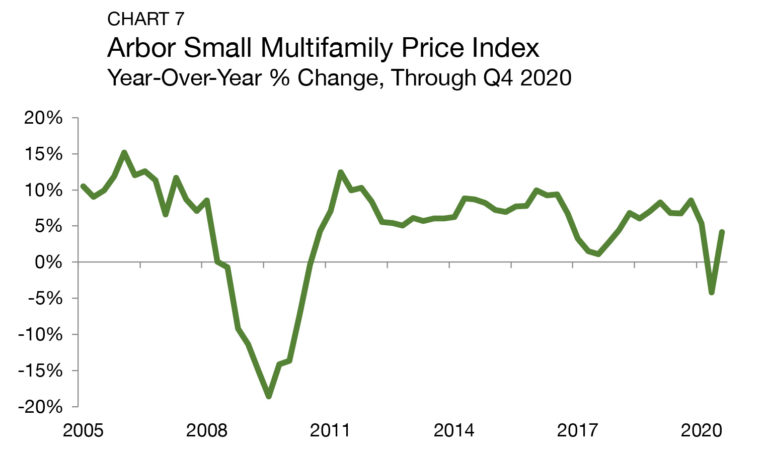
As measured by the Arbor Small Multifamily Price Index, small multifamily prices improved during the fourth quarter of 2020, up 1.6% from the third quarter and up 2.0% from one year ago (Chart 6 and Chart 7).3 Revised third-quarter estimates indicate that national pricing of small multifamily assets recovered more through the summer months than previously reported.
In the revised third-quarter estimate, prices jumped 4.1% year-over-year and fully erased second-quarter declines. The backstopping of agency liquidity has meaningfully supported small asset pricing throughout the pandemic. During an extended period of heightened buyer caution, the availability of refinancing capital has given property owners a viable alternative to selling into an imbalanced market.
3The Arbor Small Multifamily Price Index (ASMPI) uses model estimates of small multifamily rents and compares them against small multifamily cap rates. The index measures the estimated average price appreciation on small multifamily properties with 5 to 50 units and primary mortgages of $1.0 million to $7.5 million. For the full methodology, visit arbor.com/asmpi-faq.
Cap Rates & Spreads
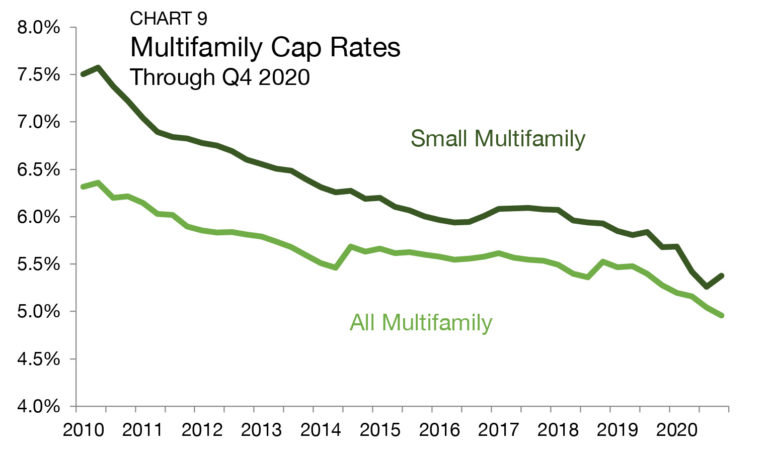
National average cap rates for small multifamily properties jolted up by 12 basis points (bps) in the fourth quarter of 2020, reaching 5.4% (Chart 8 and Chart 9). The quarter-over-quarter increase marks the biggest single-period jump since 2009. However, evidence suggests the rise is due to climbing benchmark interest rates rather than an evolving perception of sector-level risk.
The credit quality of the U.S. government is perceived as unmatched, making the price it pays for its debt an approximation for the risk-free interest rate. The risk-free interest rate is embedded within the yield structure of all other market returns, including cap rates. Investors require additional compensation when accepting additional risk. We can infer this risk premium in small multifamily by looking at the difference between asset cap rates and 10-Year Treasurys.
Despite increased concerns over property-level operations during the pandemic, 10-year Treasurys rates sank to new lows. As both occurred in tandem, small multifamily cap rates moved like a rope in a game of tug of war. On net, falling Treasury rates won out, and cap rates ticked down in the second and third quarters. In the fourth quarter, growing optimism about the economic recovery in the year ahead led Treasury yields to do the unthinkable: rise (albeit marginally). Treasury yields averaged 0.86% in the fourth quarter — a 21 bps rise from the previous quarter.
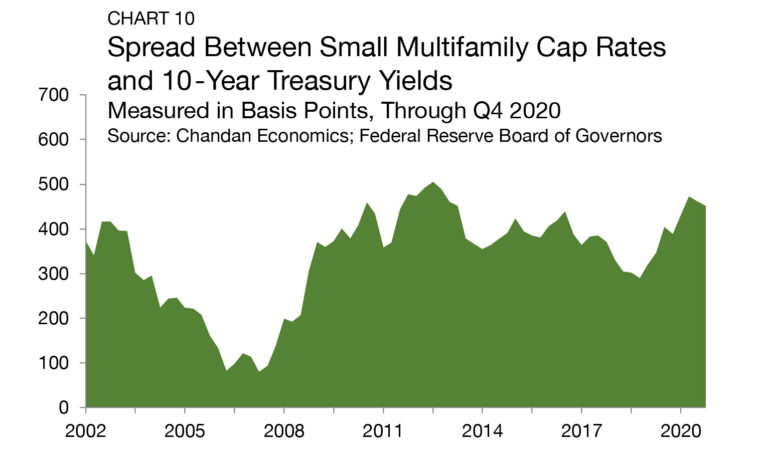
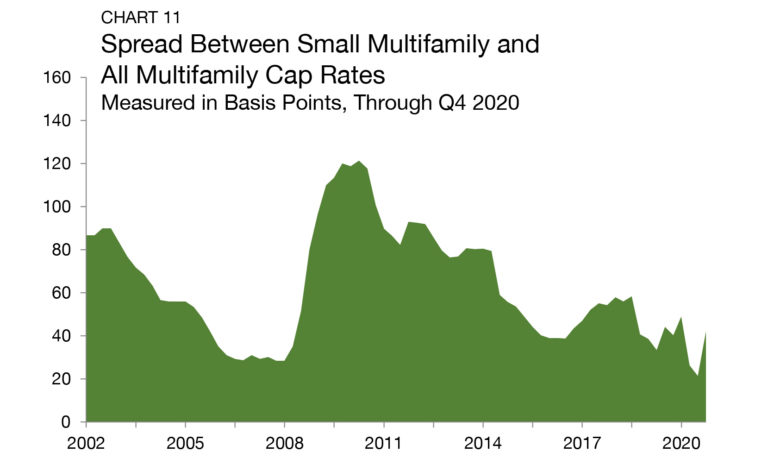
With small multifamily cap rates rising by less than Treasurys in the fourth quarter, the risk premium narrowed to 452 bps (Chart 10). The spread is down by 21 bps from its recent high of 473 bps set in second-quarter 2020. The risk premium measured between small multifamily and the rest of the multifamily sector recovered slightly in the fourth quarter, doubling from 21 bps to 42 bps (Chart 11). Moreover, the fourth-quarter average brings the spread directly in line with the average set over the 12-months ending March 2020.
Leverage & Debt Yields
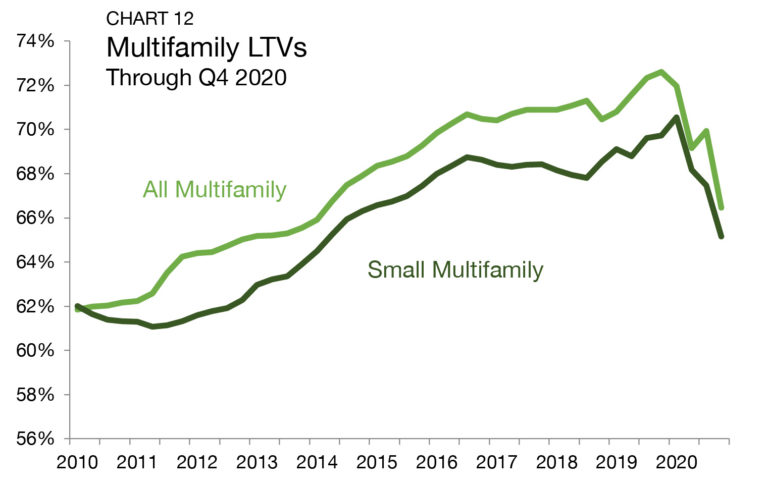
Loan-to-value ratios (LTVs) on small multifamily loans continued their vertical descent in the fourth quarter, averaging 65.2%. After topping out at 70.6% in first-quarter 2020, LTVs proceeded to fall by 237 bps in the second quarter, 71 bps in the third quarter, and 232 bps in the fourth quarter (Chart 12).
Across the rest of the sector, LTVs resumed a sliding trajectory in the fourth quarter as well. Average LTVs for all multifamily properties dropped by a substantial 346 bps from the previous quarter, reaching 66.5%. From the high point reached in the fourth quarter, LTVs for all multifamily properties are down 614 bps. According to Chandan Economics’ initial fourth-quarter estimates, the LTV spread between small multifamily all multifamily stood at 131 bps, nearly half of the 246-bps spread measured in the previous quarter.
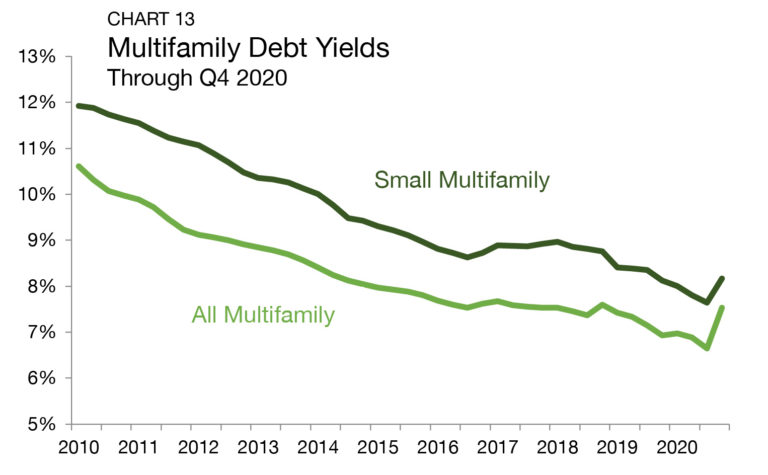
Debt yields — the ratio of net operating income (NOI) and loan balance — for small multifamily loans jumped by 53 bps to 8.2% in the fourth quarter of 2020, the highest level seen since third-quarter 2019 (Chart 13). The trend was similar for all multifamily properties, where debt yields rose by an appreciable 88 bps to 7.5%.
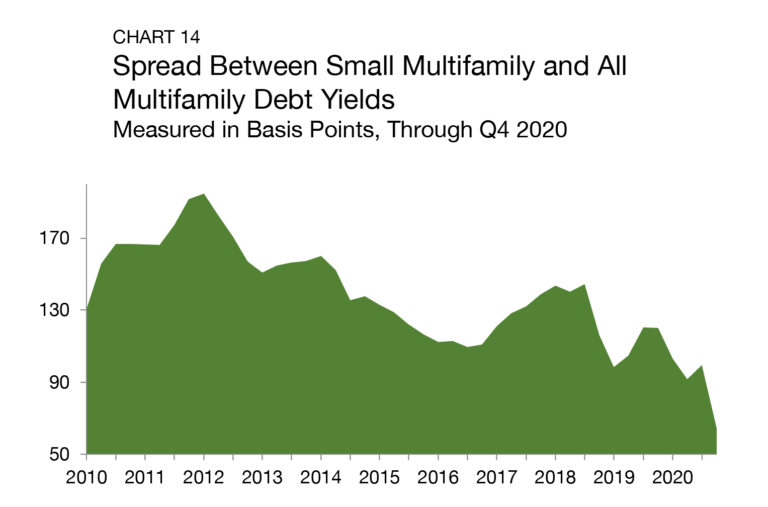
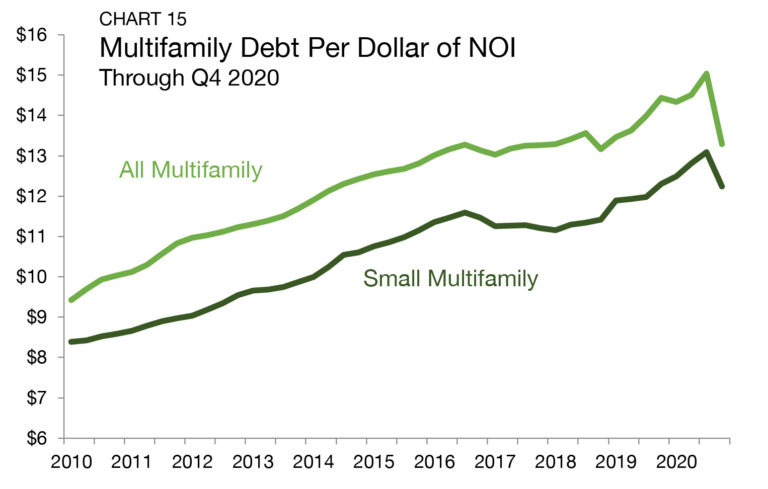
The spread between small multifamily and all multifamily debt yields fell to 64 bps in the fourth quarter, the lowest level on record (Chart 14). Debt per dollar of NOI, the inverse of debt yields, fell for both small multifamily and all multifamily loans in the fourth quarter. Small multifamily borrowers are securing an average of $12.24 in new debt for every $1 of property NOI, down 84 cents from the prior quarter and 6 cents from last year (Chart 15).
Outlook
Reaching herd immunity is the single most important factor for a sustained recovery, and the continued vaccination rollout credibly brings that reality within sight. The most recent McKinsey projection (as of November 2020) forecasts that the U.S. will hit herd immunity and a return to somewhat “normal” life around the third or fourth quarter of 2021. While there is hope on the horizon, the labor market may see further deterioration in the months ahead. After months of slow progress, more jobs were lost than added in December, and a reprieve may not come until the spring. As long as there is a labor market in crisis, the financial wellbeing of renters will remain a concern. Still, according to NMHC, renters have, with some local exception, successfully prioritized their monthly rent obligations so far during the pandemic.
The success of small multifamily operators in 2021 will likely be increasingly sensitive to local factors. One of the biggest open questions heading into the new year is whether or not the outflowing pour of residents from high-priced markets into less expensive metro areas and suburbs will continue at such a robust pace. All else equal, there is little evidence to suggest that the small asset subsector nationally is underperforming the market for larger properties. Moreover, small multifamily renters are often less transient and are less likely to transition into homeownership, preserving short-term apartment demand. The small multifamily sector outperformed downside projections from the early spring, and its penchant for stability does not appear at risk, even as 2021 may prove to be a bit darker before the dawn.
For more small multifamily research and insights, visit arbor.com/articles
Disclaimer All content is provided herein “as is” and neither Arbor Realty Trust, Inc. or Chandan Economics, LLC (“the Companies”) nor their affiliated or related entities, nor any person involved in the creation, production and distribution of the content make any warranties, express or implied. The Companies do not make any representations regarding the reliability, usefulness, completeness, accuracy, currency nor represent that use of any information provided herein would not infringe on other third party rights. The Companies shall not be liable for any direct, indirect or consequential damages to the reader or a third party arising from the use of the information contained herein.