Articles

FHFA Loan Caps for 2025: What Multifamily Borrowers Need to Know

The Federal Housing Finance Agency (FHFA) announced a $3 billion boost to Fannie Mae and Freddie Mac’s volume cap for loan purchases in 2025 to $146 billion ($73 billion for each agency). This increase in FHFA loan caps for 2025 aligns with industry expectations, given the anticipation of improving market conditions and lending activity expected in a lower interest rate environment. Next year’s cap for the Government-Sponsored Entities (GSEs) is an increase of approximately 4% from the $140 billion limit set for 2024.

Analysis

U.S. Multifamily Market Snapshot — November 2024

The U.S. multifamily market held steady in a more normalized cycle through the first three quarters of 2024, following its skyrocketing recovery from the pandemic-related contraction. Rental demand remained strong, driven by the continued nationwide housing shortage and strong wage growth, while the high levels of new construction seen over the last two years appears to have peaked.

Current Reports

Small Multifamily Investment Trends Report Q4 2024

Small multifamily’s normalization pushed forward last quarter as the Federal Reserve made a long-awaited reduction to the target federal funds rate. Arbor’s Small Multifamily Investment Trends Report Q4 2024, developed in partnership with Chandan Economics, shows signs of stability have multiplied. Robust rental demand, a limited supply of quality affordable housing, and several other promising developments should support the subsector’s strength heading into 2025.

Analysis

Top U.S. Multifamily Rent Growth Markets — Q3 2024

The U.S. multifamily market held steady in a more normalized cycle during the third quarter of 2024. Rental demand remained strong, while new leaders emerged among the top markets for rent growth.

Articles

Top Markets for Wage Growth in 2024

One of the most essential factors multifamily investors need to consider before executing a transaction is the health of the local labor market. Wage growth and other trends are driven by a delicate, constantly adjusting balance of labor supply and demand. In some markets, an inflow of employers can cause wages to spike. In others, population outflows can create the same effect. In this deep dive, we expand on the data findings from the 2024 Top Markets for Multifamily Investment Report, exploring the unique conditions driving metro wage growth trends.

Press Contact

Press Contact If you are a member of the media and would like to arrange an interview with one of our knowledgeable multifamily and commercial real estate finance executives or if you have general media questions about Arbor, please contact us at [email protected] or through the below form.   Fill out the form to reach our press team.  

Current Reports

Top Markets for Multifamily Investment Report 2024

With interest rate pressure easing, quality multifamily investment opportunities have emerged from coast to coast, making identifying the optimal location essential. A roadmap for investors, Top Markets for Multifamily Investment Report 2024, developed in partnership with Chandan Economics, ranks the top 50 metropolitan markets found through an analysis of 10 key factors, including affordability, population growth, and climate risk.

Articles

The Value of a Top Freddie Mac Small Balance Loans Lender

Small multifamily properties play a crucial role in providing affordable and market-rate rental housing across the country. But Arbor and Freddie Mac understood that financing in this sector had historically been fragmented when we partnered to create the Small Balance Loan (SBL) program in 2014. As the program celebrates its 10th anniversary in 2024, Arbor is proud to have helped pioneer the product to meet a critical need for our borrowers. A six-time Top Small Balance Loans Lender, Arbor has the right experience to expertly customize loan products and align your asset’s long-term goals with your community’s needs.

General: 800.ARBOR.10

2021 Top Markets for Large Multifamily Investment Report

Overview

The U.S. economy continued its path back to health through the third quarter of 2021. As of the second-quarter estimate of annualized real gross domestic product (GDP), the economy is now 0.9% larger than it was before the onset of the pandemic. The multifamily sector has weathered the storm exceedingly well and is accelerating into the recovery. According to the Real Capital Analytics Commercial Property Price Index for apartment properties, asset valuations are up 14.7% from one year ago, measured through August.


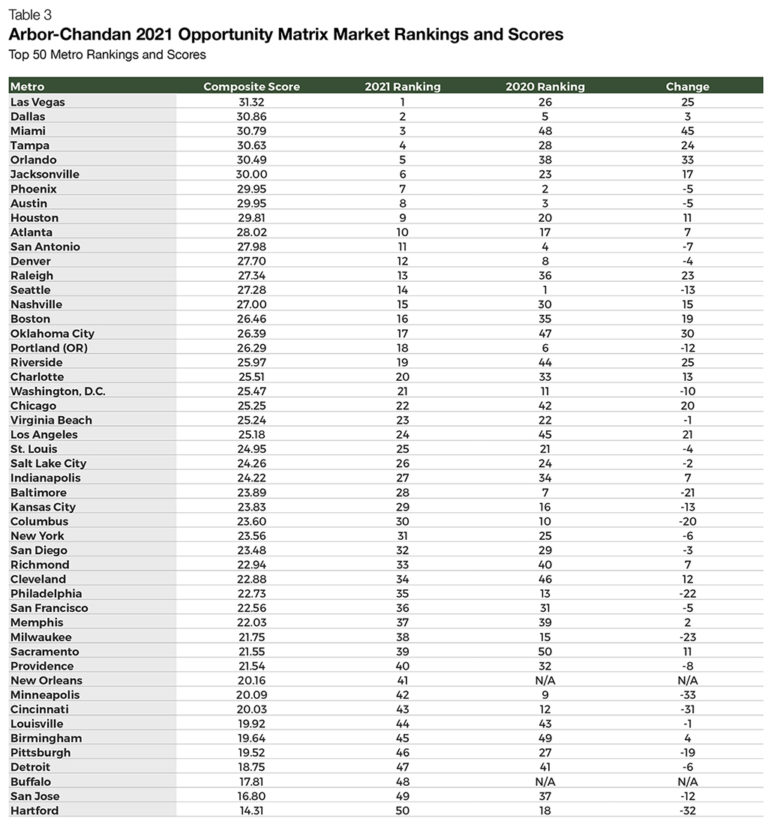
In this report, the research teams at Arbor Realty Trust and Chandan Economics present an analytical framework to develop a cross-market comparison for large multifamily investment. The top 50 U.S. metros1 are ranked using the Arbor-Chandan Large Multifamily Opportunity Matrix based on a composite of performance metrics. It pays specific attention to how local economies have fared during the pandemic and how well multifamily investment activity has held up. Overall, the Matrix finds Sun Belt markets remain well-positioned for the year ahead, with Las Vegas, Dallas and Miami leading the way.

1 The top 50 metros are based on population estimates. All metros are reported at the Metropolitan Statical Area (MSA) level.

Key Findings

  • Work from home (WFH) resiliency and a recovering tourism industry propelled Las Vegas to the top of the 2021 Arbor-Chandan Large Multifamily Opportunity Matrix.
  • Four metros in Florida jumped significantly in the Matrix rankings, reflecting the state’s continued strong labor market performance despite pandemic disruptions.
  • As a region, the Sun Belt generally ranked well across the Matrix factors measured, despite experiencing higher COVID-19 case counts per capita.

The Arbor-Chandan Large Multifamily Opportunity Matrix

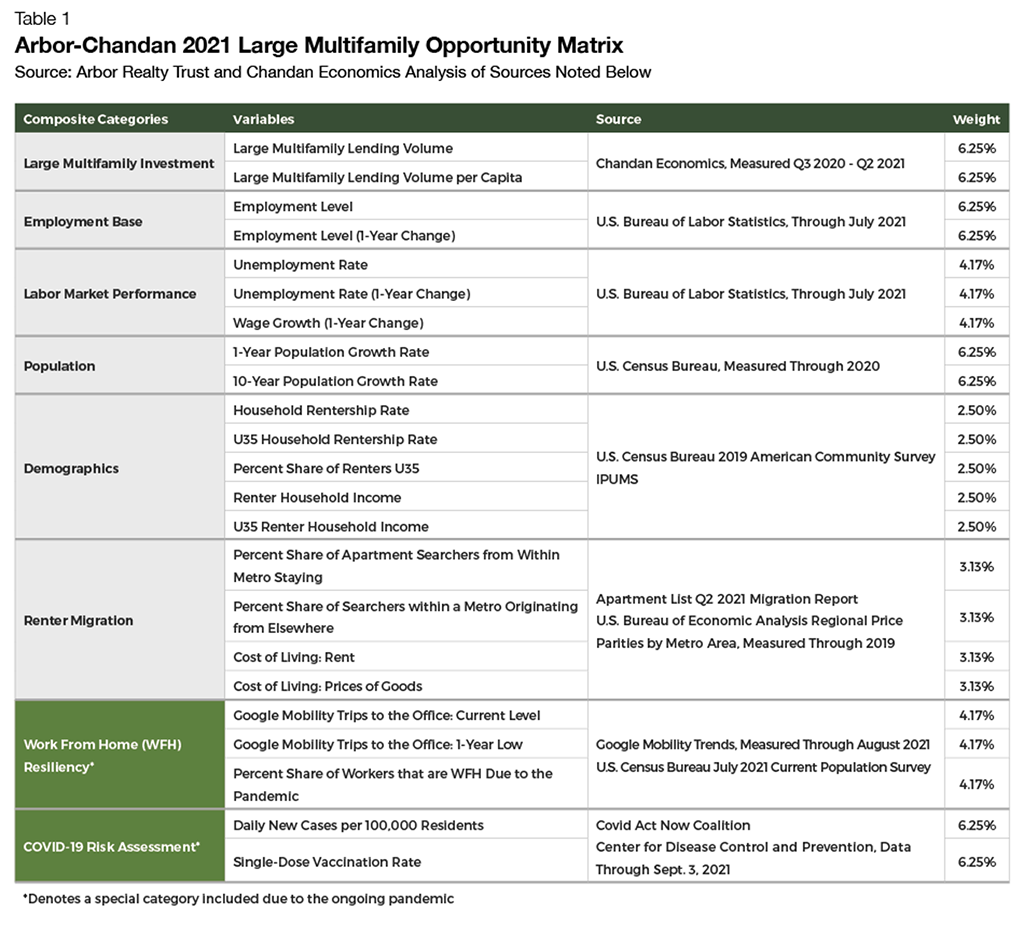
The 2021 Arbor-Chandan Large Multifamily Opportunity Matrix measures eight key categories:

  1. Levels of Large Multifamily Investment: debt financing availability within a market and a market’s ability to support additional multifamily investment
  2. Employment Base: labor market size and growth
  3. Labor Market Performance: current labor market conditions amid the continued pandemic
  4. Population Growth: overall growth of a metro over the short and medium term
  5. Renter Demographics: spending power and age profile of existing renters (higher household incomes and younger householders assumed as conducive for higher levels of multifamily demand)
  6. Renter Migration: a market’s ability to retain existing renters and attract renters from elsewhere
  7. Work From Home (WFH) Resiliency: a market’s degree of WFH adoption
  8. COVID-19 Risk Assessment: the continued impact of the pandemic on a market
The Opportunity Matrix includes factors a multifamily investor might consider in their market selection process. All eight categories get equal weighting. In categories with more than one variable, each variable receives equal weight. For the full Matrix breakdown, see Table 1 below.

Top Ranked Markets

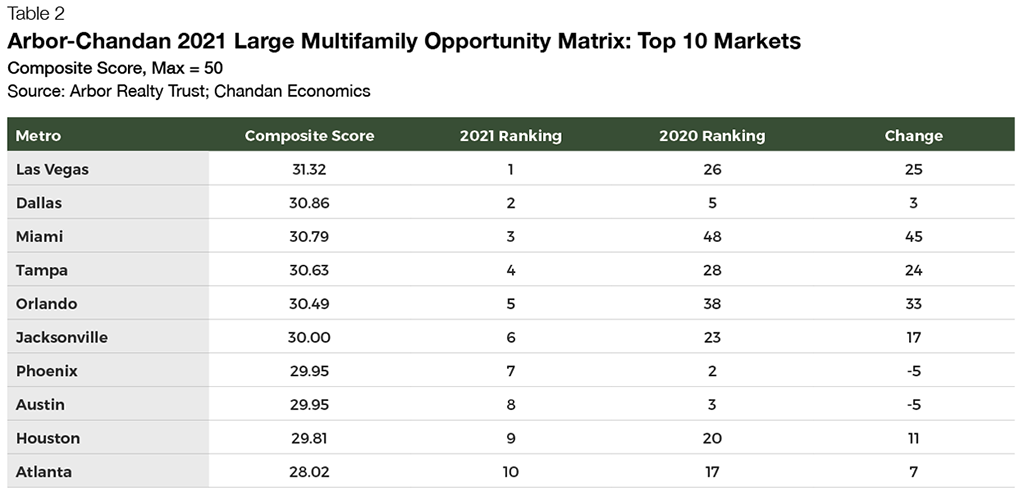
Rising to the top of the 2021 rankings is Las Vegas (Table 2). The metro leads the pack in several key criteria, including a favorable cost of living, a high share of apartment-searching renters looking to stay in the metro area and a resurgent labor market. The Las Vegas labor market appears to be one of the more WFH-resilient in the country, a partial function of its tourism-centric economy and a high share of workers employed in the leisure and hospitality sector. According to Chandan Economics’ analysis of the latest Current Population Survey, the Las Vegas metro had the second-lowest percentage of workers in the country that reported working remotely in the prior month due to the pandemic. 
For a full breakout of the 2021 and 2020 MSA composite scores and rankings, see Table 3 in the Appendix at the end of the report.

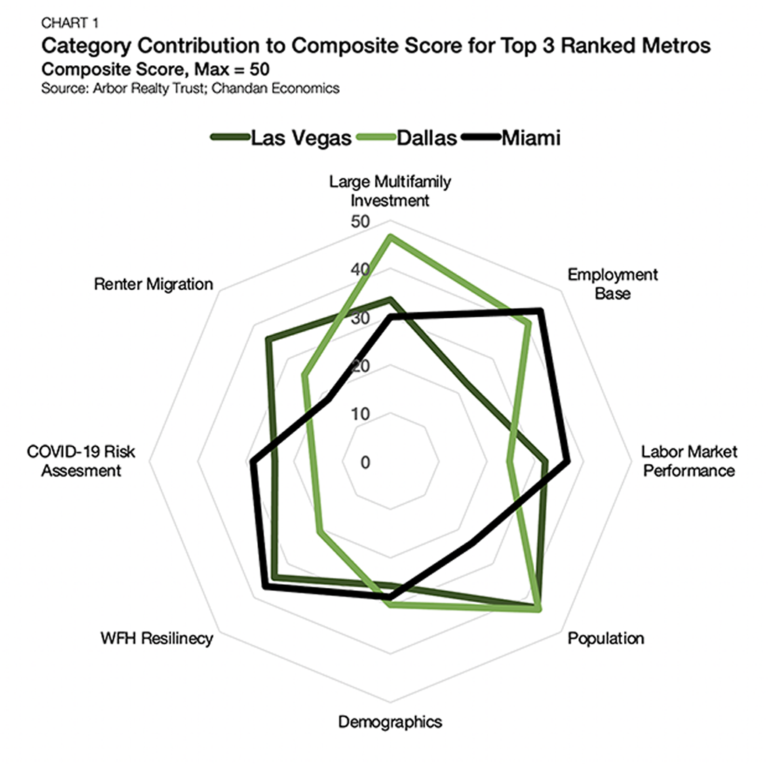
Dallas, after appearing as the fifth-ranked metro in 2020, has returned back to the podium, claiming the No. 2 spot in the 2021 rankings (Chart 1). Wages grew 8.7% from a year earlier through July across the Dallas metro area, the second-fastest tally in the nation. According to Apartment List’s Q2 2021 Renter Migration Report, no metropolitan area tracked in this report does a better job of retaining its renters than Dallas. A nation-leading 82.2% of the metro’s apartment searchers are looking to stay local. Through the year ending in second-quarter 2021, Dallas comes in third and fourth for large multifamily lending volume and large multifamily lending volume per capita, respectively, reflecting the market’s size and continued ascent.

Miami comes in third, with the metro appearing resistant to the de-urbanizing wave of WFH adoption. Miami’s pandemic-related share of WFH employees is the 10th lowest in the country. Moreover, Miami posts the fourth-highest vaccination rate and the third most significant drop in its unemployment rate of all metro markets in the sample. Miami’s success comes as it continues to attract both firms and workers from the Northeast, offering lower taxes and warmer temperatures. According to the Apartment List report, a whopping 15.7% of inbound searchers are from New York alone — more than three times as high as the next highest inbound-searching metro, Orlando (4.5%). It should come as no surprise that Bloomberg is dubbing the blossoming market as Wall Street South, as more workers are trading the West Village for West Palm.

Work From Home Resiliency

While the long-term impact of WFH adoption is presently unknown, it is a new factor that investors are paying attention to and will continue to watch. Multifamily properties near large central business districts (CBDs) tend to achieve their high rents and tenant demand due to their proximity to the CBDs. These assumptions follow a recent Fitch Ratings paper studying New York and the potential adverse long-term effects of a shift to WFH. The report notes the potential for negative downstream effects for all other commercial property sectors, government revenues and population migration trends.
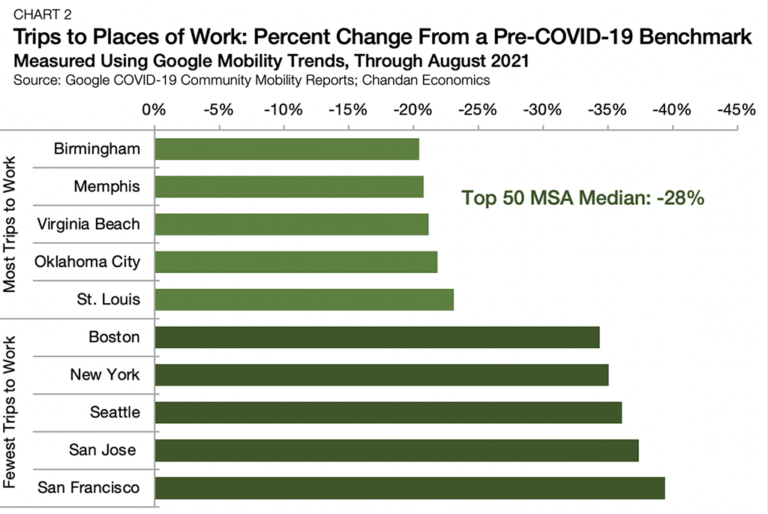
Measured across the three WFH resiliency variables in the Matrix, secondary Sun Belt metros, especially in the Southeast, are ahead. According to Google Mobility Data, compared to a pre-pandemic baseline, trips to the workplace in Birmingham are only down by 20% through August (Chart 2). Memphis and Virginia Beach follow closely behind, with trips to the workplace only down by 21% each. San Francisco and San Jose are at the other end of the spectrum, with trips to work down by 39% and 37%, respectively.

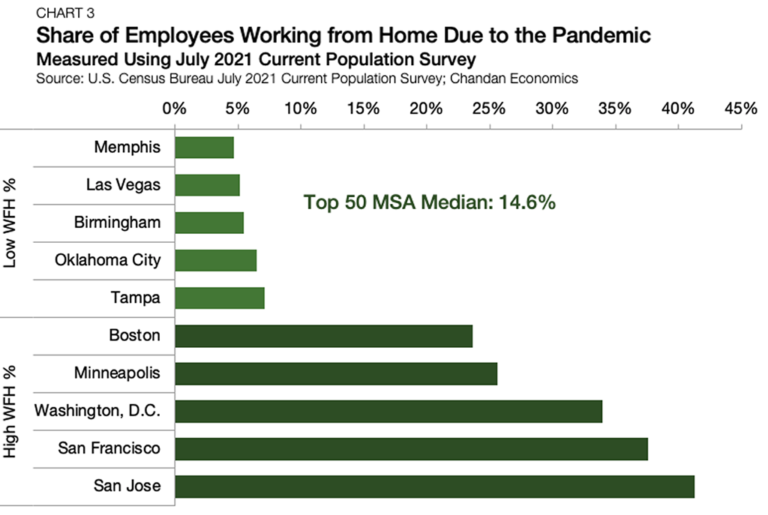
Data trends are similar for the share of workers who report working from home in the past month due to the pandemic. Memphis comes out on top, with just 4.6% of workers reporting they are working from home as a direct result of the pandemic (Chart 3). Las Vegas follows next at 5.2%. Again, the tech-centric San Jose and San Francisco markets are at the other end, with 41.2% and 37.5% of workers reporting they worked from home because of the pandemic, respectively.

COVID-19 Risk Assessment

Chandan Economics considers two criteria as a proxy for forward-looking pandemic risk: single-dose vaccination rates and current case counts per 100,000 people. Together, these two metrics reflect the presence of heightened uncertainty in today’s investment environment. While recent COVID-19 trends have had little bearing on market-level success over the past year, the unlikely (though possible) scenario of a worsening pandemic warrants consideration.

We include single-dose vaccination rates assuming that higher vaccination rates will result in less severe public health crises through the current Delta variant wave and potential future waves. Current case counts per 100,000 residents reflect how well public officials have managed the most recent surge, offering a real-time performance gauge and a starting point for future expectations if additional variants are detected.

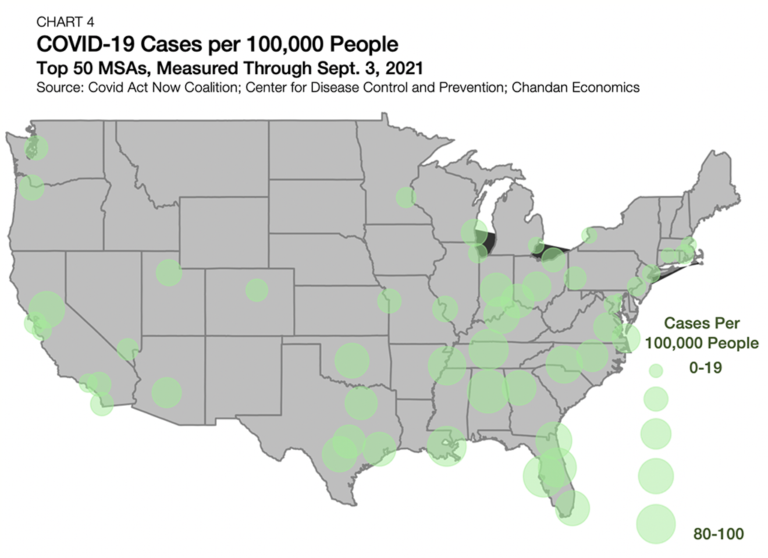
Despite performing exceedingly well in the final rankings, portions of the Sun Belt lag in their recent public health response. Birmingham had the highest level of cases of any major metro in the U.S., confirming an average of 97.2 cases per 100,000 people through early September (Chart 4). Tampa, which sits at fourth in the overall Matrix, follows closely with 92.3 cases per 100,000. On the other end of the spectrum, Baltimore, Hartford and Buffalo lead the charge in effectively limiting the spread of the Delta variant, with caseloads of 16.1, 18.8, and 19.7 per 100,000 people, respectively.

Large Multifamily Investment

Large multifamily investment across U.S. markets is anything but uniform. Here, we analyze a limited pool of loans originated between the second half of 2020 and the first half of 2021, with original balances above $15 million and across the top 50 metros. Lending volumes include loans originated for both investment sales and refinancings. They are used here as a proxy for where market-level liquidity and total investment activity have held up amid the coronavirus turbulence.

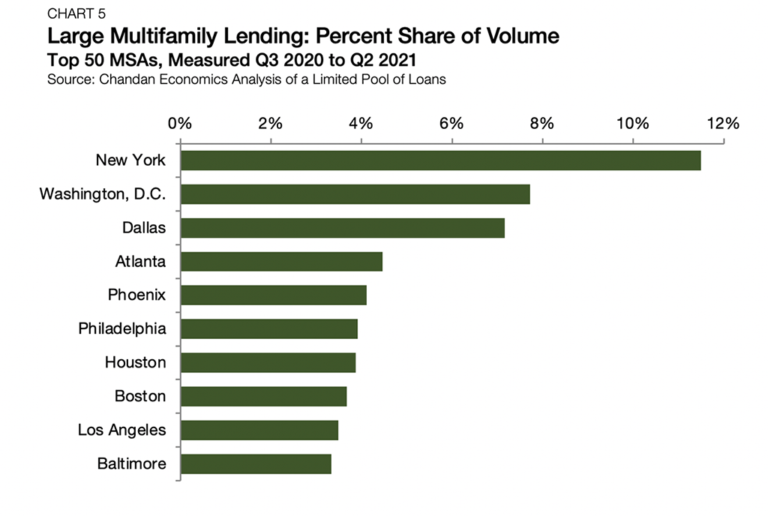
Leading the way and accounting for 11.5% of the sample’s total lending volume was New York, the country’s largest metropolitan area (Chart 5). The Big Apple’s overall size means it will always remain at or near the top of the multifamily investment list when measured in the aggregate. Although New York had a uniquely challenging and downtrodden year compared to its previous performance, it remains the most liquid market in the country. The next closest metro by tracked lending volume, Washington, D.C., accounted for 7.7% of the overall sample.

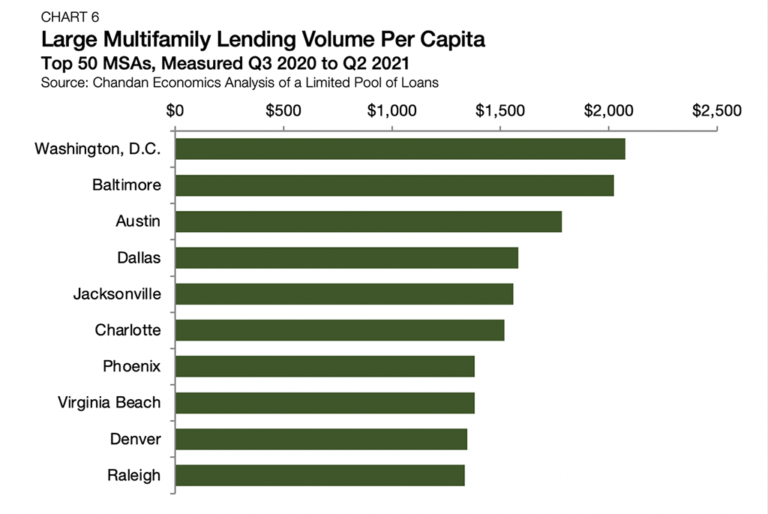
Next, we look at the most liquid markets relative to existing market size by taking a per-capita metric of lending volume. These data adjust for population differences and allow for an ‘apples to apples’ comparison, meaning that a metro won’t just come out ahead because of how big it is. Measuring this way, Washington, D.C claims the top spot, with Chandan Economics tracking $2,075 of large multifamily lending volume for every MSA resident (Chart 6). Baltimore, Austin and Dallas follow next, with annual multifamily lending volumes per capita between $1,581 and $2,023.

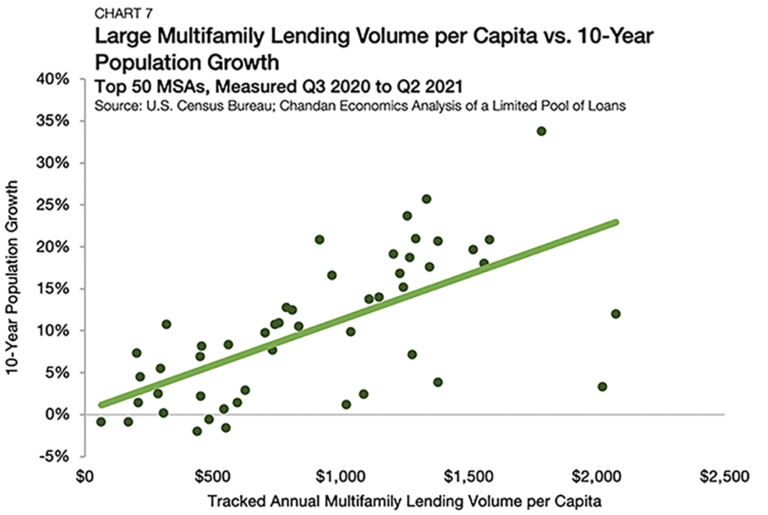
Taking these data together with population growth figures uncovers an expected albeit meaningful relationship. The sample’s large multifamily lending volume per capita is 65% correlated with 10-year population growth totals (Chart 7). Broadly speaking, where people are moving, investment dollars tend to follow. These data suggest that while the investment prospects of a market are multifaceted and unique to local factors, how well a market is supporting residential population growth is a simple yet powerful predictor of multifamily demand.

Market Spotlight: Las Vegas

The Las Vegas metropolitan area hit the jackpot, rising to the top of the 2021 Matrix. The Las Vegas labor market and its post-shutdown bounce back are significant reasons for its nation-leading rank.

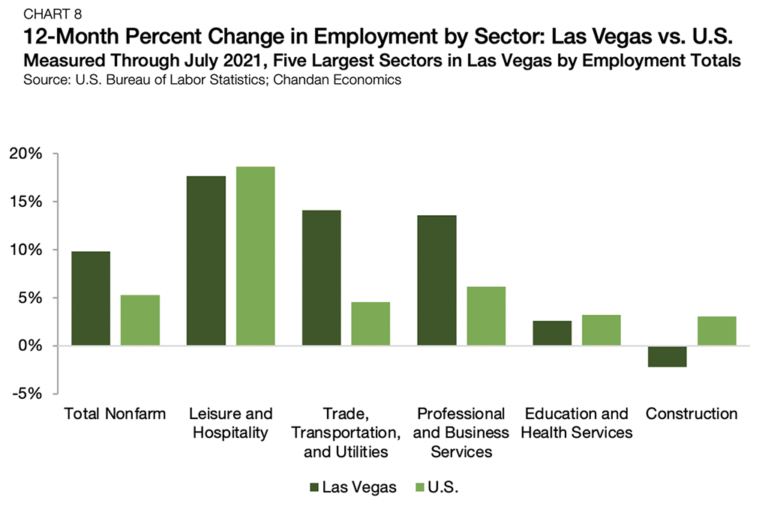
Total nonfarm employment grew by 9.8% in Las Vegas over the year ending July 2021, significantly higher than the 5.3% observed nationally. The Las Vegas MSA’s largest employment sector, leisure and hospitality, bounced back over the year ending July 2021, posting annual job growth totals of 13.6%. While the leisure and hospitality sector grew slightly slower in Las Vegas than the sector’s national average (18.7%), leisure and hospitality accounts for a much larger share of Las Vegas employment totals (23.7%) than it does nationally (10.3%).

In addition to leisure and hospitality, the trade, transportation and utilities sector, and the professional and business services sectors, each posted double-digit annual job growth, more than double the sectors’ national growth rates. The Las Vegas MSA notched the second-largest drop in its unemployment rate in the year ending July 2021, declining by 10.2%.

At the heart of the Las Vegas economy is, of course, tourism. Visitor traffic to Las Vegas had nearly recovered by July 2021, before receding 9.0% amid the Delta variant surge in August. Despite the recent setback, the return of visitors is a welcome sign for the near-term Las Vegas recovery, and with major conferences now officially back underway, the sector should receive another boost.

At the same time, Las Vegas has done an impressive job in recent years of reducing its reliance on its largest sector. According to a Chandan Economics analysis of U.S. Bureau of Labor Statistics data, between mid-2011 and the onset of the pandemic, the leisure and hospitality share of the Las Vegas workforce gradually declined by 4.4% as other sectors grew more quickly.2

The Las Vegas 1-year and 10-year population growth rates through 2020 were 3.6x and 2.8x higher than the national average, respectively.

Population and demographic trends in the Las Vegas metro are also pointing to sustained growth in multifamily demand. In 2020, the resident population in Las Vegas grew by 1.8% — the fourth-highest growth rate in the country. Further, the Las Vegas population over the 10 years ending in 2020 expanded by an equally impressive 18.7%, the 10th-fastest rate in the sample. 


The local rental market in Las Vegas is well-positioned to benefit from an expanding population. According to a Chandan Economics analysis of the latest American Community Survey, the homerentership rate in the Las Vegas MSA sat at 42.7%, the fifth-highest mark in the country. These trends have The Entertainment Capital of the World adding “Relocation Heaven” to its growing list of nicknames, with its proximity to expensive California markets and comparatively affordable rents making it a magnet for transient lifestyle renters.


Altogether, the Las Vegas local market story is one of resiliency, diversification and desirability — all of which support forward-looking multifamily market success. According to Yardi Matrix, rents are up 14.6% from one year ago through the second quarter of 2021. Yardi Matrix also notes in their latest report that apartment supply constraints and strong population growth are pushing occupancy rates to 96.0% in stabilized rentals, indicating continued demand for multifamily.

2 Analysis from June 2011 through March 2020. Sector percent share of nonfarm employment fell from 32.3% to 27.9%.

Outlook

The ongoing pandemic has dominated the market-level investment narrative since mid-2020. However, national and local economies have learned to cope with the pandemic more effectively and its impacts are less disruptive.


Moving into 2022 and beyond, fundamentals of supply and demand along with traditional considerations of labor growth and productivity, residential affordability, and the attractiveness of markets to new businesses and residents, will take center stage. As a result, significant shifts in the Matrix should become less frequent.


As employers call workers back to the office and commute times become relevant once again, the demand for apartments in coastal gateway markets will continue to recover. However, if WFH policies becoming permanent within companies, these markets would likely be negatively impacted.


Coastal gateway markets’ gain, however, does not mean a reversal of the Sun Belt’s positive trajectory bolstered by the pandemic. Sun Belt markets will remain attractive and continue to grow due to their relative affordability and appeal to renters with the means and flexibility to relocate. However, the growth rate across these smaller markets will likely return to a more normal pace.

Appendix

Disclaimer All content is provided herein “as is” and neither Arbor Realty Trust, Inc. or Chandan Economics, LLC (“the Companies”) nor their affiliated or related entities, nor any person involved in the creation, production and distribution of the content make any warranties, express or implied. The Companies do not make any representations regarding the reliability, usefulness, completeness, accuracy, currency nor represent that use of any information provided herein would not infringe on other third party rights. The Companies shall not be liable for any direct, indirect or consequential damages to the reader or a third party arising from the use of the information contained herein.