Arbor Realty Trust recently wrapped up its 18th Annual Holiday Drive, which raised nearly $22,000 for Long Island-based Family & Children’s Association (FCA). As in past years, Arbor extended the impact of the drive by matching all employee contributions dollar-for-dollar.
Small Multifamily Investment Trends Report Q3 2022
Liquidity and Inflation Protection Continue to Attract Investors Even as Underwriting Standards Tighten
Key Findings
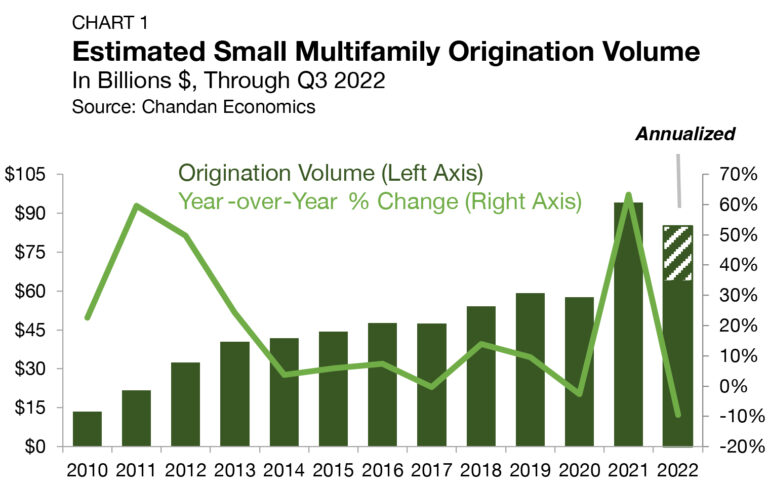
- Small multifamily originations are on pace to hit $85.1 billion in 2022, sliding from 2021’s record high.
- Cap rates hold at 5.0%, despite rising benchmark interest rates.
- Underwriting standards tighten as LTVs fall and debt yields tick up.
State of the Market
After a record-breaking 2021, financial turbulence has become the norm in recent months, and forecasts indicate we can expect more rocky economic conditions ahead.
Whether or not we are in a recession has become a hotly debated topic. The GDP posted annualized declines in both the first and second quarters of 2022, fulfilling a common, informal definition of a recession. Notable industry voices, including National Association of Home Builders Chief Economist Robert Dietz, have said they believe that we have already tipped into a recession, with 76% of adult Americans delaying major purchases in preparation for a downturn.
Persistently high levels of inflation and the Federal Reserve’s aggressive monetary policy continue sending shock waves through the economy. According to the U.S. Bureau of Labor Statistics (BLS) Consumer Price Index, prices of goods and services increased 8.2% from one year ago through September 2022. In response, the Federal Open Markets Committee raised its benchmark rate by another 75 bps at its September meeting. After beginning the year at near-zero short-term interest rates, the FOMC hiked interest rates six times, including a 75 bps increase on November 2.
The multifamily sector and small asset sub-sector continue to benefit from a unique set of circumstances. While multifamily assets are not “recession-proof,” they are downturn resilient. Positive performance trends this year against the backdrop of economic headwinds and stock market declines demonstrate the sector’s durability.
Even as rent growth decelerates, year-over-year gains still outpace inflation. The sector’s unique ability to absorb inflationary pressures is a powerful differentiator that continues to attract new buyer demand. Liquidity is another factor that has enabled the small multifamily sub-sector to maintain its resiliency. Small multifamily loans for market-rate properties often qualify for Fannie Mae and Freddie Mac’s mission-lending mandates, making small multifamily an attractive niche.
There are some signs of an apparent market shift in recent months, especially with respect to tightening credit underwriting standards.
However, the structural undersupply of quality affordable housing options will continue to support rental demand as credit availability remains buttressed by the Agencies. On balance, the small multifamily sub-sector remains in a favorable position to withstand macroeconomic instability.
Lending Volume
The year-end 2021 estimate of new multifamily lending volume for loans with original balances between $1 million and $7.5 million[1] — including loans for apartment building sales and refinancing — surged to $94.1 billion (Chart 1). The record total represented both a wave of pent-up investment demand that sat on the sidelines during the pandemic uncertainty of 2020 and the anticipation of monetary tightening. 2021’s originations total represented an annual increase of $35.6 billion (up 63.3%) from the year prior.
Through 2022’s three-quarters mark, small multifamily originations were on pace to reach $85.1 billion, sliding down from last year’s record highs. The current year-end estimate would represent a 9.6% decrease from 2021’s total. The small multifamily estimate directionally aligns with the Mortgage Bankers Association’s 2022 multifamily lending forecast, which predicts a 6.6% drop-off in total multifamily lending this year.
Even with small multifamily originations on pace to decline slightly in 2022, the current estimate remains elevated in the context of recent history. Compared to the last year before the pandemic (2019), 2022’s volume is on pace to land 43.8% higher.
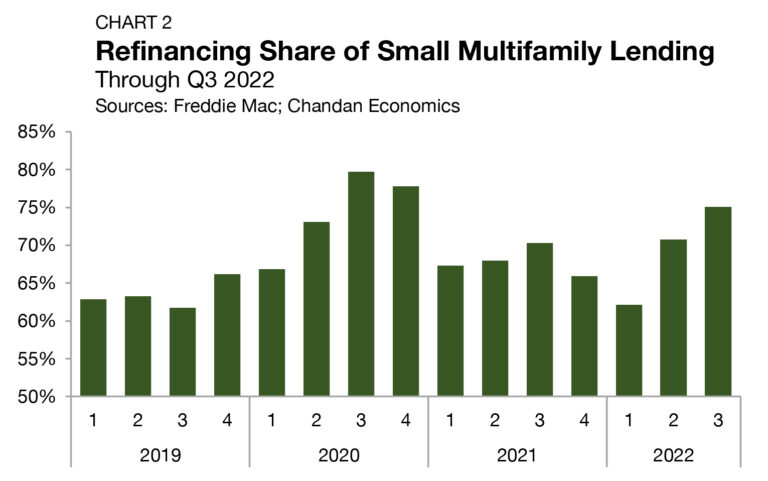
Refinancing activity is one significant factor elevating small multifamily originations. Loans originated for the purpose of refinancing accounted for 75.1% of small multifamily lending activity in the third quarter of 2022 — the highest share since the end of 2020 (Chart 2). This uptick in refinancings comes at a time when financing costs have increased. However, for smaller, non-institutional investors, accrued equity in existing investments is often used as a critical source of capital for their next deal. According to WMRE’s investor sentiment survey, a plurality of multifamily investors are in buying mode, with 40.3% still looking for new opportunities this year.
Arbor Small Multifamily Price Index
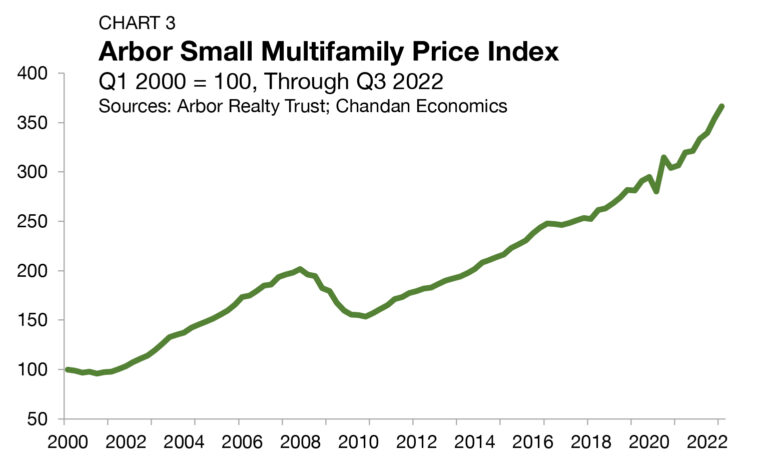
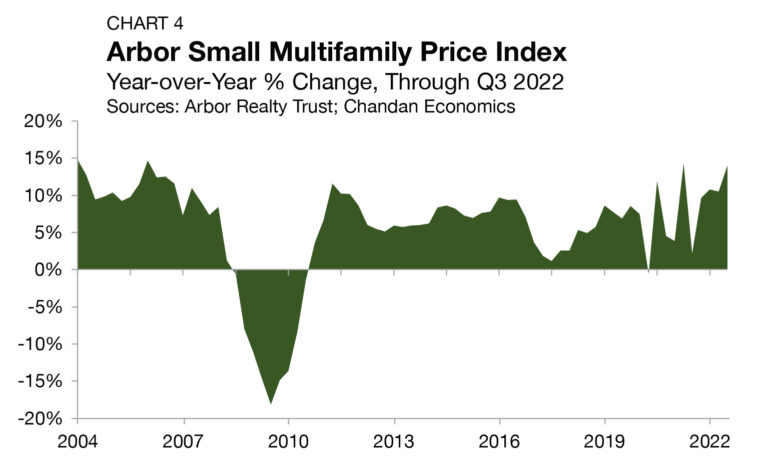
As measured by the Arbor Small Multifamily Price Index[2], small multifamily asset valuations surged in the third quarter of 2022, rising 3.6% quarter-over-quarter and 14.0% year-over-year (Chart 3 and Chart 4). These data directionally align with Freddie Mac’s Apartment Investment Market Index, which similarly shows robust levels of sector-level valuation growth. Multifamily properties, which have an average lease of one year, have demonstrated an ability to capture inflationary pressures through cash flows and valuations. Further, in the small multifamily sub-sector, Agency participation has safeguarded liquidity. Together, these factors have led to an extraordinary period of asset price growth.
Cap Rates & Spreads
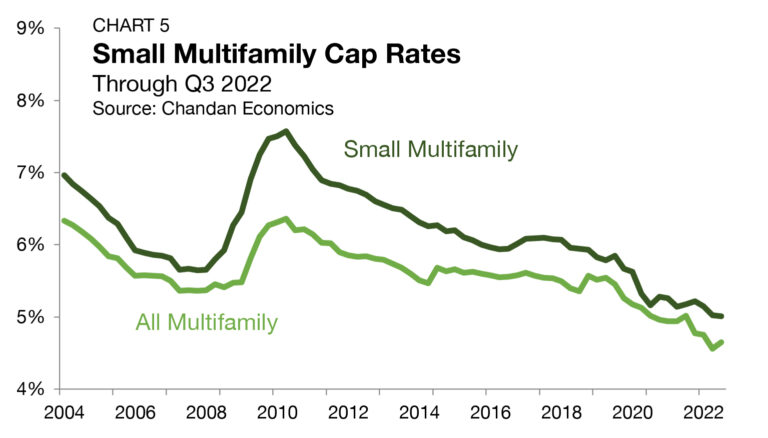
National average cap rates for small multifamily properties nudged down to another new all-time low of 5.0% in the third quarter of 2022, even as interest rates have climbed (Chart 5). In total, small multifamily cap rates fell by just a single basis point, effectively remaining unchanged from the prior quarter. This stability is noteworthy as market yields have risen broadly across the economy.
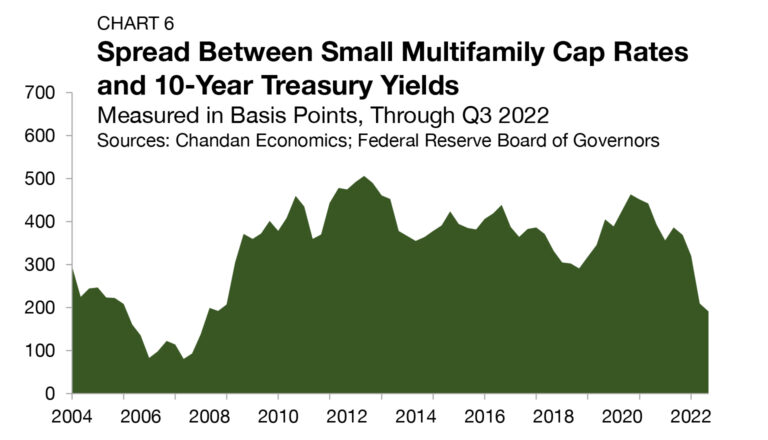
The small multifamily risk premium, measured by comparing cap rates to the yield on the 10-Year Treasury, fell again in the third quarter of 2022, dropping from 209 bps to 191 bps. This was the lowest level since the fourth quarter of 2007 (Chart 6).
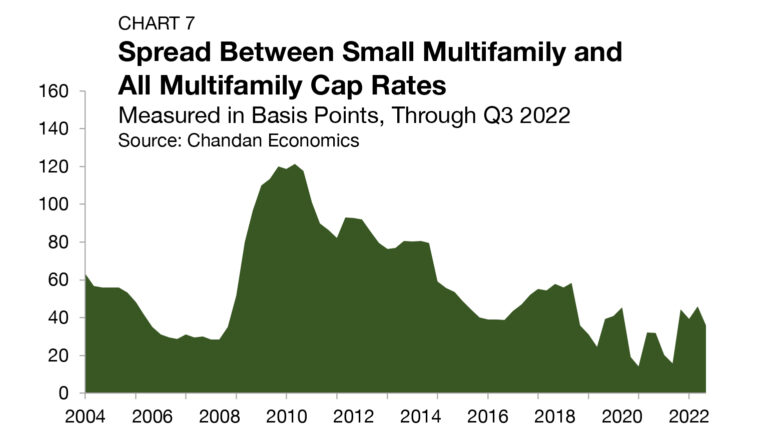
The compressing spread comes as cap rates have remained anchored at their lows while monetary tightening policy and persistent inflation have pushed Treasury yields to their highest levels in more than a decade. The cap rate spread between small multifamily assets and the rest of the multifamily sector, a measure of the risk unique to smaller properties, decreased slightly by 10 bps during the third quarter of 2022, settling at 36 bps (Chart 7).
Expense Ratios
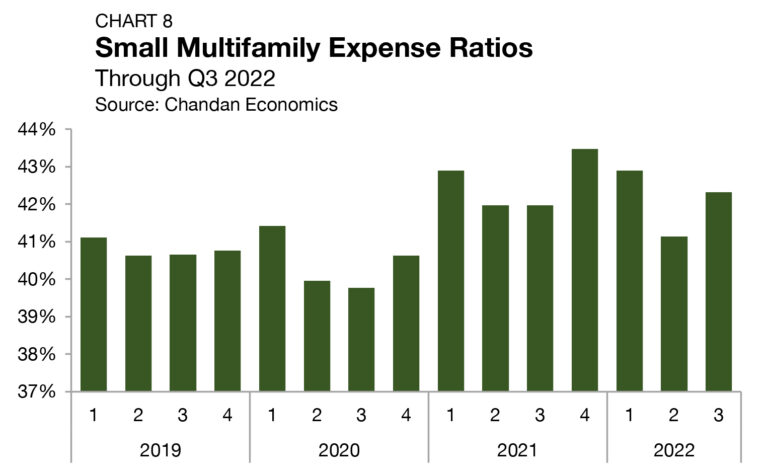
Expense ratios, measured as the relationship between underwritten property-level expenses and effective gross income, have been sitting higher over the past two years than they had in the two years prior. In 2019 and 2020, expense ratios averaged 40.6% while sitting in a narrow range between 39.8% and 41.4% (Chart 8). Since the start of 2021, expense ratios have averaged 42.4% and have reached as high as 43.5%. A National Apartment Association analysis of 2021 data found that rising property taxes and insurance premiums, and rising utilities, were the main culprits for sustained higher operating expenses.
Leverage & Debt Yields
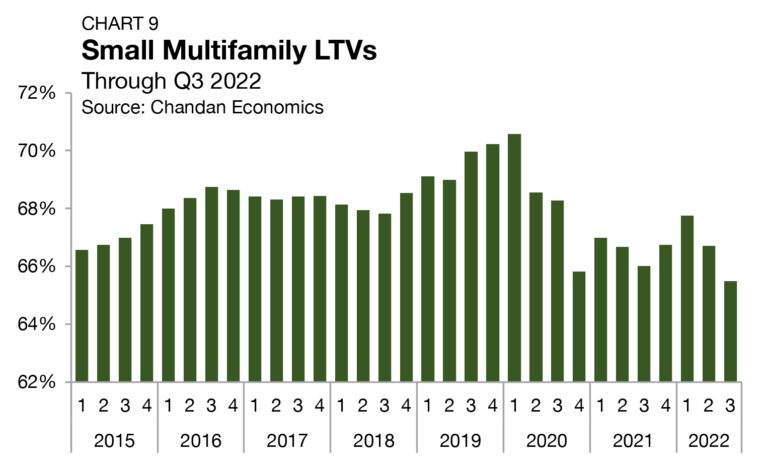
While cap rate trends suggest that investors participating in the equity side of the capital stack are remaining aggressive, measures of risk-taking on the debt side are turning conservative. Loan-to-value ratios (LTVs) marched higher and higher during the 2010s, hitting an all-time high of 70.5% in March 2020. LTVs then fell sharply to 65.8% by the end of 2020. While LTVs ticked up marginally in 2021, they slid again in 2022. In the third quarter, LTVs fell by a sizable 123 bps to 65.5% — their lowest point on record since 2014 (Chart 9).
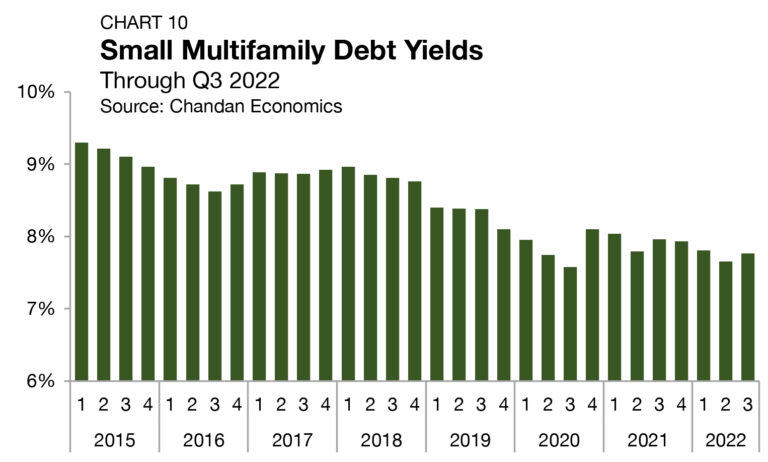
Debt yields for small multifamily loans rose by 11 bps to 7.8% in the quarter (Chart 10). The most recent reading marked the third time in the past four years that debt yields have risen. The inverse of debt yields, the debt per dollar of NOI, fell for small multifamily loans. Small multifamily borrowers secured an average of $12.88 in new debt for every $1 of property NOI, down $0.18 from the previous quarter.
Outlook
The small multifamily sector remained resilient during the third quarter of 2022, despite challenges in the broader macroeconomic environment.
With small multifamily risk premiums falling to their lowest levels since 2007 amid ascending Treasury rates, it is increasingly likely that some upward cap rate pressure can be expected — a forecast supported by First American’s potential cap rate model.
Still, underlying rental demand is expected to remain strong over the short term. Declining credit availability and higher financing costs are likely to keep many would-be buyers in the rental market. While the small multifamily sub-sector is not immune from economic disruption, it appears to be well-insulated to handle the weight of current and expected business cycle headwinds.
For more small multifamily research and insights, visit arbor.com/articles
1 All data, unless otherwise stated, are based on Chandan Economics’ analysis of a limited pool of loans with original balances of $1 million to $7.5 million and loan-to-value ratios above 50%.
2 The Arbor Small Multifamily Price Index (ASMPI) uses model estimates of small multifamily rents and compares them against small multifamily cap rates. The index measures the estimated average price appreciation on small multifamily properties with 5 to 50 units and primary mortgages of $1 million to $7.5 million. For the full methodology, visit arbor.com/asmpi-faq.
Disclaimer
All content is provided herein “as is” and neither Arbor Realty Trust, Inc. or Chandan Economics, LLC (“the Companies”) nor their affiliated or related entities, nor any person involved in the creation, production and distribution of the content make any warranties, express or implied. The Companies do not make any representations regarding the reliability, usefulness, completeness, accuracy, currency nor represent that use of any information provided herein would not infringe on other third party rights. The Companies shall not be liable for any direct, indirect or consequential damages to the reader or a third party arising from the use of the information contained herein.


