Articles

LIHTC Program: An Impactful Affordable Housing Financing Resource

As renters face a national shortage of 7 million low-income rental homes, the U.S. Department of Housing and Urban Development’s (HUD) Low-Income Housing Tax Credit (LIHTC) program is pivotal in helping to close the affordability gap for renters. It is the nation’s most significant resource for affordable apartment housing construction, which gives state and local agencies approximately $10 billion in annual budget authority to issue tax credits for affordable housing development.

Articles

FHFA Loan Caps for 2025: What Multifamily Borrowers Need to Know

The Federal Housing Finance Agency (FHFA) announced a $3 billion boost to Fannie Mae and Freddie Mac’s volume cap for loan purchases in 2025 to $146 billion ($73 billion for each agency). This increase in FHFA loan caps for 2025 aligns with industry expectations, given the anticipation of improving market conditions and lending activity expected in a lower interest rate environment. Next year’s cap for the Government-Sponsored Entities (GSEs) is an increase of approximately 4% from the $140 billion limit set for 2024.

Analysis

U.S. Multifamily Market Snapshot — November 2024

The U.S. multifamily market held steady in a more normalized cycle through the first three quarters of 2024, following its skyrocketing recovery from the pandemic-related contraction. Rental demand remained strong, driven by the continued nationwide housing shortage and strong wage growth, while the high levels of new construction seen over the last two years appears to have peaked.

Current Reports

Small Multifamily Investment Trends Report Q4 2024

Small multifamily’s normalization pushed forward last quarter as the Federal Reserve made a long-awaited reduction to the target federal funds rate. Arbor’s Small Multifamily Investment Trends Report Q4 2024, developed in partnership with Chandan Economics, shows signs of stability have multiplied. Robust rental demand, a limited supply of quality affordable housing, and several other promising developments should support the subsector’s strength heading into 2025.

Analysis

Top U.S. Multifamily Rent Growth Markets — Q3 2024

The U.S. multifamily market held steady in a more normalized cycle during the third quarter of 2024. Rental demand remained strong, while new leaders emerged among the top markets for rent growth.

Articles

Top Markets for Wage Growth in 2024

One of the most essential factors multifamily investors need to consider before executing a transaction is the health of the local labor market. Wage growth and other trends are driven by a delicate, constantly adjusting balance of labor supply and demand. In some markets, an inflow of employers can cause wages to spike. In others, population outflows can create the same effect. In this deep dive, we expand on the data findings from the 2024 Top Markets for Multifamily Investment Report, exploring the unique conditions driving metro wage growth trends.

Press Contact

Press Contact If you are a member of the media and would like to arrange an interview with one of our knowledgeable multifamily and commercial real estate finance executives or if you have general media questions about Arbor, please contact us at [email protected] or through the below form.   Fill out the form to reach our press team.  

Current Reports

Top Markets for Multifamily Investment Report 2024

With interest rate pressure easing, quality multifamily investment opportunities have emerged from coast to coast, making identifying the optimal location essential. A roadmap for investors, Top Markets for Multifamily Investment Report 2024, developed in partnership with Chandan Economics, ranks the top 50 metropolitan markets found through an analysis of 10 key factors, including affordability, population growth, and climate risk.

General: 800.ARBOR.10

Affordable
Housing
Trends Report
Fall 2021

About This Report

Arbor Realty Trust and Chandan Economics’ newest joint report series, Affordable Housing Trends Report, focuses on a critically important segment of the multifamily residential market in the United States: affordable housing. The affordable housing market is a complex but vital part of the housing industry that is increasingly receiving attention from the public and private sectors.

This report series will provide proprietary research and analysis that connects the many disparate data points into a single source for multifamily investors, owners, developers and other industry stakeholders. Our aim is to provide a better understanding of the many facets of affordable housing and the major trends shaping the market.

Published semiannually, this report will mainly focus on Affordable housing supported by government subsidies or tax incentives like the Low-Income Housing Tax Credit (LIHTC), as well as the Naturally Occurring Affordable Housing (NOAH) segment. It will address some of the significant changes we’re seeing both in terms of policy decisions and market dynamics and describe some of the opportunities for investment and financing in the space.

Affordable Housing Garners Greater Attention in Post-Pandemic Environment

Key Findings

  • The pandemic’s economic effects, combined with this year’s surging rent prices, have strained low-income renters, placing housing affordability back in the spotlight.
  • Reduced business income due to the pandemic and related downturn may decrease the value of tax credits and require Affordable developers to seek alternative financing sources.
  • The share of LIHTC mortgages utilizing the 4% tax credit remained elevated at 40% through second-quarter 2021, reflecting the continued attractiveness of rehabbing versus ground-up development.
  • The Housing Choice Voucher program, another major Affordable housing initiative, is set to be expanded in the proposed 2022 federal budget by $3.5 billion – a 13.3% increase from fiscal year 2021.

State of the Market

Taking the brunt of both long-dated structural and pandemic-related headwinds, housing affordability finds itself at a uniquely challenging crossroads. At the same time, never has the national conversation, the enthusiasm of the commercial real estate sector and the commitment of the federal government ever been so aligned when it comes to addressing the nation’s affordable housing gap.

The National Low Income Housing Coalition estimates that the U.S. has a shortage of 6.8 million affordable rental homes. Further, the share of U.S. renter households that pay more than 30% of Area Median Income (AMI) on rent – a threshold the federal government uses to define whether or not a unit is affordable – sits at a concerning 42.7%.


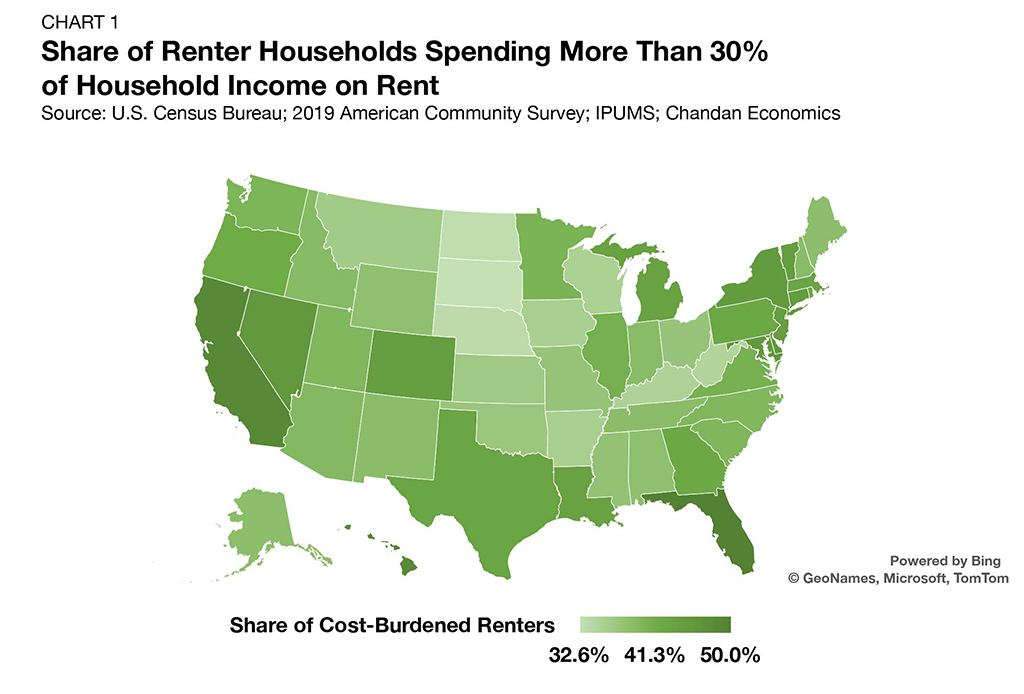
States with large populations like Florida and California are particularly rent burdened, with the share of households spending nearly one-third or more of their income on rent totaling 50.0% and 48.4%, respectively, according to the latest American Community Survey (Chart 1).

The troublesome picture of national rental affordability comes after a decade-long stretch between 2011 and 2020 when average annual rent growth topped average hourly earnings growth.1 While the pandemic did temporarily reduce rent prices nationally, it did not result in a permanent reset of rent levels. Rental housing costs are soaring in 2021, with asking rents growing 10.3% from a year earlier through August, according to RealPage.


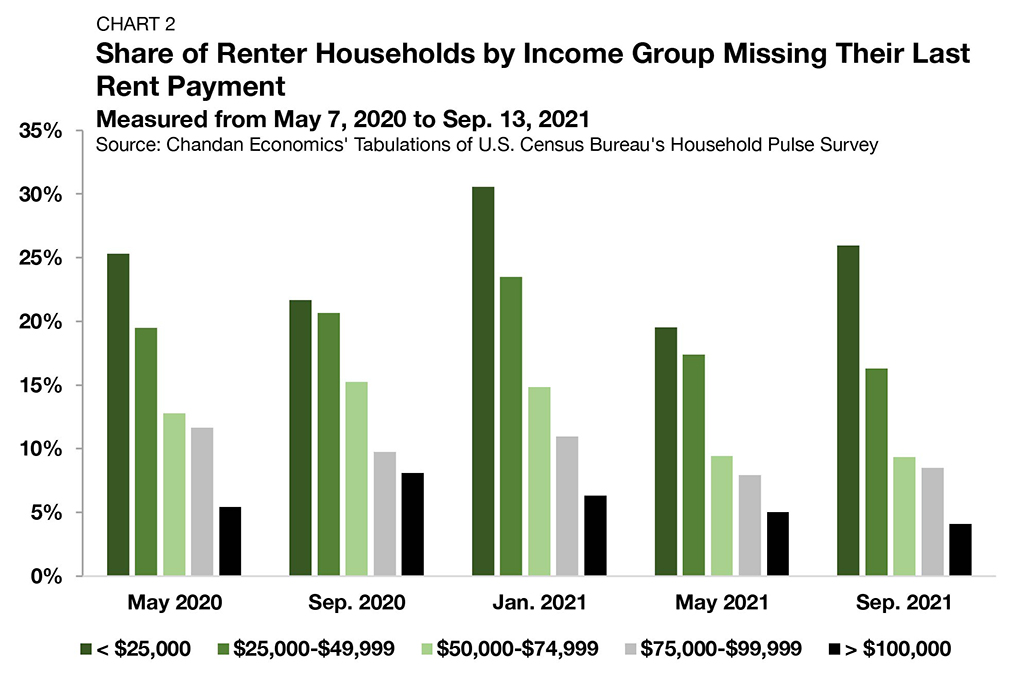
Further exacerbating the affordability crisis, the shutdown’s labor market impacts, both in terms of total employment loss severity and pace of recovery, have asymmetrically affected low-income workers. Due to loss of employment and wages, many low-income households could not make their rent payments. A Chandan Economics analysis of the Census Bureau’s Household Pulse Survey indicated that low-income renters consistently had lower rent payment rates than moderate- and high-income renters throughout the pandemic (Chart 2).2  The recent end of the eviction moratoria adds another layer of pressure to low-income renters as it may present additional negative impacts on this renter population.

1 Based on Chandan Economics Analysis comparing the average hourly earnings wage growth of private sector workers and the Bureau of Labor Statistics (BLS) Consumer Price Index for rent of primary residence.

2 Data are from weeks 2, 14, 22, 30, and 37 of the U.S. Census Bureau’s Household Pulse Survey.

Low-Income Housing Tax Credit

The single-largest Affordable housing program that directly addresses supply is the low-income housing tax credit (LIHTC). LIHTCs come in two forms: a 9% tax credit to incentivize new Affordable development and a 4% tax credit for the rehabilitation and preservation of Affordable supply. According to the National Housing Preservation Database, LIHTCs collectively support roughly 2.5 million rental units.


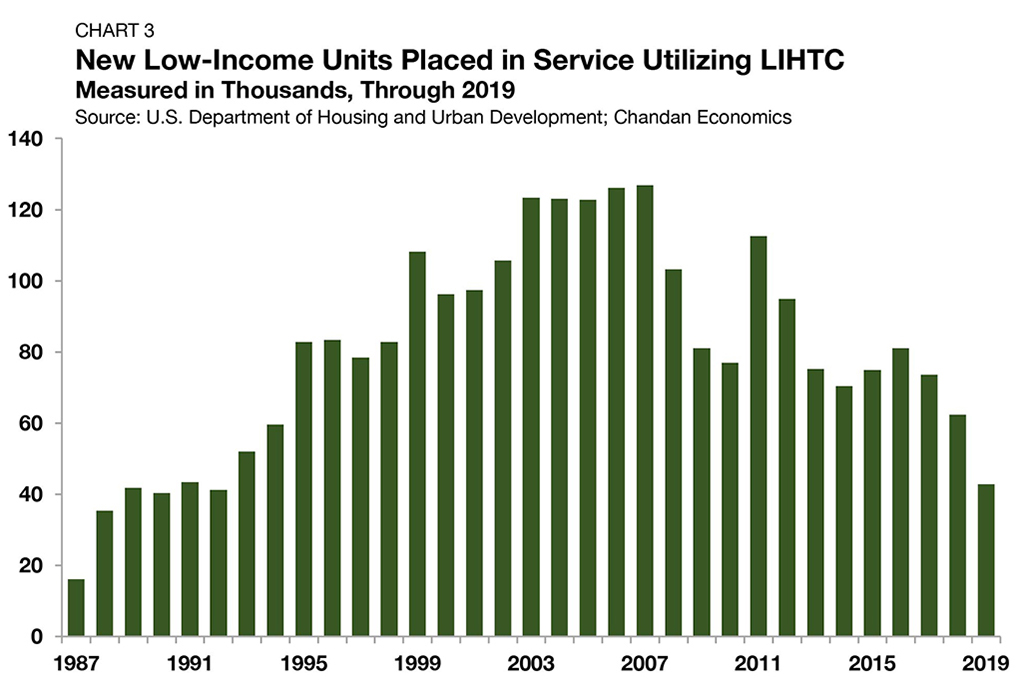
The number of new low-income units placed into service under the program topped out at 126,796 in 2007. Since then, the number of new units placed into service fell in nine of the next 12 years, gradually sliding to 42,895 through 2019 — a 66% drop-off from its peak (Chart 3).

The decade-long slowdown of new LIHTC unit additions comes as changes in the tax code and other forces have reduced some of the incentive for adding new affordable units. Naturally, the implied value of the tax credit is more valuable in a high-tax environment, meaning that when corporate tax rates were reduced following the 2016 election and subsequent passing of the 2017 Tax Cuts and Jobs Act, a LIHTC lost some of its attraction.


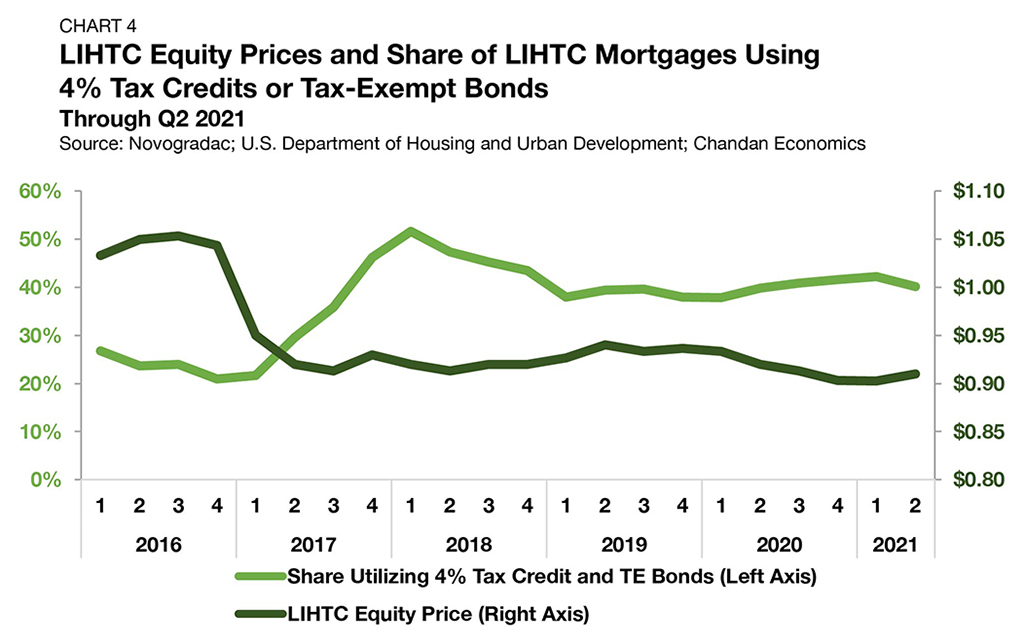
The LIHTC equity price per credit dropped from $1.04 to $0.95 from fourth-quarter 2016 to first-quarter 2017, as investors anticipated and eventually received a decrease in tax liabilities (Chart 4).3 Since then, the quarterly average for LIHTC equity prices has remained between $0.91 and $0.94, according to Chandan Economics’ analysis of Novogradac’s LIHTC Equity Pricing Trends data.

3 LIHTC Equity Pricing Trends are calculated as a quarterly series by Chandan Economics. The 4% LIHTC usage is displayed as a four-quarter moving average. Novogradac data are reported through May 2021.

As a result of the price drop, LIHTC syndicators and affordable housing developers re-structured transactions to maintain economic yields for investors and to promote continued liquidity in the space. Additionally, the more recent run-up in acquisition, construction and renovation costs has made formerly feasible transactions more challenging and reduced the number of units a tax credit allocation could support.


The drop in LIHTC equity prices also meant that Affordable developers faced more competition for the 9% LIHTC, pushing them toward the 4% LIHTC. At the same time, the GSEs expanded their platforms to allow for greater use of debt private placements, leading to further expansion of 4% bond executions.


Between the first quarter of 2017 and the first quarter of 2018, the share of new mortgages on LIHTC properties utilizing the 4% tax credit surged from 22% to 52%. The tax credit became more attractive after the December 2020 passage of the Consolidated Appropriations and Recovery Act, which established a minimum credit floor. Through second-quarter 2021, the share of LIHTC mortgages utilizing the tax credit remained elevated at 40%.


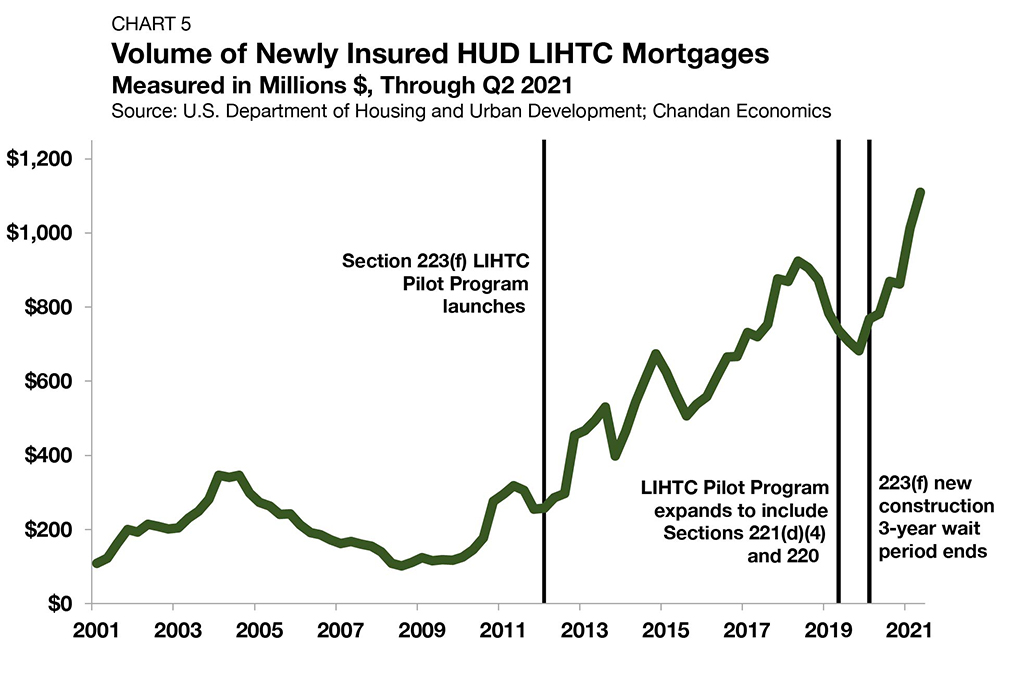
Despite the slowdown in new units placed in service utilizing LIHTC, the dollar volume of newly issued LIHTC mortgages covered under insurance from the U.S. Department of Housing and Urban Development (HUD) has been accelerating. According to a Chandan Economics analysis of HUD’s Insured Multifamily Mortgages Database, the dollar volume of newly HUD-insured LIHTC mortgages grew substantially post-Great Recession (Chart 5). The volume grew from a quarterly average of $254.7 million in 2011 to $862.0 billion in 2020, an impressive 14.5% compound annual growth rate.4

In addition to overall investor demand for Affordable housing and the growing liquidity in the sector, the increase in total mortgage volume has been driven, in part, by structural forces, namely HUD’s policy and procedures. HUD’s most substantial change was the launch of its LIHTC Pilot Program in 2012. The Pilot Program initially allowed for greater per-unit rehabilitation costs under Section 223(f) and streamlined mortgage application requirements, resulting in quicker approval timelines.


From 2012 to 2018, HUD’s loan volume of LIHTC transactions increased from 5% to 34%, according to Novogradac. Updates to the program in 2019 included allowing substantial rehabilitation and new construction (9% LIHTC) under the 221(d)(4) and 220 loan programs. These changes made a majority of LIHTC transactions eligible for HUD-insured mortgage financing.

4 Data presented in Chart 5 are displayed as a four-quarter moving average based on date of initial endorsement.

Housing Choice Voucher Program

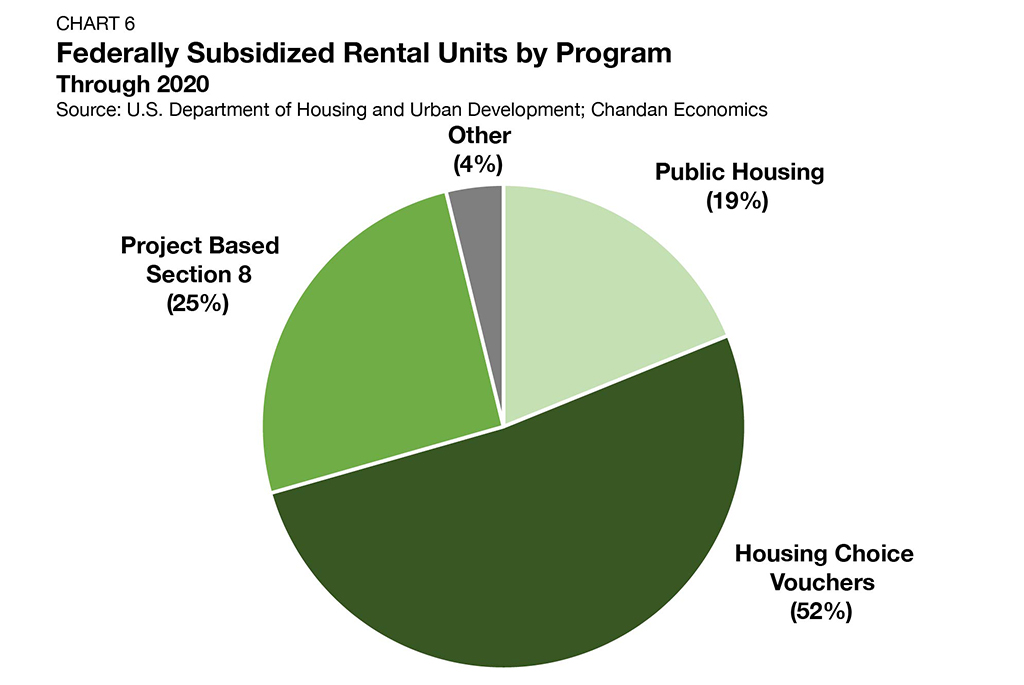
While LIHTC is the largest supply-side affordable housing program, the Housing Choice Voucher (HCV) program is the largest overall, accounting for 2.6 million units.5 As a share of all federally subsidized rental units, the HCV Program accounted for 51.7% through the end of 2020 (Chart 6). The next largest program by unit count, Project Based Section 8, is a distant second, accounting for 25.6% of federally subsidized units. The HCV program is primarily a form of tenant-based rental assistance, where renter families spend 30% of monthly adjusted income on rent, and the balance is covered through subsidy. The policy focus of the HCV program is on very low-income households. Additionally, a renter household retains their HCV subsidy should they choose to move, encouraging positive housing mobility.
5 Total is based on data retrieved from HUD’s Office of Policy Development and Research.
The HCV program remains the behemoth of the federally subsidized rental universe, but a meaningful expansion of the program has not materialized in recent years. Between 2015 and 2020, the number of units covered under the program expanded annually between 0% and 2% each year. Still, there is some hope on the horizon. The current federal budget bill would expand HUD’s annual budget by $6.8 billion, including an additional 13.3% increase for the HCV program ($3.5 billion) — a step up that would cover an additional 125,000 low-income households.

Naturally Occurring Affordable Housing

Most of the attention paid to the affordable housing sector tends to focus on regulation and policy intervention, but the Naturally Occurring Affordable Housing (NOAH) supply is proportionally more significant. A recent McKinsey deep-dive into NOAH concluded that the sector is “not well defined, tracked, or understood.”


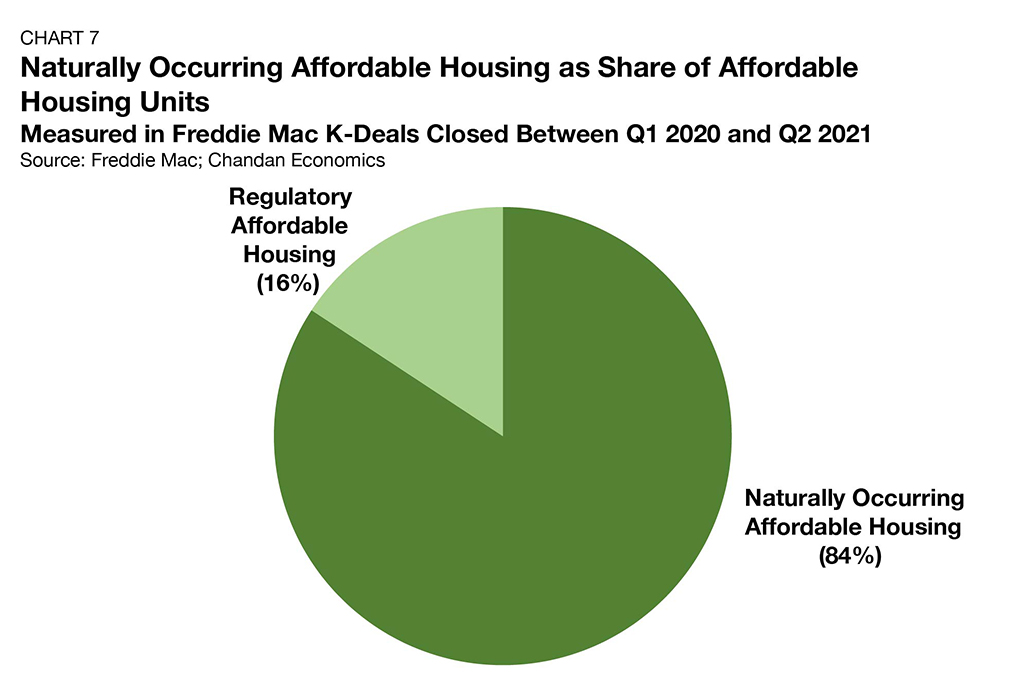
According to a Chandan Economics analysis of Freddie Mac multifamily loans originated since the beginning of 2020, 84% of the units captured in the sample that are affordable at 80% or below of local AMI are NOAH properties (Chart 7).6 These data fall generally in line with previous estimates that suggest NOAH is responsible for about three-quarters of all affordable supply.

6 The surge in refinancing activity during the pandemic may have increased the share of NOAH properties in the sample. The naturally occurring share has decreased in the two most recent quarters of data as refinancing activity has resettled back to a normal level, averaging 75.7% in second-quarter 2021.

On average, NOAH properties tend to support higher rents than the Affordable housing sector, though the difference is slight. On second-quarter 2021 closed Freddie Mac loans, the median rent in NOAH properties was $1,154 — just 4.0% higher than the $1,114 in properties with rental subsidies, per the Chandan Economics analysis.


NOAH properties represent a critical cornerstone of the total U.S. affordable housing supply. Yet, because these NOAH properties lack formal agreements or an incentive structure to keep their units affordable, they are the most susceptible to rent increases that would price out low-income renters.


Generally, policy makers have paid more attention to addressing the affordable housing needs of the most severely cost-burdened renters. However, any actions taken to address affordable housing in a meaningful way must consider this segment of the market.

What to Watch

Housing affordability will likely persist as the uneven COVID-19 recovery progresses. The employment recovery has not been as robust for those at the lowest ends of the wage spectrum and those that rely on affordable housing the most. Additionally, the impacts of lifting the eviction moratorium remain to be seen.


Regarding tax credits, there is growing concern that LIHTCs may see some erosion in value going forward. If business income remains down due to the pandemic and related downturn, the resulting smaller tax bills may mean less demand for the tax credits. With Affordable developers often trading their LIHTCs to finance the equity portion of their capital stack, there may be an increased need for state and local government incentives to make Affordable transactions viable.


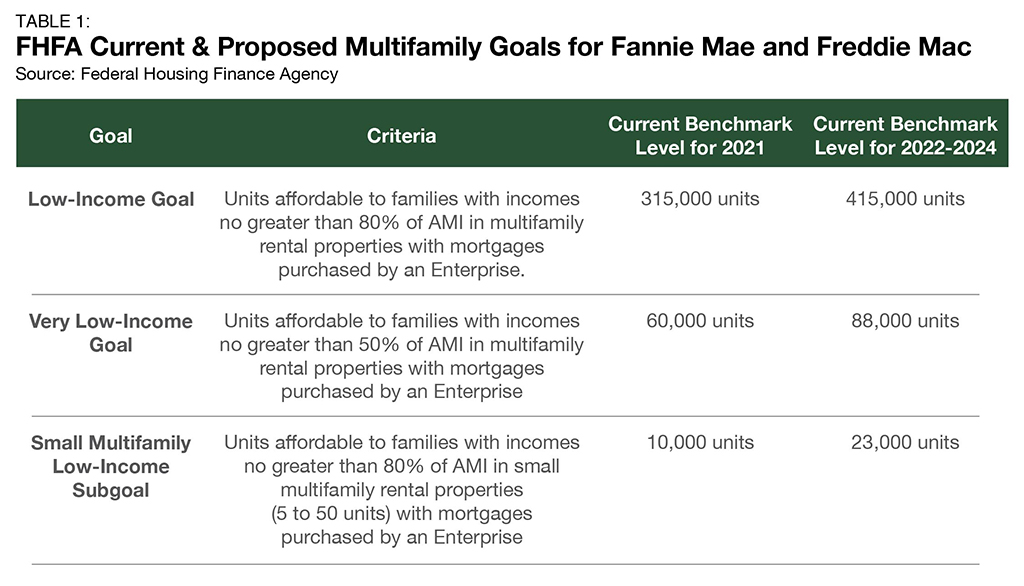
Still, some recent developments at the federal level could have a positive impact on preservation and creation of new affordable supply. The Federal Housing Finance Agency (FHFA) recently proposed substantially increasing its annual affordable housing goals for multifamily units between 2022 and 2024, which would provide a substantial boost to affordable housing development (Table 1).Further, as of Sept. 1, the FHFA announced that it is raising the annual lending caps for each GSE to invest in LIHTCs from $500 million to $850 million.

7 FHFA Proposed 2022-2024 Housing Goals for Fannie Mae and Freddie Mac, August 2021.

Additionally, the House of Representative’s proposed HUD budget expands affordability programs that influence renting for low- and middle-income earners. Expansion of Section 8 coverage should provide some relief to low-income renters and increased HOME Investment Program funding should encourage the development, acquisition and rehabilitation of more affordable housing units. The floor put under the 4% LIHTC should also incentivize developers to increase the supply of Affordable housing.


The expansion and modification of existing federal programs is a meaningful step in the right direction. Structural issues are deeply entrenched and adequately addressing the country’s perpetual undersupply of affordable housing will, undoubtably, take significant time. However, a growing conversation and an alignment of public and private ambition are supporting a more positive outlook for a sector where the reward for doing well can also be doing good.

For more affordable housing research and insights, visit arbor.com/blog

Disclaimer All content is provided herein “as is” and neither Arbor Realty Trust, Inc. or Chandan Economics, LLC (“the Companies”) nor their affiliated or related entities, nor any person involved in the creation, production and distribution of the content make any warranties, express or implied. The Companies do not make any representations regarding the reliability, usefulness, completeness, accuracy, currency nor represent that use of any information provided herein would not infringe on other third party rights. The Companies shall not be liable for any direct, indirect or consequential damages to the reader or a third party arising from the use of the information contained herein.