As the cost of living in the U.S. climbs, the shortage of affordable housing is a persistent challenge for many communities. While progress has been uneven to date, Arbor Realty Trust and Chandan Economics document federal and state initiatives aimed at creating positive change. In a sector known for its strength, stability, and consistency, new and old affordable housing opportunities are converging as the nation accelerates construction.
Single-Family Rental Investment Trends Report Q1 2022
Cap rates hold steady as valuations accelerate into Spring 2022
Key Findings
- Annual rent growth for lease renewals reaches 7.8% — a new all-time high.
- Cap rates rise to 5.6% as cashflows strengthen.
- First-quarter SFR securitizations are up more than double from last year.
State of the Market
With wind in its sails, the single-family rental (SFR) sector continued to gain positive momentum in the first quarter of 2022. With the costs of homeownership rising alongside mortgage rates, SFR’s growing role as the new U.S. starter home continues to cement.
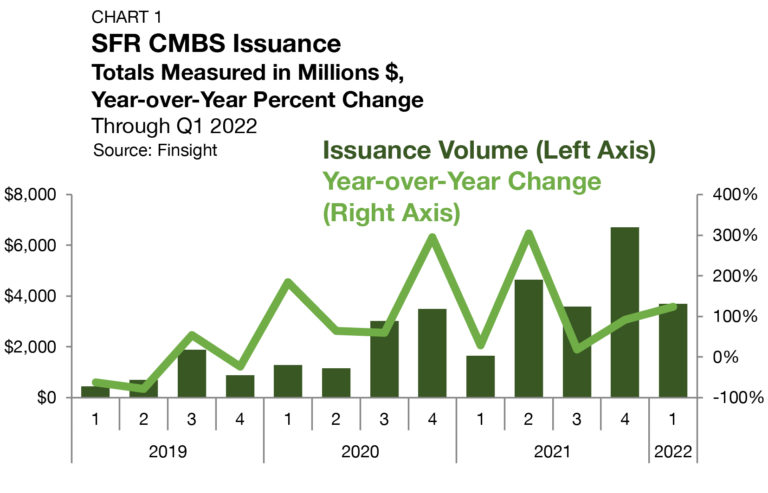
The sector’s decade-long trend of institutionalization has accelerated over the past year. According to John Burns Real Estate Consulting, more than $50 billion of institutional capital is currently moving through the SFR sector. In the CMBS market, SFR issuance reached a record $16.6 billion in 2021 — nearly doubling 2020’s total of $8.9 billion, according to Finsight. In the first quarter of 2022, SFR CMBS issuance reached $3.7 billion, rising 124% above the total observed in the first quarter of 2021 (Chart 1).
Performance Metrics
Originations
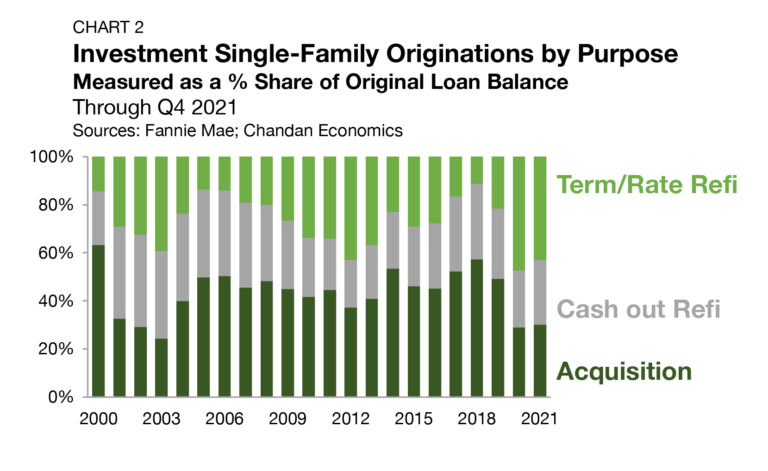
According to a Chandan Economics analysis of Fannie Mae data, a lending source for mostly non-institutional borrowers, refinancing, instead of acquiring, has accounted for the significant majority of recent originations to single-family investors. In 2020, refinancing activity accounted for 71.0% of tracked originations (Chart 2). In 2021, the refinancing share dropped slightly to 69.9%. While the change from 2020 to 2021 was marginal, on a quarter-to-quarter basis, the shifts were anything but. The refinancing share of lending activity declined every quarter throughout the year, reaching a high of 77.7% in the first quarter and sinking all the way to 60.1% in the fourth. Notably, term/rate refinancings declined by 4.4 percentage points in 2021, and 26.8 percentage points between the first and fourth quarters — a sign that investors were locking into low-interest rates early last year ahead of the Federal Reserve’s
Occupancy
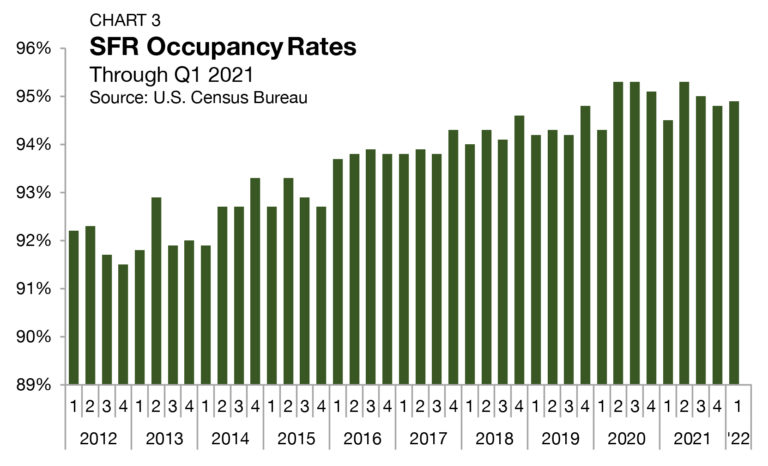
As measured by the U.S. Census Bureau, occupancy rates across all SFRs averaged 94.9% in the first quarter of 2022, rising by 10 basis points (bps) from the fourth quarter of 2021 (Chart 3). The first-quarter reading brings the SFR occupancy rate within 40 bps of its generational high — indicating that the sector is operating at or near full potential occupancy.
Rent Growth
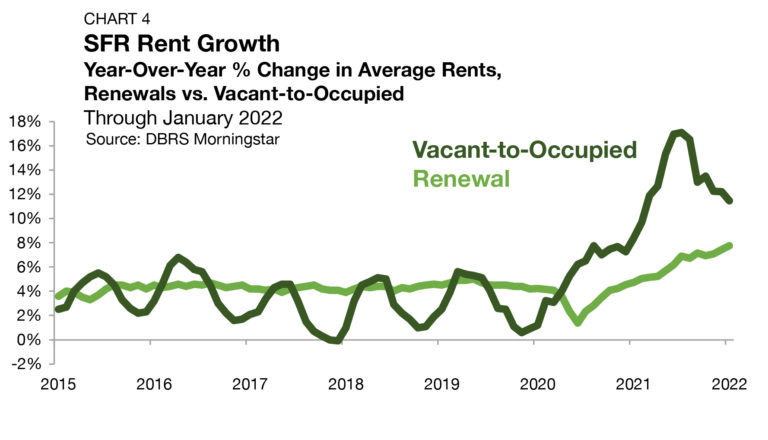
Single-family rent growth remained robust entering 2022, even as the pace of increase on newly signed leases has started to slow. According to DBRS Morningstar, vacant-to-occupied (V2O) annual rent growth accelerated to an unprecedented high of 17.1% in July 2021 in what can be best described as a recalibration of market pricing (Chart 4). Since then, V2O rent growth slowed in five of six months, reaching 11.5% in the latest reading. Even as momentum has slowed, the current pace of rent increases remains well above the pre-pandemic pattern. Between 2015 and 2019, V2O rent growth averaged 3.3% — a baseline that the January 2022 data point outperforms by a weighty 816 bps.
For lease renewals, annual rent growth hit another all-time high in January 2022, reaching 7.8%. Between 2015 and 2019, SFR renewal rent growth consistently ranged between 3.3% and 5.0%. Since February 2021, SFR renewal rent growth has topped the 5.0% mark in 12 consecutive months of observations.
Surging lease renewal rent growth is best categorized as a market response to the growth in V2O prices. When setting rents for existing tenants, many landlords will consider three primary, interconnected criteria:
- What the unit could rent for on the open market
- Probability of tenant renewal
- Anticipated length of vacancy if a tenant does not renew
When a landlord identifies a unit to be underpriced and perceives that it will be rented again quickly in the event of a vacancy, they are more likely to pursue a sizable rent increase on the next lease. With V2O rent growth topping renewal rent growth for 22 consecutive months, lease-over-lease rents should be expected to accelerate over the short term as prices re-establish an equilibrium.
Analyzing rent growth at the market level, unsurprisingly, the Sun Belt has maintained its dominance. According to CoreLogic’s Single-Family Rent Index (SFRI), annual rent growth across the top 20 U.S. metros through February was highest in Miami, Orlando, and Phoenix, climbing by 39.5%, 22.2%, and 18.9%, respectively. All of the tracked Sun Belt metros saw rent growth totals above 10.1% in the year ending February 2022.
Cap Rates
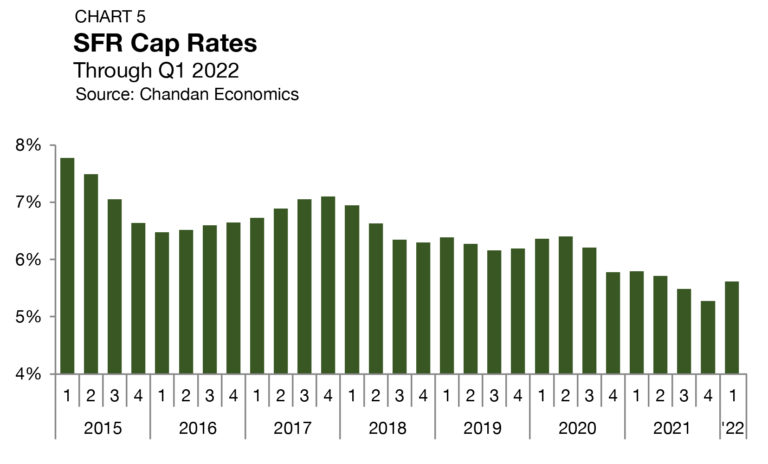
Property-level yields for SFR assets ticked up in the first quarter of 2022, rising by 34 basis points to settle at 5.6% (Chart 5).1 The first-quarter observation marks the first time that SFR cap rates have risen since the onset of the COVID-19 recession.
While growing cap rates may concern operators, the reason why yields are rising carries much greater importance. The first-quarter rise is attributable to strengthening net operating incomes achieved through higher rents— not a devaluation of assets. Historically, single-family rent growth has lagged inflation by several months. Rent rolls, which take a full year to reset, are currently still adjusting to the bull-run of home prices experienced in 2021. This lagged adjustment is creating an anticipated catch-up period where property incomes are rising more quickly than valuations, causing upward pressure on cap rates.
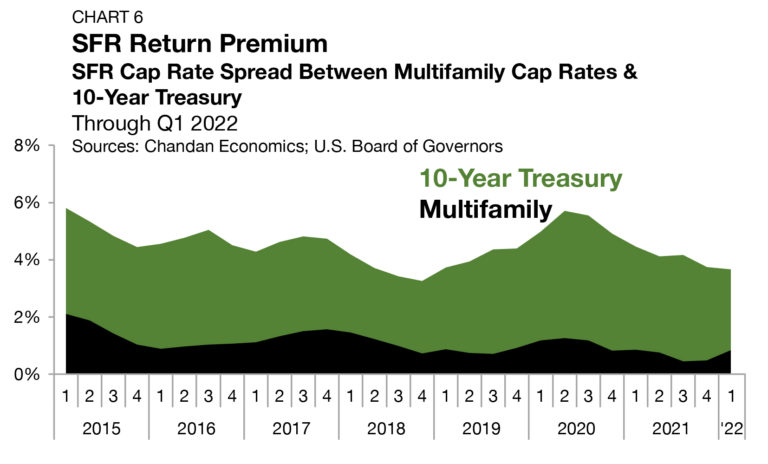
The yield spread between SFR cap rates and the 10-year Treasury estimates the SFR risk premium. Despite growing SFR yields in the first quarter of 2022, this risk spread narrowed as the yield on Treasurys rose by a more significant 42 bps. In total, the risk premium sank 8 bps from the previous quarter to land at 3.7% — the lowest level since late 2018. Moreover, the risk premium is down by a weighty 70 bps from one year ago (Chart 6).
Pricing
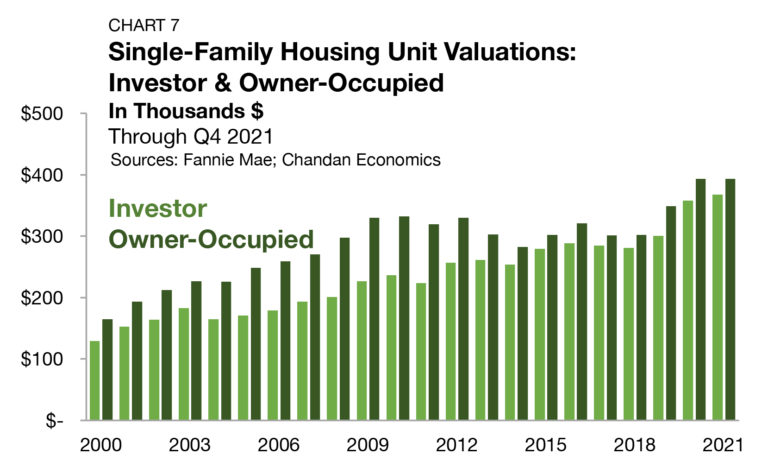
According to a Chandan Economics analysis of Fannie Mae securitized mortgages, there are material differences between the average assessed property values on mortgages originated to single-family owner-occupants versus single-family investors. The average underwritten value of a single-family investment property in 2021 averaged $367,926 compared to $405,844 for owner-occupied units (Chart 7).
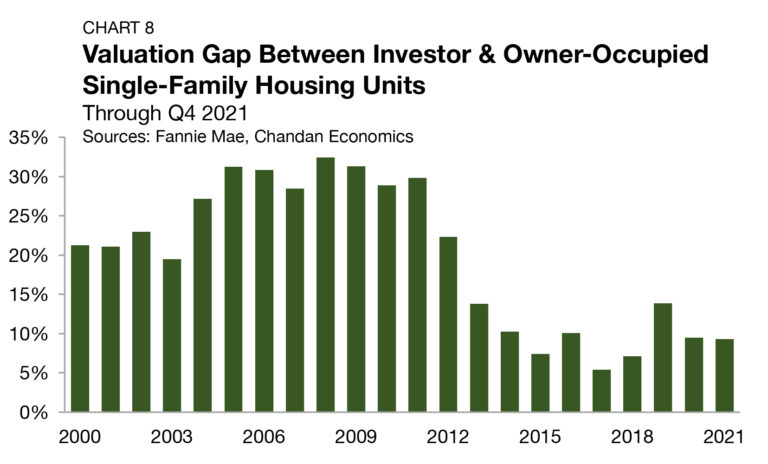
Several likely factors contribute to this valuation gap, one being that many investors are targeting value-add assets rather than paying top dollar for value that already exists. Additionally, investor-owned SFR properties have vacancy, turnover, and management-related expenses that owner-occupied units do not have to account for, contributing to lower values for the rental units. Nevertheless, the gap has narrowed dramatically over the past decade.
Between 2004 and 2011, the valuation gap sat in a consistent range of 27.2% to 32.5% (Chart 8). As more investors and capital entered the SFR space, discounted investment units became harder to find and competition for inventory ramped up. The valuation gap fell to an all-time low of 5.4% in 2017 before moderating in the years since. In 2021, the average valuation gap averaged 9.3% — a marginal 16 bps decrease from the 2020 average.
Supply & Demand Conditions
Residential Default Rates
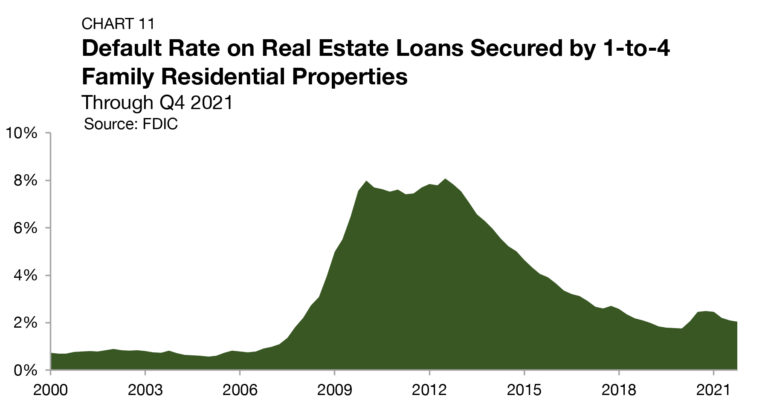
During the 2008 housing crisis, investors with available financing took advantage of the market dislocation, acquiring large portfolios of single-family assets at steep discounts. According to the Federal Deposit Insurance Corporation (FDIC), mortgage default rates peaked at 8.1% in 2012, leading to an abundance of distressed sales and the beginning of the SFR sector as we know it today (Chart 11).
Build-to-Rent
Purpose-built SFR properties, known as build-to-rent (BTR) communities, continue to become a defining feature of the SFR sector, especially within the institutional slice of the market.
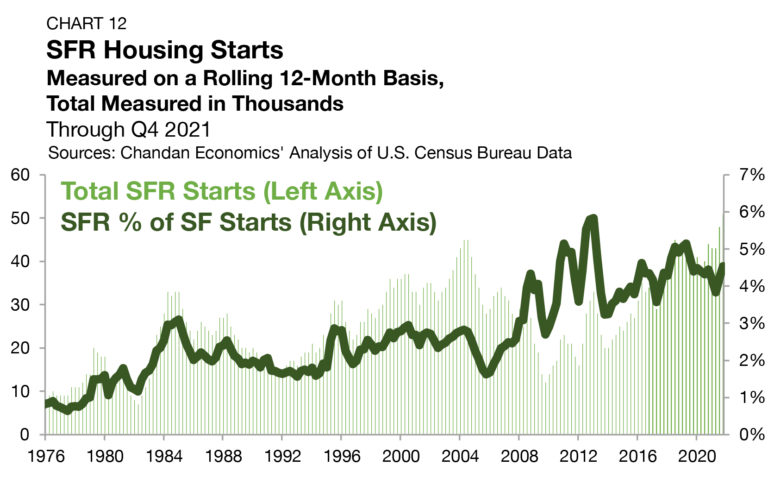
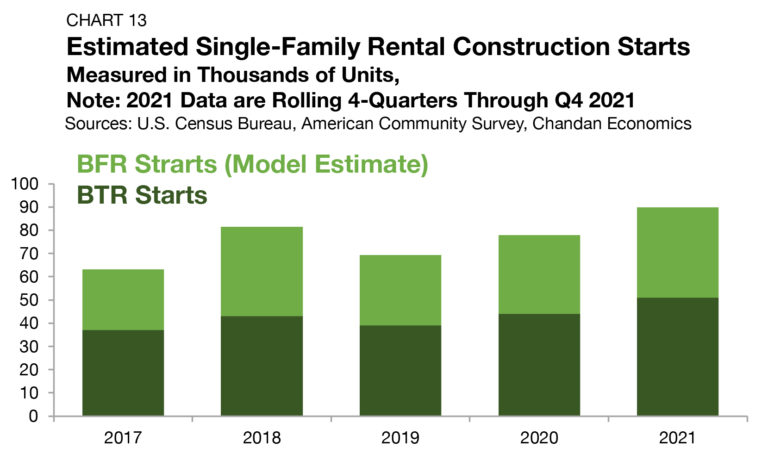
Based on an analysis of Census Bureau data, between 1975 and the start of the prior recession in 2007, BTRs accounted for a little less than 2.0% of all single-family construction starts (Chart 12). In 2013, BTR’s percentage share of construction starts reached an all-time high of 5.8%, and through the fourth quarter of 2021, the share remained elevated at 4.5%. BTR construction starts totaled 51,000 units through the end of 2021, a 15.9% growth rate from a year earlier and a new all-time high. While these construction totals represent significant market growth, they are also like to be understated.
Tracking Demand
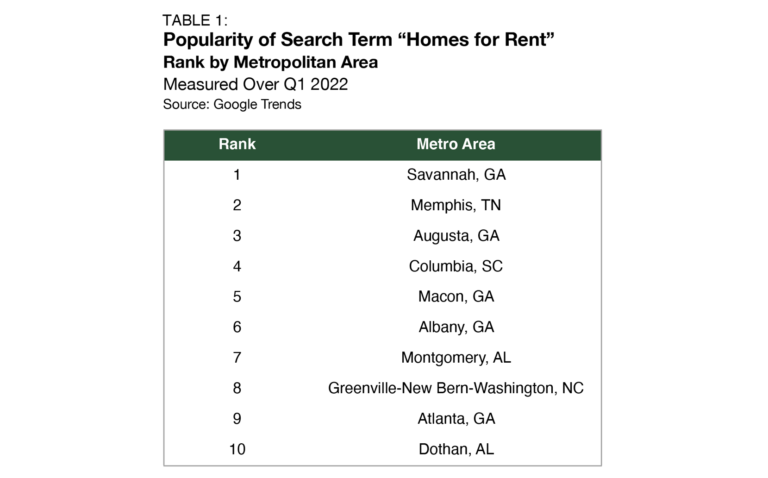
Utilizing Google Trends, the popularity of the search term “homes for rent” can be leveraged as a proxy for hotspots of SFR demand. Savannah, GA, was the most popular area where the term was searched during the first quarter of 2022, dethroning another Georgia metro, Macon, which had seen the highest search frequency in the previous period (Table 1).
Outlook
For more single-family rental research and insights, visit arbor.com/blog


