When apartment investors consider locations for capital deployment, growth potential is a top-of-mind concern. On a local level, population changes can influence everything from rent growth to occupancy to future property values. County-level positive net migration and natural population growth trends, identified in an analysis of U.S. Census Bureau data, reveal the counties where demographic tailwinds make a compelling case for real estate investment.

2021 Top Markets for Large Multifamily Investment Report
Table of Contents
Overview | The Arbor-Chandan Large Multifamily Opportunity Matrix | Top Ranked Markets | Work From Home Resiliency | COVID-19 Risk Assessment | Large Multifamily Investment | Market Spotlight: Las Vegas | Outlook | Appendix
Overview
The U.S. economy continued its path back to health through the third quarter of 2021. As of the second-quarter estimate of annualized real gross domestic product (GDP), the economy is now 0.9% larger than it was before the onset of the pandemic. The multifamily sector has weathered the storm exceedingly well and is accelerating into the recovery. According to the Real Capital Analytics Commercial Property Price Index for apartment properties, asset valuations are up 14.7% from one year ago, measured through August.
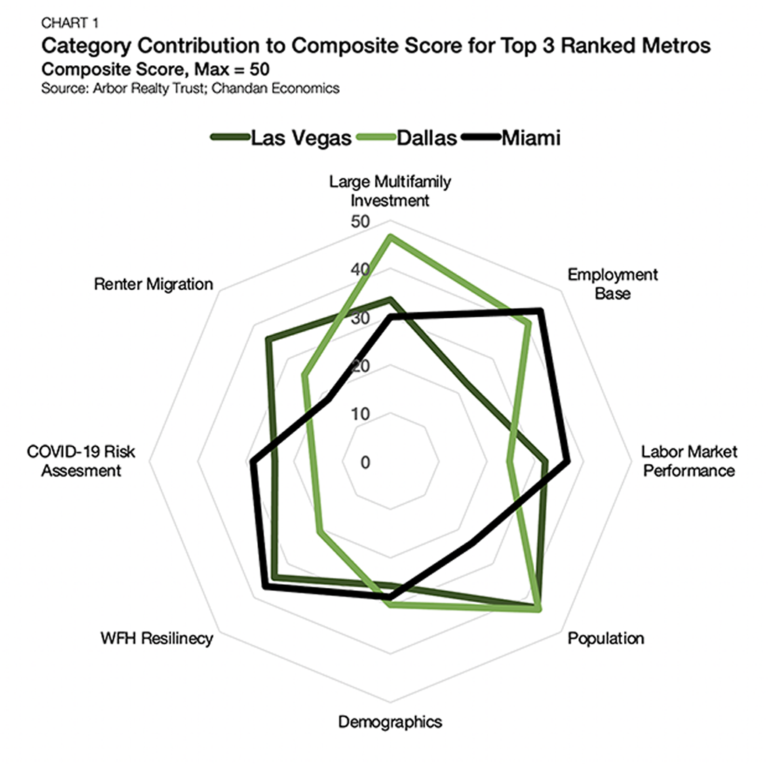
In this report, the research teams at Arbor Realty Trust and Chandan Economics present an analytical framework to develop a cross-market comparison for large multifamily investment. The top 50 U.S. metros1 are ranked using the Arbor-Chandan Large Multifamily Opportunity Matrix based on a composite of performance metrics. It pays specific attention to how local economies have fared during the pandemic and how well multifamily investment activity has held up. Overall, the Matrix finds Sun Belt markets remain well-positioned for the year ahead, with Las Vegas, Dallas and Miami leading the way.
1 The top 50 metros are based on population estimates. All metros are reported at the Metropolitan Statical Area (MSA) level.Key Findings
- Work from home (WFH) resiliency and a recovering tourism industry propelled Las Vegas to the top of the 2021 Arbor-Chandan Large Multifamily Opportunity Matrix.
- Four metros in Florida jumped significantly in the Matrix rankings, reflecting the state’s continued strong labor market performance despite pandemic disruptions.
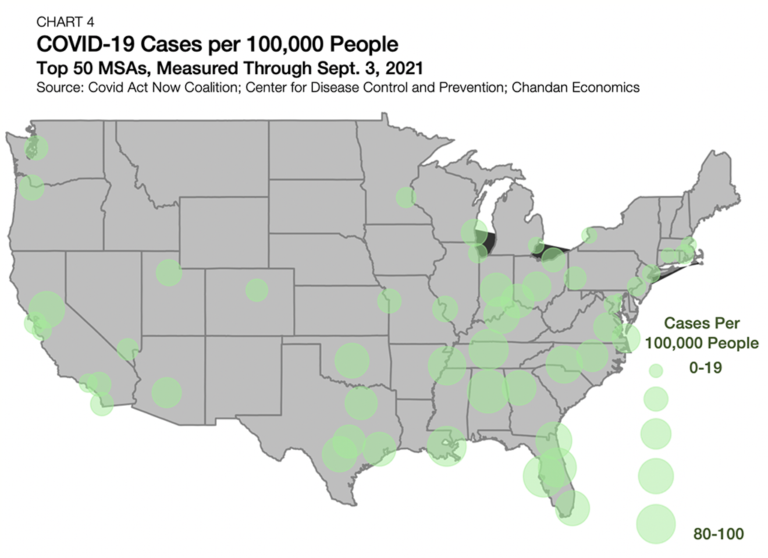
- As a region, the Sun Belt generally ranked well across the Matrix factors measured, despite experiencing higher COVID-19 case counts per capita.
The Arbor-Chandan Large Multifamily Opportunity Matrix
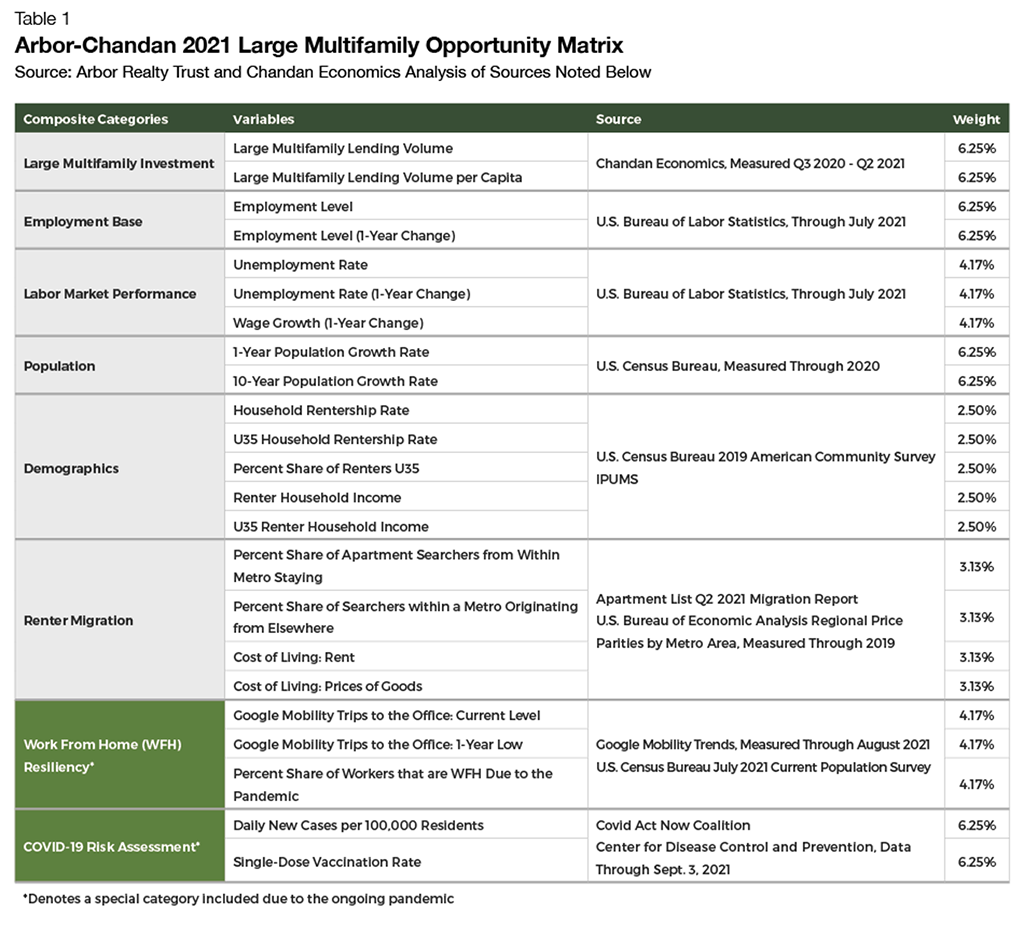
The 2021 Arbor-Chandan Large Multifamily Opportunity Matrix measures eight key categories:
- Levels of Large Multifamily Investment: debt financing availability within a market and a market’s ability to support additional multifamily investment
- Employment Base: labor market size and growth
- Labor Market Performance: current labor market conditions amid the continued pandemic
- Population Growth: overall growth of a metro over the short and medium term
- Renter Demographics: spending power and age profile of existing renters (higher household incomes and younger householders assumed as conducive for higher levels of multifamily demand)
- Renter Migration: a market’s ability to retain existing renters and attract renters from elsewhere
- Work From Home (WFH) Resiliency: a market’s degree of WFH adoption
- COVID-19 Risk Assessment: the continued impact of the pandemic on a market

Top Ranked Markets
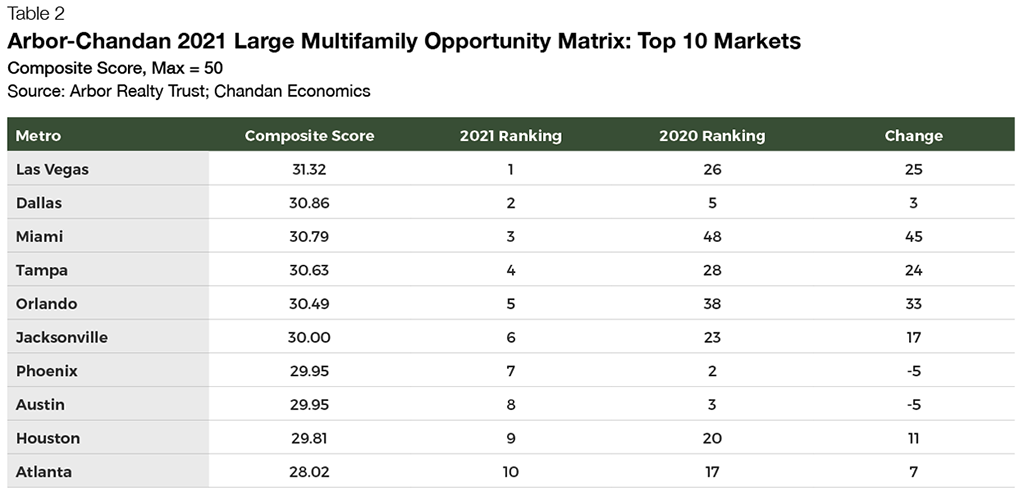
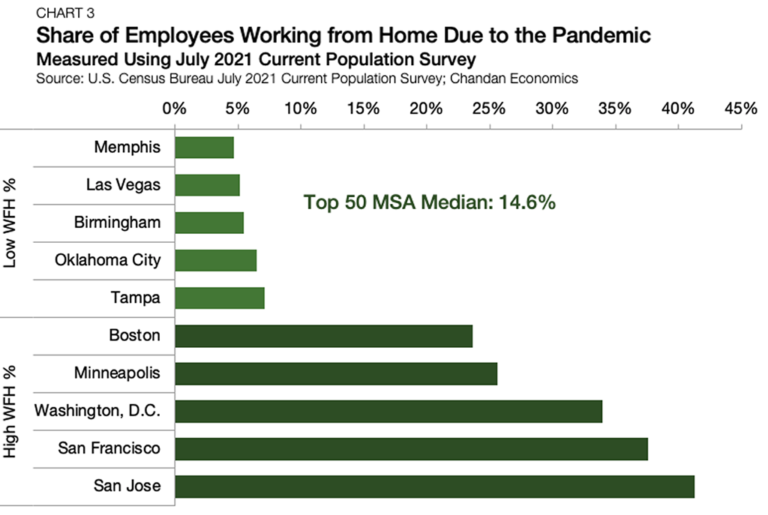
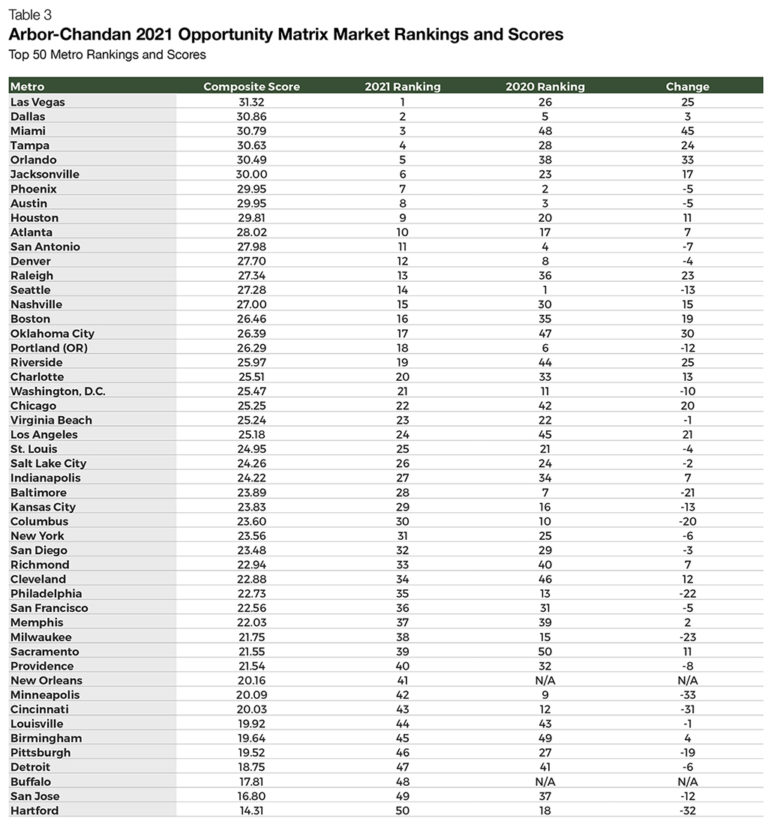
Rising to the top of the 2021 rankings is Las Vegas (Table 2). The metro leads the pack in several key criteria, including a favorable cost of living, a high share of apartment-searching renters looking to stay in the metro area and a resurgent labor market. The Las Vegas labor market appears to be one of the more WFH-resilient in the country, a partial function of its tourism-centric economy and a high share of workers employed in the leisure and hospitality sector. According to Chandan Economics’ analysis of the latest Current Population Survey, the Las Vegas metro had the second-lowest percentage of workers in the country that reported working remotely in the prior month due to the pandemic. For a full breakout of the 2021 and 2020 MSA composite scores and rankings, see Table 3 in the Appendix at the end of the report.

Work From Home Resiliency
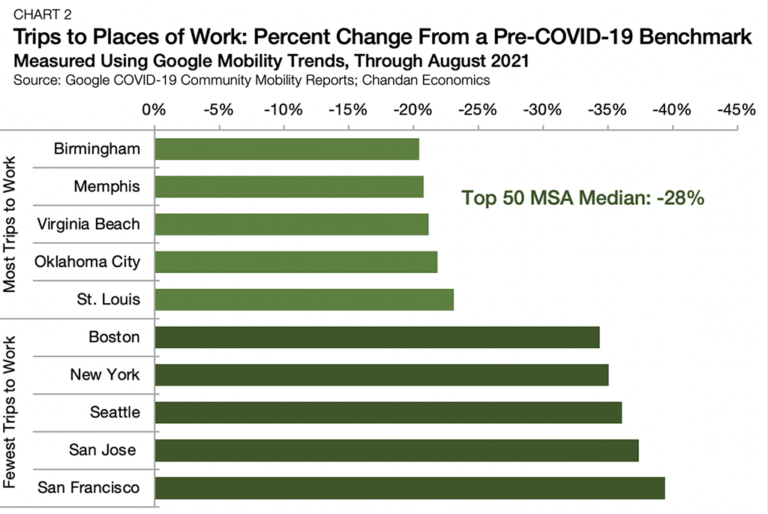
While the long-term impact of WFH adoption is presently unknown, it is a new factor that investors are paying attention to and will continue to watch. Multifamily properties near large central business districts (CBDs) tend to achieve their high rents and tenant demand due to their proximity to the CBDs. These assumptions follow a recent Fitch Ratings paper studying New York and the potential adverse long-term effects of a shift to WFH. The report notes the potential for negative downstream effects for all other commercial property sectors, government revenues and population migration trends.Measured across the three WFH resiliency variables in the Matrix, secondary Sun Belt metros, especially in the Southeast, are ahead. According to Google Mobility Data, compared to a pre-pandemic baseline, trips to the workplace in Birmingham are only down by 20% through August (Chart 2). Memphis and Virginia Beach follow closely behind, with trips to the workplace only down by 21% each. San Francisco and San Jose are at the other end of the spectrum, with trips to work down by 39% and 37%, respectively.

Large Multifamily Investment
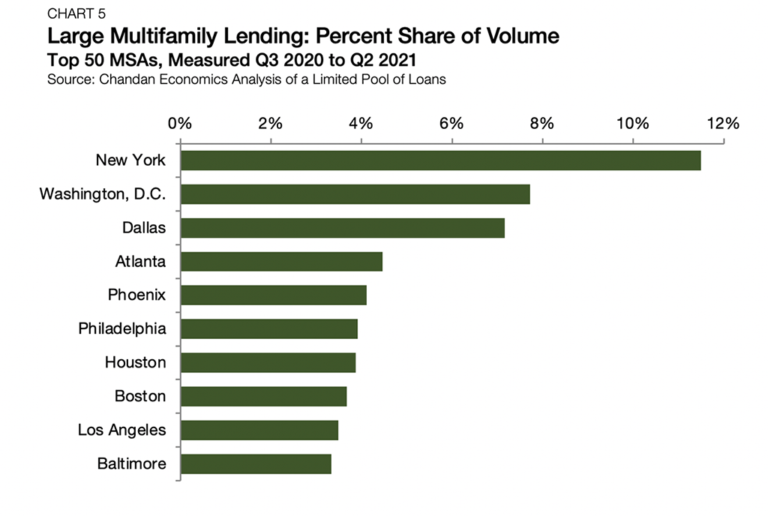
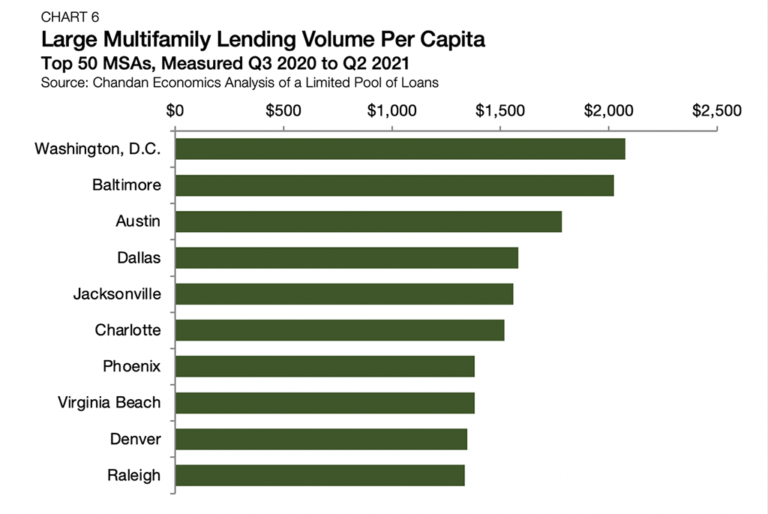
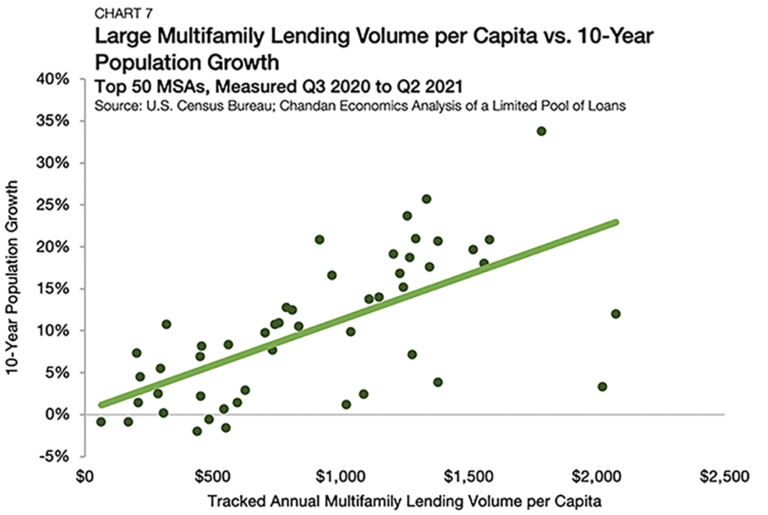
Large multifamily investment across U.S. markets is anything but uniform. Here, we analyze a limited pool of loans originated between the second half of 2020 and the first half of 2021, with original balances above $15 million and across the top 50 metros. Lending volumes include loans originated for both investment sales and refinancings. They are used here as a proxy for where market-level liquidity and total investment activity have held up amid the coronavirus turbulence. Leading the way and accounting for 11.5% of the sample’s total lending volume was New York, the country’s largest metropolitan area (Chart 5). The Big Apple’s overall size means it will always remain at or near the top of the multifamily investment list when measured in the aggregate. Although New York had a uniquely challenging and downtrodden year compared to its previous performance, it remains the most liquid market in the country. The next closest metro by tracked lending volume, Washington, D.C., accounted for 7.7% of the overall sample.


Market Spotlight: Las Vegas
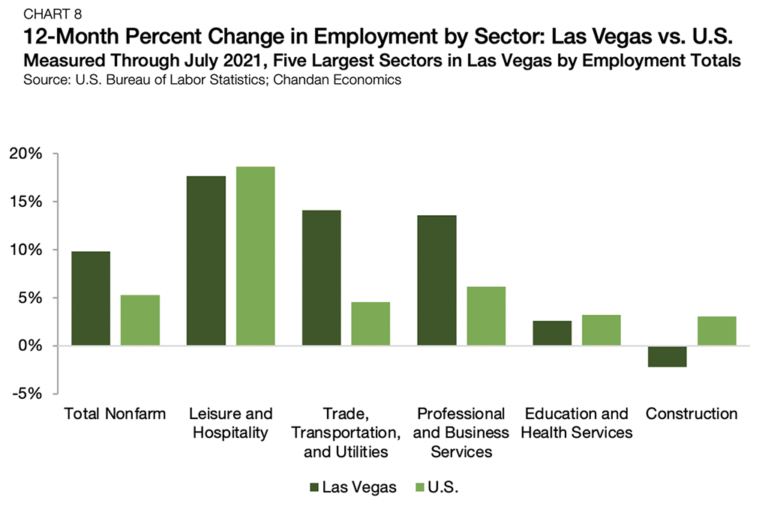
The Las Vegas metropolitan area hit the jackpot, rising to the top of the 2021 Matrix. The Las Vegas labor market and its post-shutdown bounce back are significant reasons for its nation-leading rank. Total nonfarm employment grew by 9.8% in Las Vegas over the year ending July 2021, significantly higher than the 5.3% observed nationally. The Las Vegas MSA’s largest employment sector, leisure and hospitality, bounced back over the year ending July 2021, posting annual job growth totals of 13.6%. While the leisure and hospitality sector grew slightly slower in Las Vegas than the sector’s national average (18.7%), leisure and hospitality accounts for a much larger share of Las Vegas employment totals (23.7%) than it does nationally (10.3%). In addition to leisure and hospitality, the trade, transportation and utilities sector, and the professional and business services sectors, each posted double-digit annual job growth, more than double the sectors’ national growth rates. The Las Vegas MSA notched the second-largest drop in its unemployment rate in the year ending July 2021, declining by 10.2%.
Outlook
The ongoing pandemic has dominated the market-level investment narrative since mid-2020. However, national and local economies have learned to cope with the pandemic more effectively and its impacts are less disruptive. Moving into 2022 and beyond, fundamentals of supply and demand along with traditional considerations of labor growth and productivity, residential affordability, and the attractiveness of markets to new businesses and residents, will take center stage. As a result, significant shifts in the Matrix should become less frequent. As employers call workers back to the office and commute times become relevant once again, the demand for apartments in coastal gateway markets will continue to recover. However, if WFH policies becoming permanent within companies, these markets would likely be negatively impacted. Coastal gateway markets’ gain, however, does not mean a reversal of the Sun Belt’s positive trajectory bolstered by the pandemic. Sun Belt markets will remain attractive and continue to grow due to their relative affordability and appeal to renters with the means and flexibility to relocate. However, the growth rate across these smaller markets will likely return to a more normal pace. Take the PDF with You arbor.com 833.842.1195Appendix