The U.S. multifamily market held steady in a more normalized cycle during the third quarter of 2024. Rental demand remained strong, while new leaders emerged among the top markets for rent growth.
Demographic and Migration
Demand Outweighs
Short-Term Risks
Key Findings
- Cap Rates Ticked Down to 6.5%
- SFR Return Premiums Narrowed to 5.9% Above Treasuries
- Occupancy Rates Held Steady at Multi-Decade Highs
State of the Market
The single-family rental (SFR) sector is having its moment. Before the pandemic, the millennial cohort’s maturation and the apparent extinction of the “starter home” were already supporting heightened SFR demand. When the full weight of COVID-19 hit in March, a robust debate about the ramifications for SFRs quickly followed.
Would tenant rent collections falter and property values decline, or would urban outmigration boost demand levels and outweigh the transitory concerns? With the benefit of hindsight, the latter offers a better explanation of current market conditions. Rent collections are reportedly holding in line with 2019 levels, occupancy rates have reached generational highs, and rent growth pressures for vacant-to-occupied units have firmed.
We analyze performance metrics, as well as supply and demand, and project the future outlook in an in-depth assessment of SFRs.
Occupancy
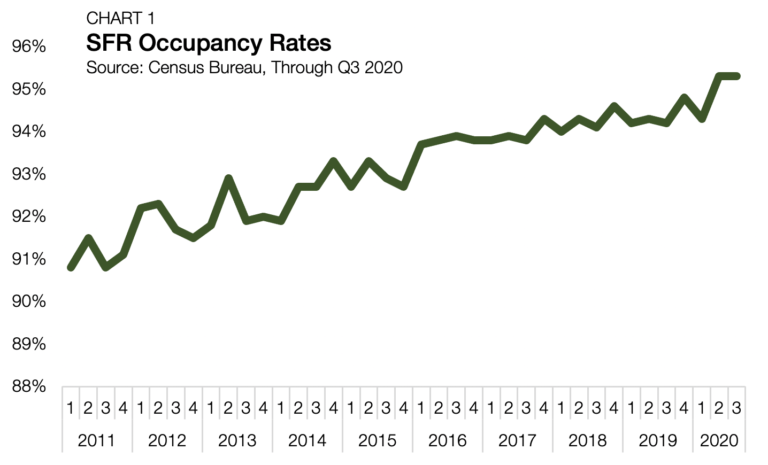
As measured by the Census Bureau, occupancy rates across all single-family rentals averaged 95.3% in the third quarter of 2020. They have held steady from the second quarter, following a 100 bps spike from the first quarter. The latest estimate matches the highest reading for the SFR market since 1994. From 2007 lows, occupancy rates for all SFR properties are up by 5.6% (Chart 1).
The data reflects both rising user demand and landlords prioritizing tenant retention. For comparable owner-occupied single-family housing units, occupancy rates sat at 99.1% in the third quarter — the second-highest reading on record, topped only by the immediately preceding quarter, measured at 99.2%.
The data supports anecdotal reports of single-family housing demand far outstripping available supply. For as long as the market equilibrium indicates product shortage, the balance of would-be owners unable to find affordable entry-level housing will have a high propensity to transition into SFRs.
Rent Growth
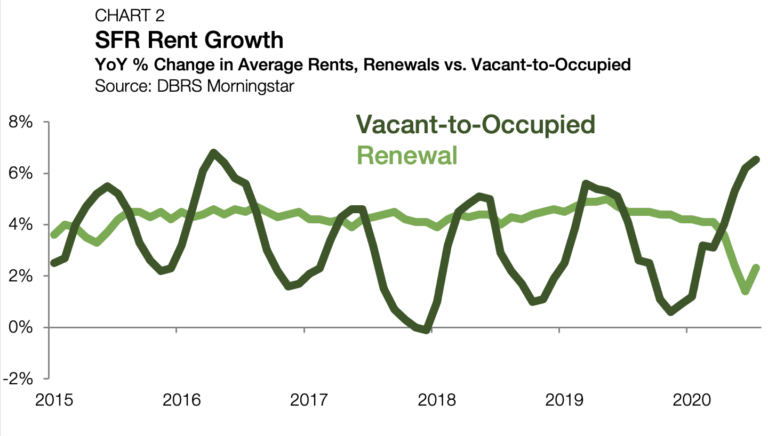
According to DBRS Morningstar, from June to July, SFR annual rent growth on lease renewals increased by 90 bps to 2.3% (Chart 2). For properties that have transitioned from vacant-to-occupied (V2O), yearly rent growth ticked up by 30 bps, landing at 6.5%.
The spread between rent growth on renewals and V2O units rose to 4.2% in the same month, just behind its June peak of 4.8%. Before April 2020, the spread between V2O and renewals had routinely tracked in negative territory and had never topped 2.2%.
Rent growth patterns for newly signed SFR leases have a high degree of seasonality. The pace of rent growth rises through the spring and peaks in the early summer months before falling and re-starting the cycle. There is growing evidence that the pandemic did not impede the typical V2O rent growth pattern altogether, but rather, it created a delay. After a lackluster spring, rent growth in V2Os charted a 6.5% year-over-year increase in July, the highest growth rate in more than four years. The early spring lockdown prevented leasing activity that would have otherwise occurred. Once restrictions started to ease, market activity quickly snapped back.
Year-over-year rent growth in lease renewals, which tends to see far less seasonal variability, fell dramatically between April and June, falling as low as 1.4%. Between the start of 2019 and March 2020, annual rent growth on renewals averaged 4.5% and never fell below 4.1%. While the June reading stands as the lowest annual rent growth reading on record, July offered some optimism that a recovery may already be underway as rent growth improved by 92 bps.
Recent data suggests that SFR renewal rent growth softness followed an apartment sector-wide trend in the second quarter. According to RealPage, many apartment landlords halted planned rent increases and more frequently used concessions to entice renters to renew. Even in the SFR subsector where new leasing demand is high, the lost rental income created by a temporary vacancy likely exceeds the marginal step-up in rents received through the V2O process.
Cap Rates & Prices
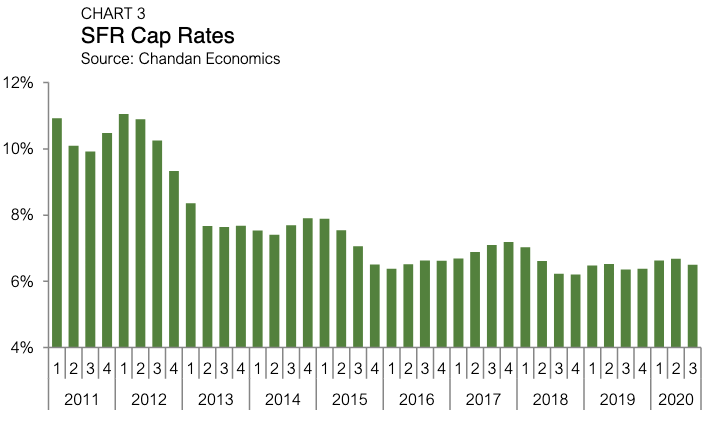
Cap rates on SFR properties peaked at 11.0% as home prices bottomed out in 2012 (Chart 3). The formalization of the SFR sector in the intervening few years has meant greater cap rate stability. Generally, national SFR cap rates have hovered between 6.0% and 8.0% for the past six years. SFR cap rates ticked down to 6.5% in the third quarter 2020, down 18 bps from the prior quarter.
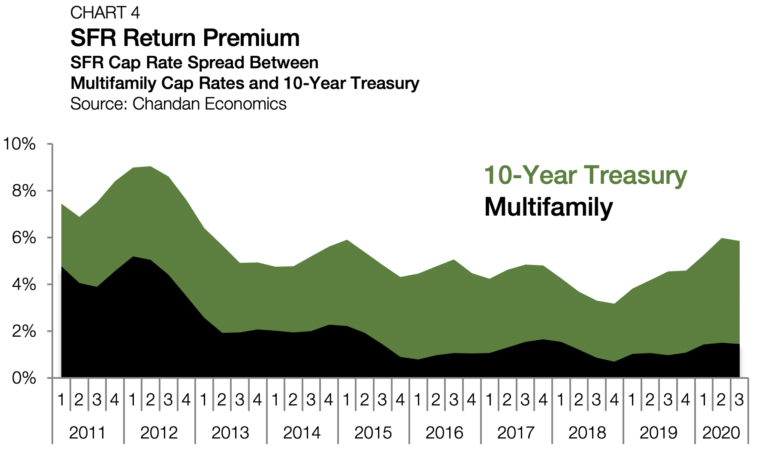
Benchmarking SFR cap rates against comparable asset types highlights how investors view the risk profile of the sector. An SFR risk premium is inferred by measuring cap rates against the 10-year Treasury yield, the market approximation of the risk-free interest rate.
The pandemic has brought Treasury yields down to new depths. In the third quarter, the yield on a 10-year Treasury bill averaged just 0.7% — the lowest quarterly reading on record. As a result, the spread between SFRs and Treasurys rose significantly through the early stages of the shutdown and has remained elevated, averaging 5.9% in the third quarter (Chart 4).
The spread ticked down by a marginal 14 bps between the second and third quarters, though it is up an impressive 130 bps year-over-year. Spreads between SFR and multifamily cap rates ticked down by 7 bps to 1.4% in the third quarter. This has signaled that the SFR sector has faced similar COVID-related disruptions, compared with other income-producing residential real estate.
Few, if any, identifying characteristics distinguish single-family homes that are rented from those that are owner-occupied. The institutionalization of the SFR sector may eventually create some asset-level and pricing differences. Still, for the moment, an SFR’s value remains tied to its local single-family housing market.
Investors often look to the equivalence between rental and for-sale assets as a feature to drive peak returns. In periods of housing market softness, investors enter at higher yields. When a housing market tightens, investors then have the optionality of marketing their assets to other SFR investors, the current tenants and potential owner-occupants.
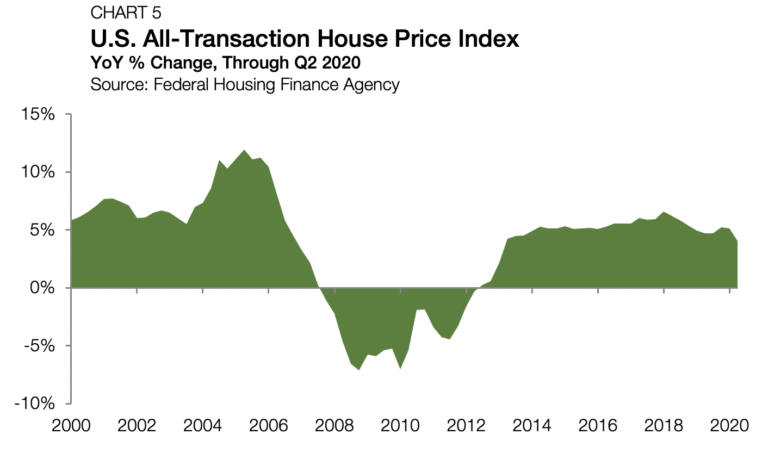
According to the Federal Housing Finance Agency’s All-Transaction House Price Index, property prices rose 4.0% in the second quarter of 2020 compared to one year ago (Chart 5). In the first quarter, the year-over-year growth rate stood at 5.1%.
The relative deceleration in pricing speed of 1.1% between the first and second quarters is the most substantial slowing since 2011 and likely reflects a partial impact of COVID-19. However, a slowing growth rate is not equivalent to falling asset values. The housing market was on solid footing heading into the pandemic. Its relatively strong position has allowed it to absorb a negative shock without resulting in an outsized effect.
LTVs
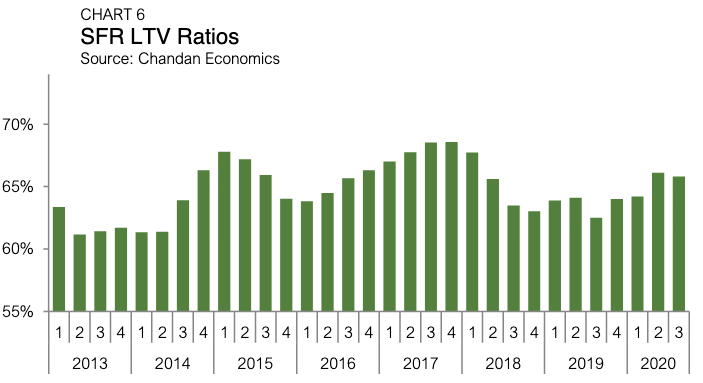
Loan-to-value ratios (LTVs) on SFR mortgages fell 30 bps in the third quarter of 2020, settling at 65.8% (Chart 6). Year-over-year, however, LTVs are up a weighty 330 bps. Lenders traditionally tend to pull back in recessionary periods and are more conservative in their underwriting, accounting for the added risk of asset devaluations and borrower defaults.
However, thus far, in the COVID-19 recession, there is little evidence of widespread housing market distress. Moreover, in many places around the country, housing prices are incredibly tight as urban outmigration pours into adjacent suburbs. High occupancy figures, coupled with resilient asset valuations, are likely supporting confidence in the SFR sector’s stability, preventing any significant downward pressure on LTVs.
Debt Yields
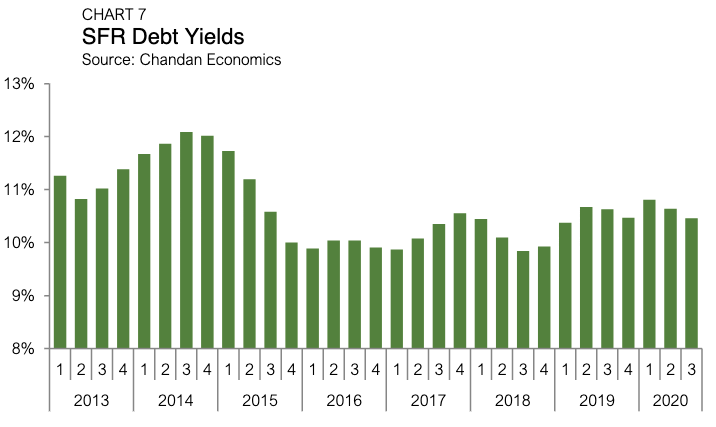
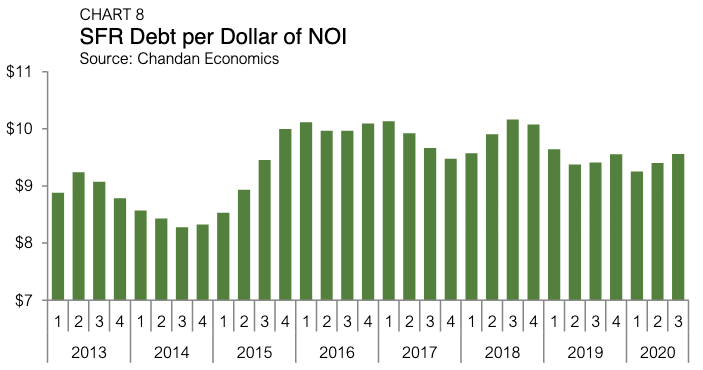
Debt yields fell 18 bps between the second and third quarters, averaging 10.5%. The reading is directly in line with the average set across 2019 (Chart 7). The inverse of debt yields, debt encumbrance per dollar of NOI, rose by $.16 in the third quarter to $9.56 (Chart 8). These trends suggest that the pandemic has not significantly affected appetites for credit risk.
Residential Default Rates
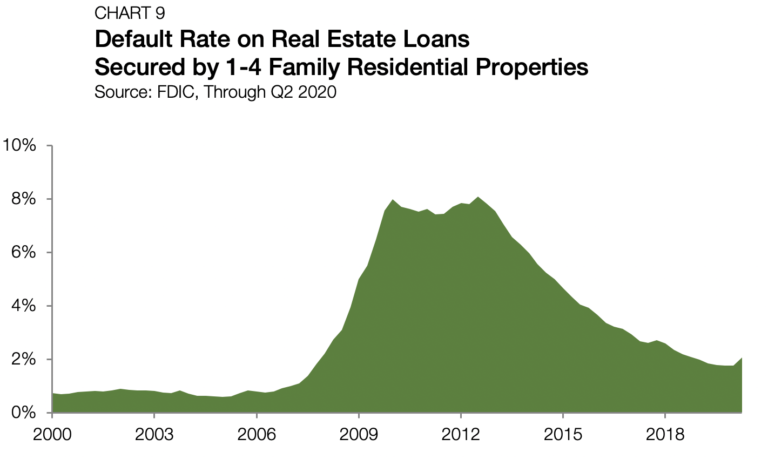
During the housing crisis, investors with available financing took advantage of the market dislocation, acquiring large portfolios of single-family assets at steep discounts. Mortgage default rates soared to 8.1%, and an abundance of buyers began seeding the SFR sector as we know it today (Chart 9).
In the second quarter of 2020, default rates rose by 31 bps reaching 2.1% — the single largest quarter-over-quarter jump since the first quarter of 2010. While the relative change is concerning, current default levels do not reflect widespread distress in absolute terms.
The inflection brings default rates just below levels in late 2018. With the expiration of protective measures such as forbearance and the absence of any new congressionally approved stimulus, levels of delinquencies and defaults may rise further. However, they are unlikely to approach the levels seen during the housing crisis.
The presence of a deep pool of potential buyers distinguishes this crisis from the last one. This factor will allow owners to capture more accrued equity even if they are selling despite a preference to stay.
Build-to-Rent
Build-to-rent continues to become a defining feature of the SFR sector. As the industry has recognized the need for tailored supply pipelines, the strategies for increasing supply have diversified. Some operators add new units piecemeal, constructing a singular unit on each plat of land, while others opt for large-scale community developments. This nonuniformity is leading to product differentiation by price, size and amenities.
The sector’s infancy means that it is still in a phase of experimentation. As a result, renters drawn to the asset class have a more robust set of options to maximize their housing utility.
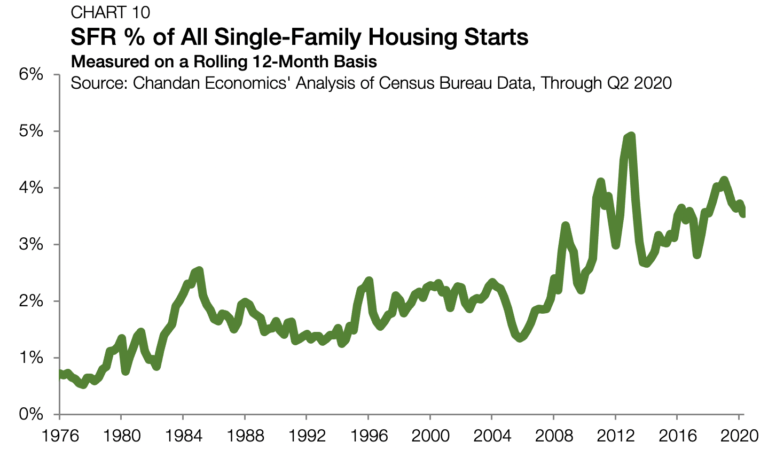
Based on an analysis of Census Bureau data, between 1975 and the start of the prior recession in 2007, SFRs accounted for a little less than 1.6% of all single-family construction (Chart 10). The SFR share of single-family starts has since soared. In 2013, the SFR construction share approached 5.0% and today, it remains elevated at 3.5%.
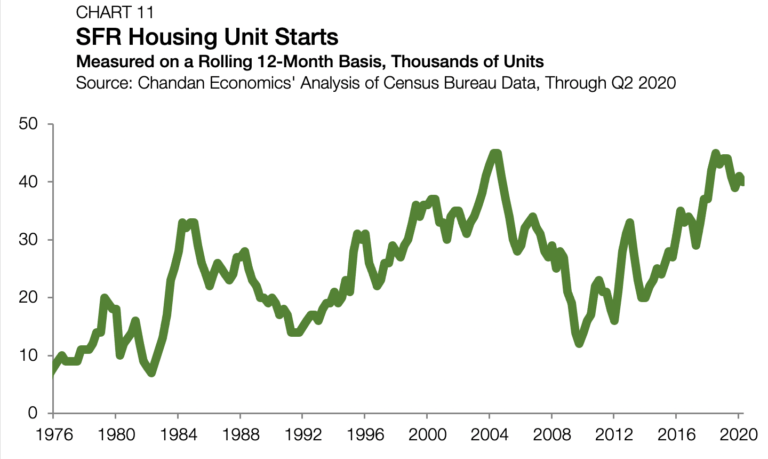
SFR construction starts totaled 40,000 units through the 12 months ending in the second quarter of 2020, down 5,000 from the post-recession high set in the third quarter of 2018 (Chart 11).
Tracking Future Demand
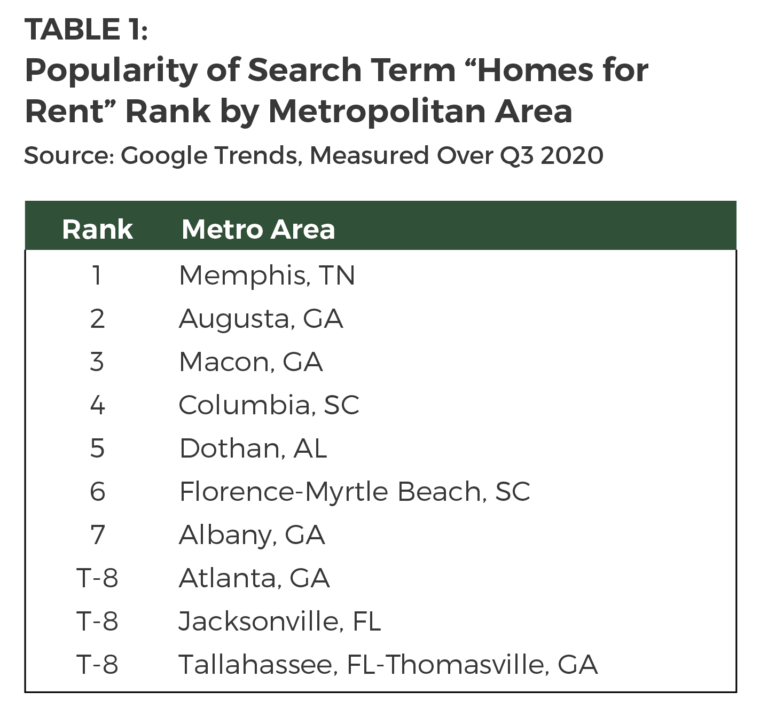
Utilizing Google Trends, the popularity of the search term “homes for rent” is leveraged as a proxy for existing and future hotspots of SFR demand. Metropolitan areas in the Southeast dominate the list. Memphis, Tennessee, charted the highest frequency of the search term in the third quarter, rising from ranking seventh in the second quarter (Table 1).
On the surface, these findings appear to be translating into ground-level demand. According to Zillow, Memphis led all major metro areas in August rent increases, growing by 8.3% year-over-year.
Moving past Memphis, cities in Georgia dominate the top 10. Augusta and Macon come in at second and third in the rankings. Albany, Atlanta and Thomasville, Georgia, hit the top 10 as well. A recent Albany Herald article noted that new home sales and construction had “rebounded aggressively,” returning to pre-coronavirus levels. The local SFR sector is expected to benefit from the increased activity in the broader single-family market.
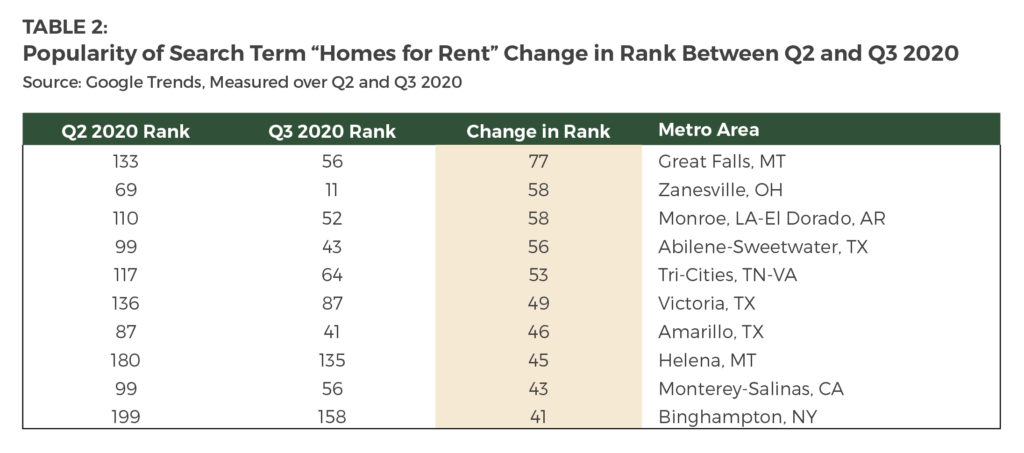
To track which parts of the country might see new demand in the coming months, we measured the popularity of the search term between the second and third quarters of 2020, noting where the biggest jumps occurred. Leading the way, Great Falls, Montana, rose 77 spots, landing at number 56 on the list.
Outlook
The single-family rental sector may be the best positioned residential asset class to see continued growth through the end of the pandemic. SFR’s favorable countercyclical profile has combined with a confluence of demographic and migration factors, boosting tenant demand and retention.
While living rooms and pajamas are unlikely to replace conference rooms and ironed shirts permanently, the growing acceptance of remote working should continue to elevate demand in urban-adjacent suburbs, all else equal. Landlords are not entirely out of the rent-collection woods just yet. The COVID-19 recession is proving to be more of a marathon than a sprint, and accommodative policies are waning.
A market inflection in tenant performance is unlikely, though some deterioration remains possible. Still, despite the presence of transitory risks, SFRs enjoy a critical balance of favorable factors likely to support the subsector’s economics over the short- and long-term.
For more single-family rental research and insights, visit arbor.com/blog
Disclaimer
All content is provided herein “as is” and neither Arbor Realty Trust, Inc. or Chandan Economics, LLC (“the Companies”) nor their affiliated or related entities, nor any person involved in the creation, production and distribution of the content make any warranties, express or implied. The Companies do not make any representations regarding the reliability, usefulness, completeness, accuracy, currency nor represent that use of any information provided herein would not infringe on other third party rights. The Companies shall not be liable for any direct, indirect or consequential damages to the reader or a third party arising from the use of the information contained herein.