Finance
In today’s constantly evolving market environment, partnering with a lender that can balance prioritizing speed of execution with tailored solutions makes all the difference in securing the financing you need. Arbor’s experience, expertise, and innovation, combined with our willingness to understand each deal and work to make it successful, set us apart from other multifamily lenders. In our more than three decades of closing deals, we’ve found that having these 10 items on hand at the beginning of your borrowing journey helps prevent roadblocks and streamlines the entire financing process.
Articles
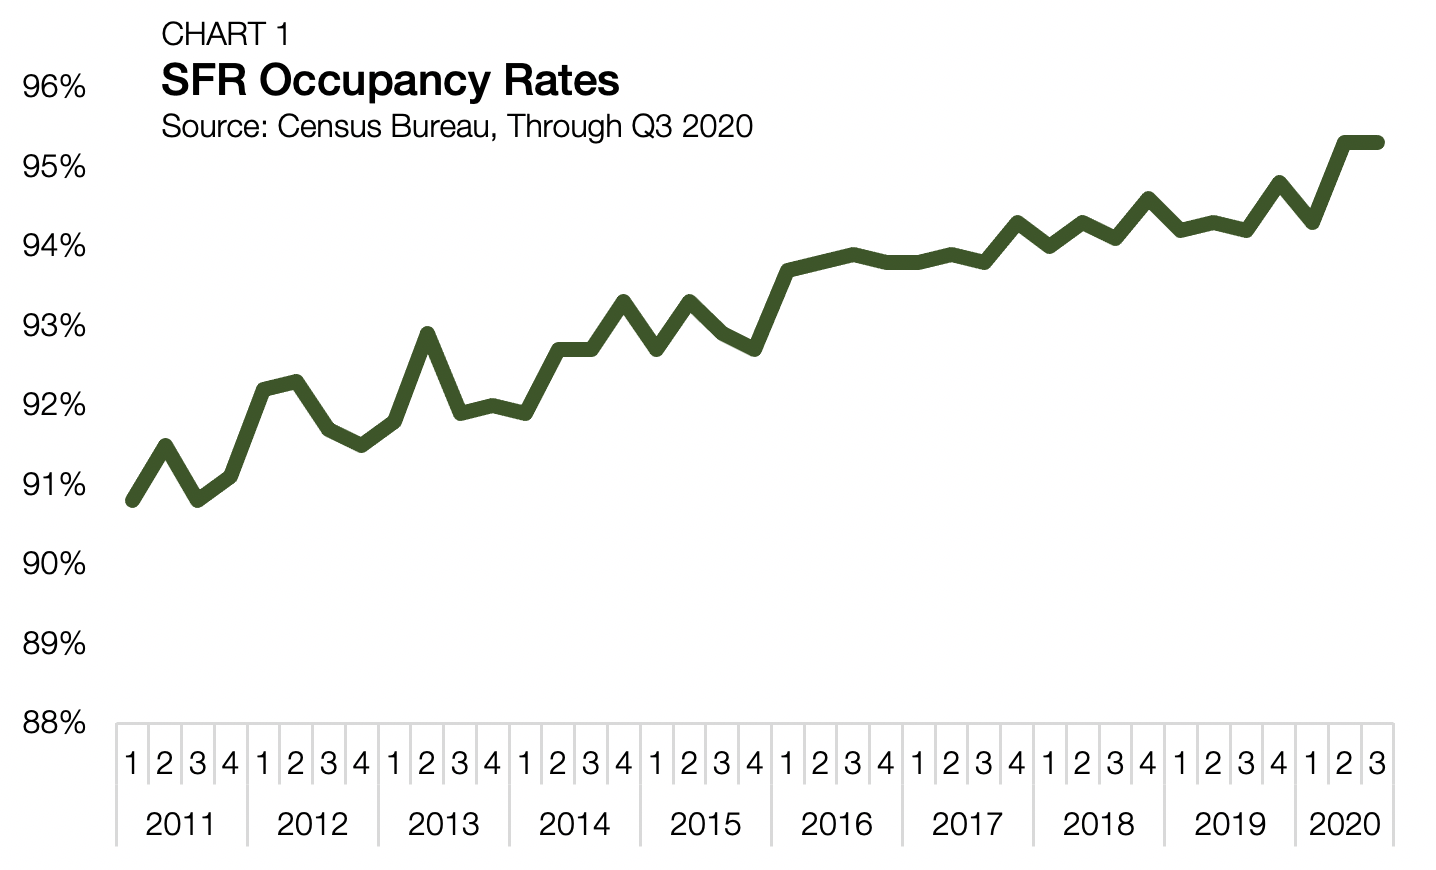
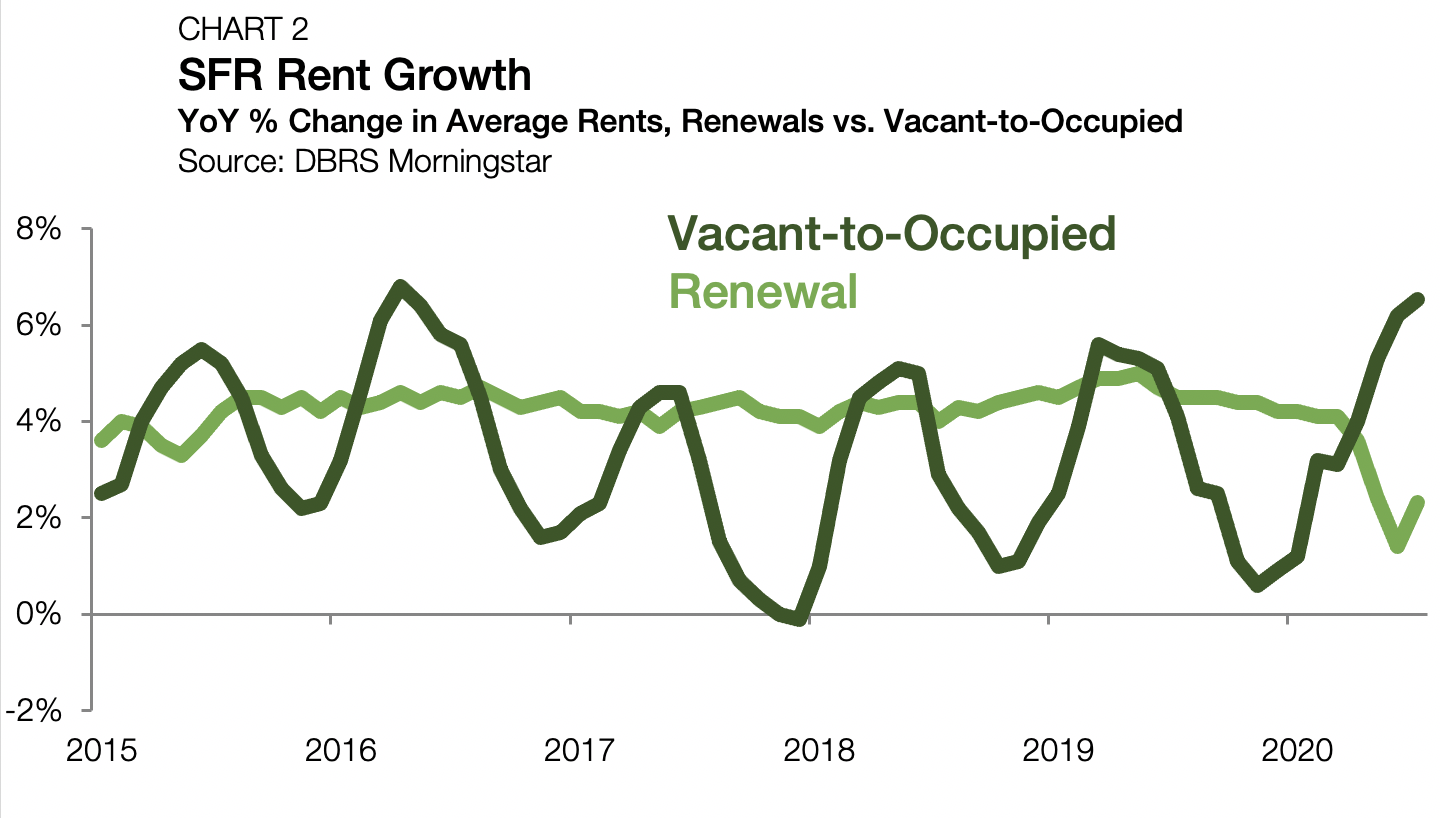
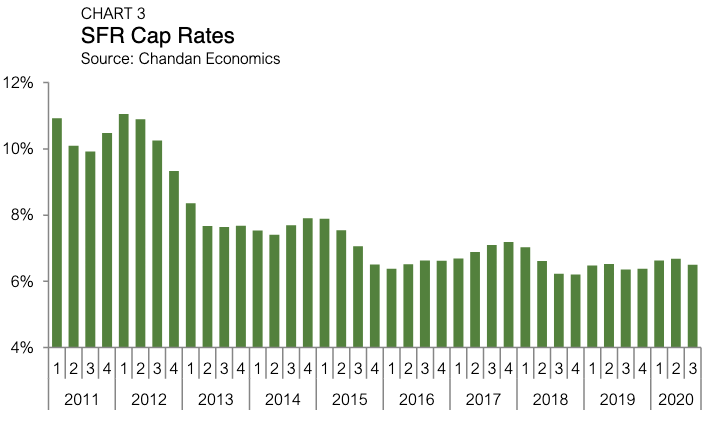
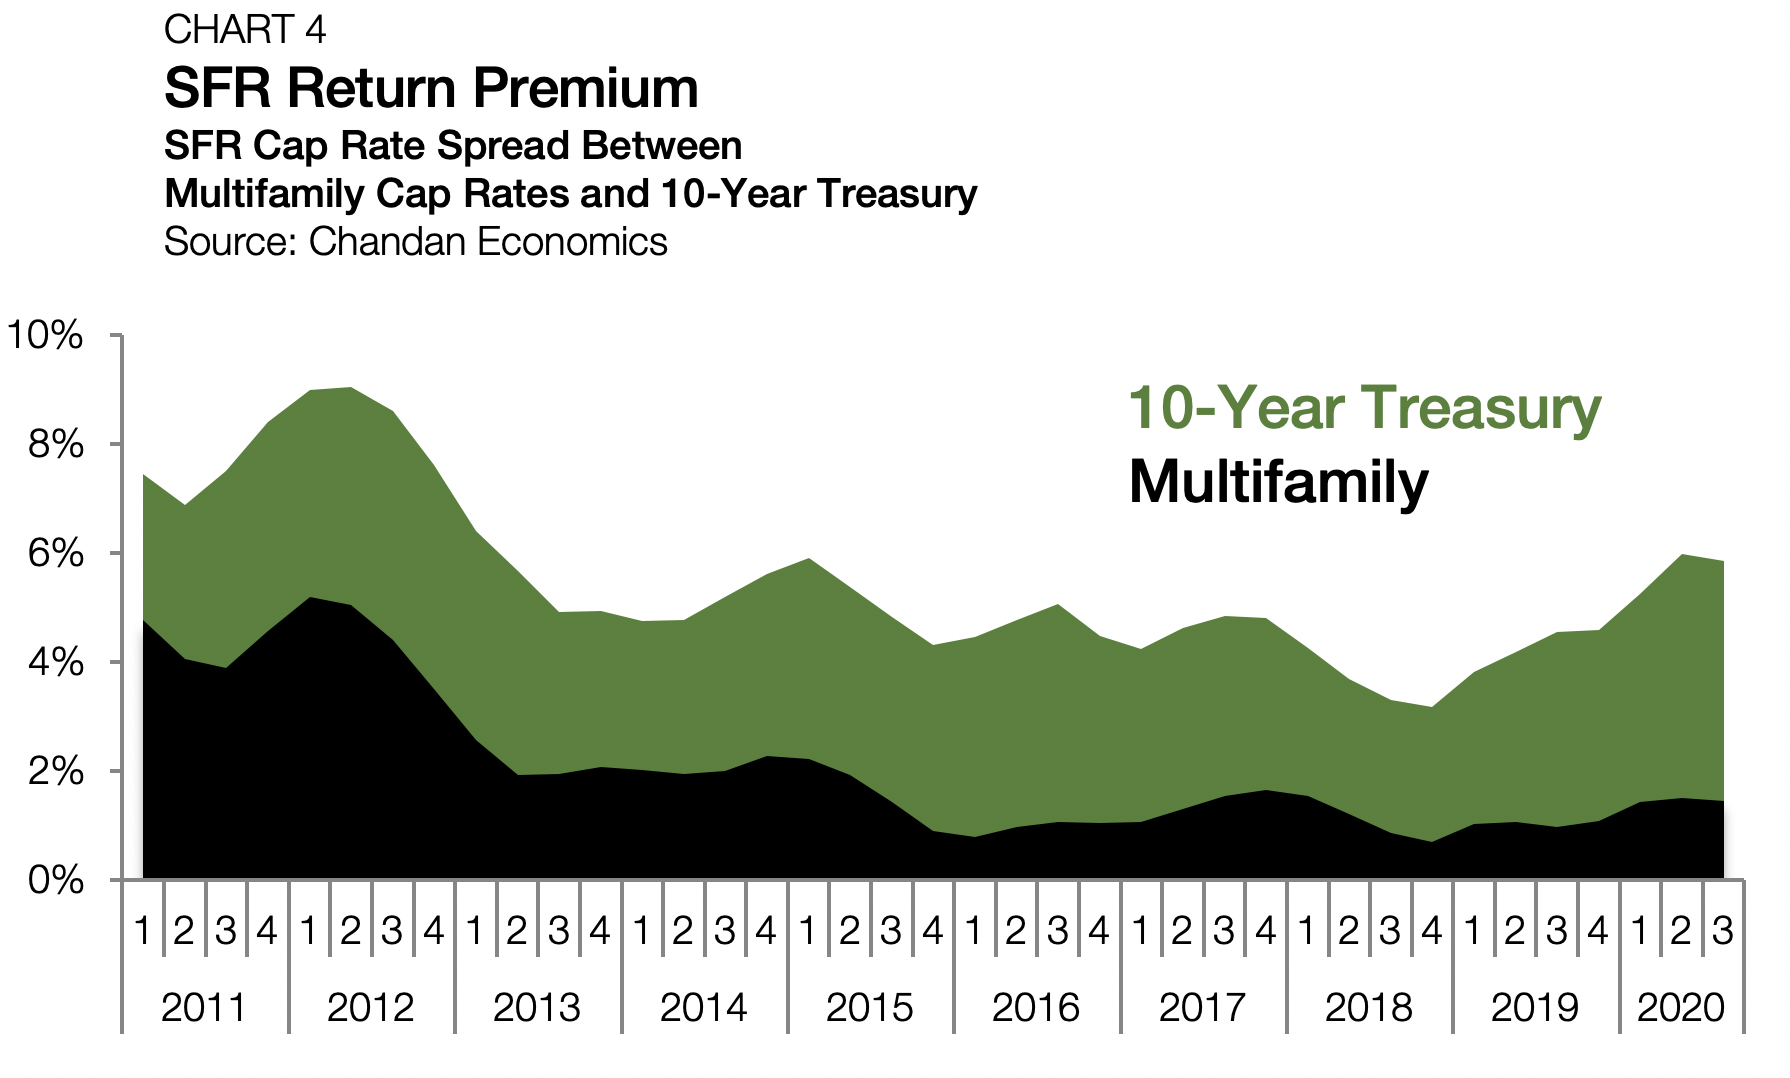
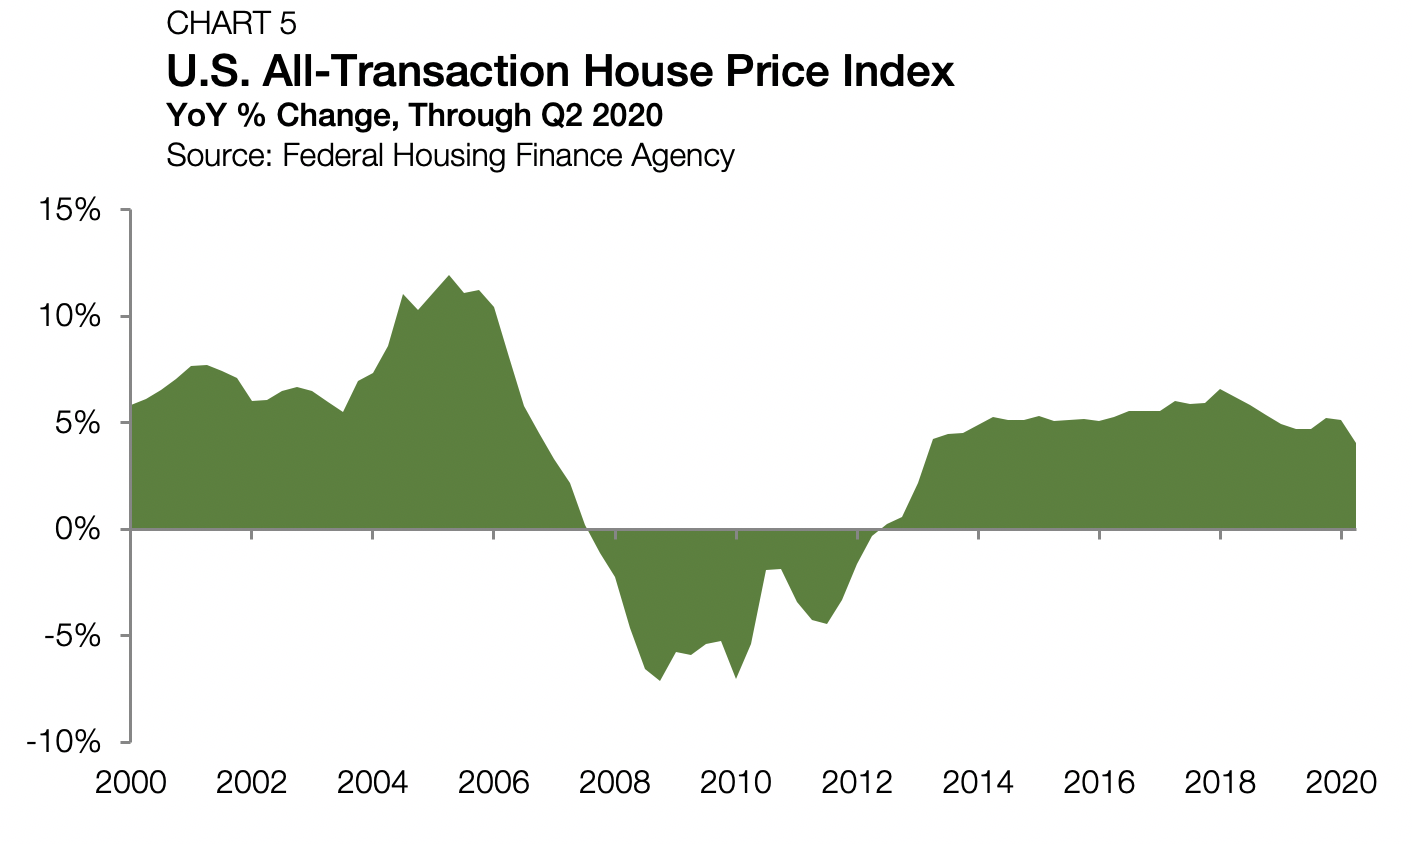
The single-family rental (SFR) sector continued showing strength in several key areas in the second quarter of 2025, even as residential housing market growth moderated.
Articles
The U.S. housing market reflects a patchwork of local needs, preferences, and geographies, creating distinct storylines. Across the country, many significant shifts have occurred over the last five years, an analysis of U.S. Census Bureau data shows. More expensive housing markets tend to support higher percentages of rental households, and in fast-growing metros, rentals have become a highly effective and flexible way to house new residents.
Articles
In all market cycles, commercial real estate firms are better positioned to achieve successful results with leaders who are strong, confident, and authentic, qualities demonstrated by the dozens of speakers at the 2025 Real Estate Pride Roundtable in New York City.
Articles
Single-family rental (SFR) investing is surging as this asset class outperforms. With homeownership less attainable and lifestyle renting more popular, the sector’s tailwinds bode well for long-term growth. If you are new to this space, our guide has answers to commonly asked questions.
Current Reports
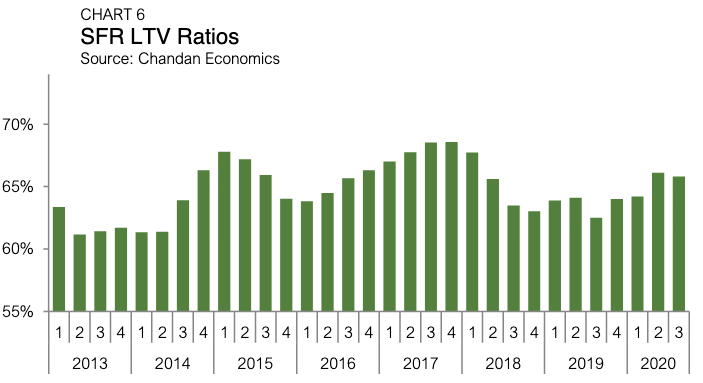
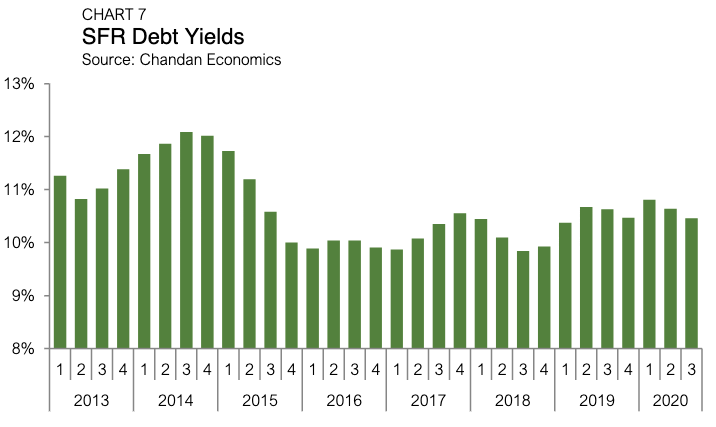
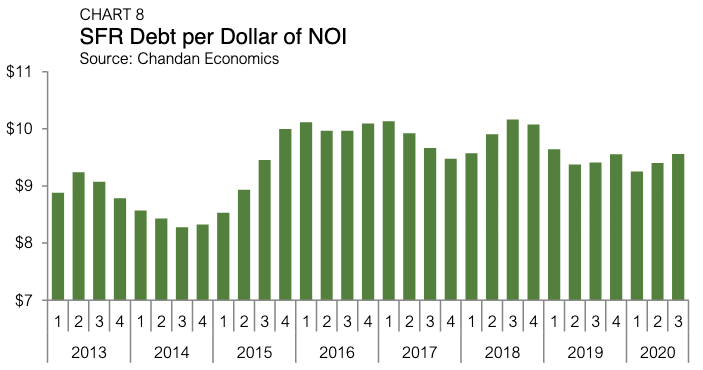
Bolstered by robust build-to-rent (BTR) activity, the single-family rental (SFR) sector continued to display strength even as the residential housing market moderated. Arbor’s Single-Family Rental Investment Trends Report Q2 2025, developed in partnership with Chandan Economics, provides original research and analysis of key performance metrics for investors to take a closer look at a sector on the rise.
Analysis
Amid ongoing macroeconomic uncertainty, the small multifamily sector remains favorably positioned for stability as the structural need for affordable housing in the U.S. has supported the strength of the sector’s demand profile.
Articles
As build-to-rent (BTR) demand rises, single-family rental (SFR) development has become more efficient in creating a distinct, community-focused experience for renters. Newly released U.S. Census Bureau data confirms that SFR/BTR development continues to be robust and stable, with its annualized pace of construction in the first quarter of 2025 matching the previous quarter’s tally.