Arbor Realty Trust’s Small Multifamily Investment Trends Report Q1 2026, developed in partnership with Chandan Economics, shows that lending activity in the sector increased for the second consecutive year amid a sharp increase in refinancings. Even with persistently high interest rates and rigorous underwriting standards, small multifamily entered the first quarter on steady footing.
Fall 2022
About This Report
The Arbor Realty Trust Affordable Housing Trends Report, developed in partnership with Chandan Economics, offers a wide-ranging lens into the complex, though critically important affordable and workforce housing sectors. The aim of the report series is to provide a comprehensive primer for industry stakeholders to better understand the major trends shaping the market.
This series focuses on Affordable housing supported by government subsidies or tax incentives like the Low-Income Housing Tax Credit (LIHTC), as well as the Naturally Occurring Affordable Housing (NOAH) segment. It addresses the significant changes observed both in terms of policy decisions and market dynamics and describes opportunities for investment and financing in the space.
Key Takeaways
- Rising construction costs have slowed new Affordable construction as financing gaps for LIHTC developers have widened.
- A sizeable expansion of the Housing Choice Voucher program was removed from the Inflation Reduction Act of 2022, though the White House continues to call for increased funding in its annual budget resolutions.
- Nearly 90% of developers reported they will avoid markets with mandatory affordability requirements as local rent control measures are under consideration in five states.
-
Affordable Housing
Affordable housing, denoted with a lowercase “a,” broadly refers to housing that costs less than 30% of a household’s income. This threshold can vary based on other industry definitions. Capital-A “Affordable Housing” is defined as units that are supported either by a government subsidy or tax incentive.
-
Affordability
Housing affordability is measured as spending up to 30% of a renter household's income on rent plus utilities.
-
Naturally Occurring Affordable Housing (NOAH)
Units that do not receive subsidies, but are affordable to low- and moderate income renters. In this analysis, a NOAH unit is defined as one where a renter household earning at most 80% of the Area Median Income would spend less than 30% of its income on rent plus utilities.
-
Housing Choice Voucher (HCV)
The federal government’s major program for assisting low-income renters in the private market. A subsidy is paid to the landlord and the occupant pays the difference between the rent charged and the subsidy.
-
Low-Income Housing Tax Credit (LIHTC)
Tax credits provided for the acquisition, construction and rehabilitation of affordable rental housing for low- and moderate-income tenants.
-
U.S. Department of Housing and Urban Development (HUD)
A U.S. government agency that supports community development and home ownership. The Agency oversees many Affordable housing programs including the HCV and LIHTC.
State of the Market
As heightened housing demand and soaring inflation challenge low-income households, the affordable housing market sits at a critical juncture. Affordability has emerged as a primary concern for low-income earners living in naturally occurring affordable housing (NOAH). According to Moody’s Analytics CRE, apartment asking rent growth peaked at 16.9% between mid-2021 to mid-2022, compared to an increase of 2.3% in the average hourly wages over the same period.
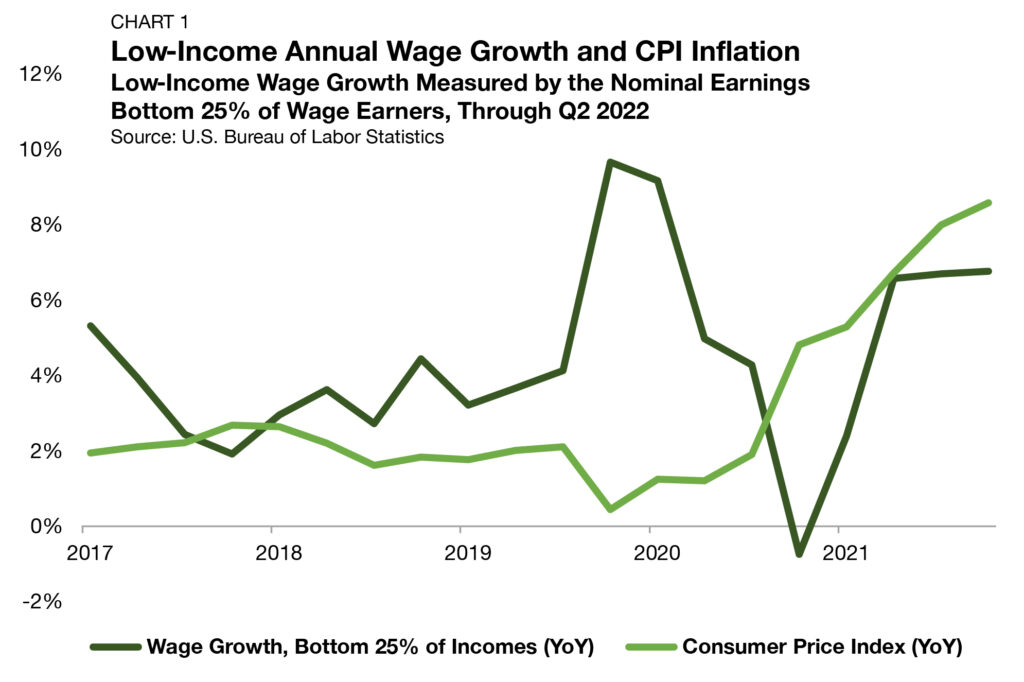
Even renters who are in regulatory-protected units that insulate rents from market forces have not been immune from growing economic pressures, as the persistence of overall inflation relative to wages has eroded the purchasing power of America’s most income-constrained earners. Through the second quarter of 2022, the Consumer Price Index (CPI) has outpaced wage growth for five consecutive quarters. (Chart 1).
The Federal Finance Housing Agency’s (FHFA) mission-driven mandate given to Fannie Mae and Freddie Mac continues to support liquidity for affordable units. With multifamily underwriting standards tightening generally, some borrower demand may shift to where the Agencies are padding new loan production. At the same time, higher construction costs have made the financing of Affordable housing more difficult, including those properties utilizing Low-Income Housing Tax Credits (LIHTCs). While investor demand for affordable projects remains intense, economic factors have limited the breadth of new development. The National Low Income Housing Coalition’s most recent estimate found that the U.S. has a shortage of 7 million affordable and available rental homes — a far cry from market equilibrium.
Rent control has remained a hot-button policy issue throughout the country. According to the National Multifamily Housing Council, at least five states (Florida, Nevada, New York, Minnesota, and California) have localities that are actively considering new rent control measures. These types of corrective measures often reduce the incentive for private developers to add new housing supply. As a result, rent controls may do more to treat the symptoms, not the causes, of local affordable housing challenges, ultimately exacerbating long-term supply-demand mismatches.
Where lasting progress has been made in the affordable segment over the past several decades, it has been through goal-aligned tax incentives and public investment programs. Initiatives aimed at boosting the housing supply have garnered support from industry groups, activists, and policymakers in recent years. In September, the National Association of Realtors President Leslie Rouda Smith participated in a White House meeting on housing supply and affordability where she “conveyed to the Administration and my colleagues our support for a comprehensive plan that includes investment in new construction, zoning reforms, expansion of financing, and tax incentives to spur investment in housing and convert unused commercial space to residential.” Thus far, transformational progress at the federal level remains elusive.
LIHTC: Financing Gaps Widen as Construction Costs Soar
The Low-Income Housing Tax Credit (LIHTC) is the nation’s single-largest Affordable housing program that directly addresses supply. It comes in two forms: a 9% tax credit to incentivize new development and a 4% tax credit for the rehabilitation and preservation of existing properties. According to the National Housing Preservation Database, LIHTCs support roughly 2.5 million rental units.
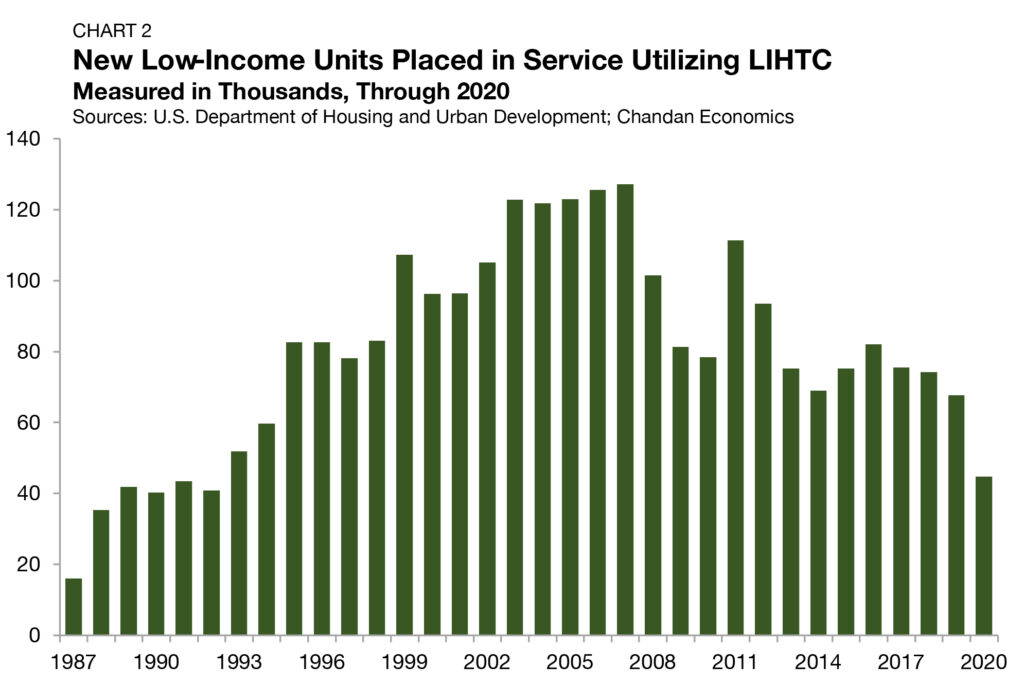
The number of new low-income units placed into service under the program topped out at 126,796 in 2007. Since then, the number of new units placed into service fell in nine of the next 12 years, gradually sliding to 44,732 new units through 2020 — a 65% drop from its peak (Chart 2).1 According to a September 2022 National Council of State Housing Agencies (NCSHA) report, the costs associated with Affordable construction have risen by about 30% since 2019, creating significant funding gaps that have limited new projects. However, in July 2022, the U.S. Treasury Department announced new guidance, allowing State and local governments to unlock coronavirus fiscal recovery funds to support the financing of Affordable housing projects, creating a temporary funding-gap relief.
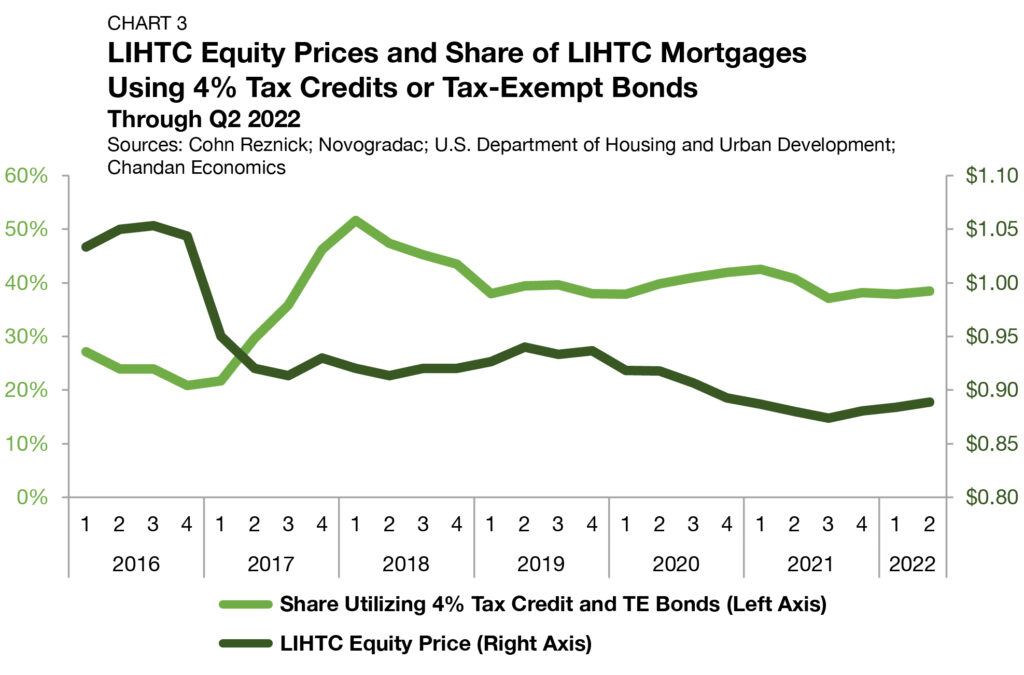
After the 2016 Presidential election, LIHTC’s equity price per credit dropped from $1.04 to $0.95, as investors anticipated, and eventually received a decrease in tax liabilities (Chart 3).2 After stabilizing near $0.93 between 2017 and 2019, LIHTC equity prices gradually compressed to sub $0.90 levels by the end of 2020, where they remain today.
Through the second quarter of 2022, LIHTC equity prices averaged $0.89 per credit, according to Cohn Reznick’s LIHTC Equity Pricing Trends data. Over the last seven quarters, LIHTC equity prices have ranged narrowly between $0.87 and $0.89 per credit. The drop off in these prices after 2016 meant that Affordable developers could not raise as much capital by trading their tax credits. As a result, the adoption of a 4% LIHTC for rehabilitation became
a more attractive option than the 9% LIHTC for ground-up development, leading to a surge in its utilization in 2017.
The tax credit became more attractive after the December 2020 passage of the Consolidated Appropriations Act, which established a minimum 4% floor on the applicable federal tax credit rate for tax-exempt multifamily housing private activity bonds (PABs). The minimum floor made the 4% tax credit more valuable and increases how much funding developers can raise to finance Affordable construction. Through the second quarter of 2022, the share of LIHTC mortgages utilizing this tax credit remained elevated at 38%.
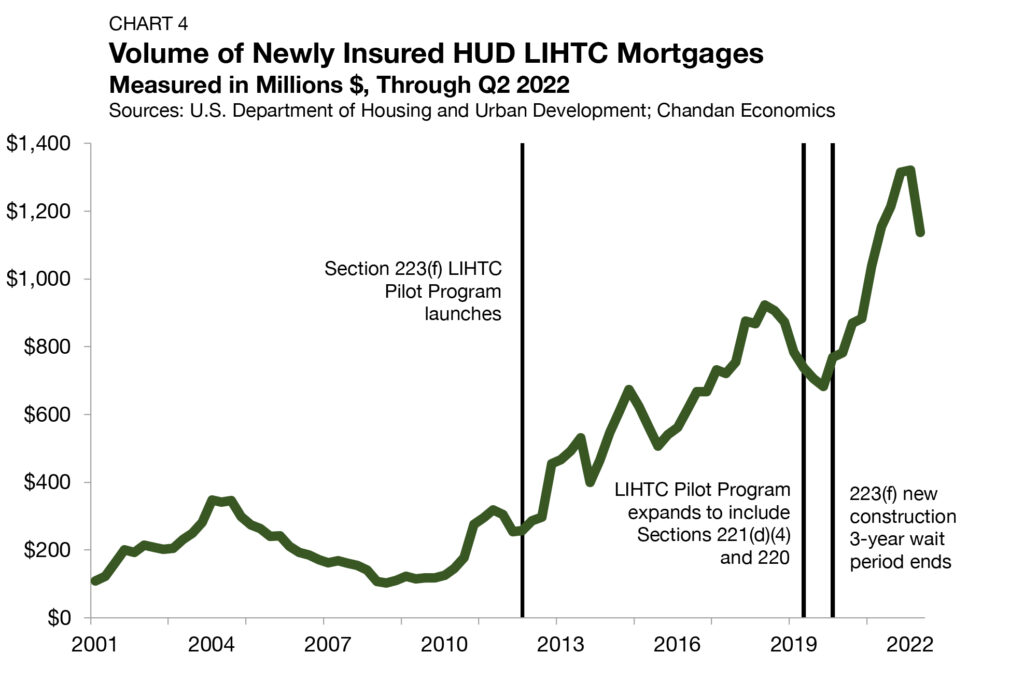
The dollar volume of newly HUD-insured LIHTC mortgages grew substantially over the past decade, though there has been an inflection in 2022 (Chart 4).3
In the second quarter of 2022, the dollar volume of newly issued mortgages utilizing LIHTC covered under insurance from the U.S. Department of Housing and Urban Development (HUD) declined – falling 13.9% to $1.1 billion, according to HUD’s Insured Multifamily Mortgages Database. The removal of temporary factors that boosted volumes in 2021, including the 12.5% expansion of the 9% tax credit and other disaster-related credit allocations, may partially explain the 2022 inflection. Moreover, widening financing gaps may also have limited the volume of newly insured LIHTC mortgages.
More recently, the FHA has shared positive updates, but there is a widespread and bipartisan recognition that the program needs a more sizable overhaul. In September 2022, the FHA announced that it was increasing the frequency of allowable surplus cash distributions with most FHA-insured multifamily mortgages, making HUD-insured loans more like private debt instruments and thereby boosting their investor appeal. The Affordable Housing Credit Improvement Act of 2021, which is currently stalled in Congress, would increase per capita allocations and improve the usability of LIHTC credits. While the bill has yet to receive a formal vote in either chamber of Congress, it has continued to pick up co-sponsors throughout 2022, and it could receive renewed attention after a LIHTC expansion was removed from the Inflation Reduction Act of 2022.
HCV: Substantial Progress Remains Elusive, Modest Increases
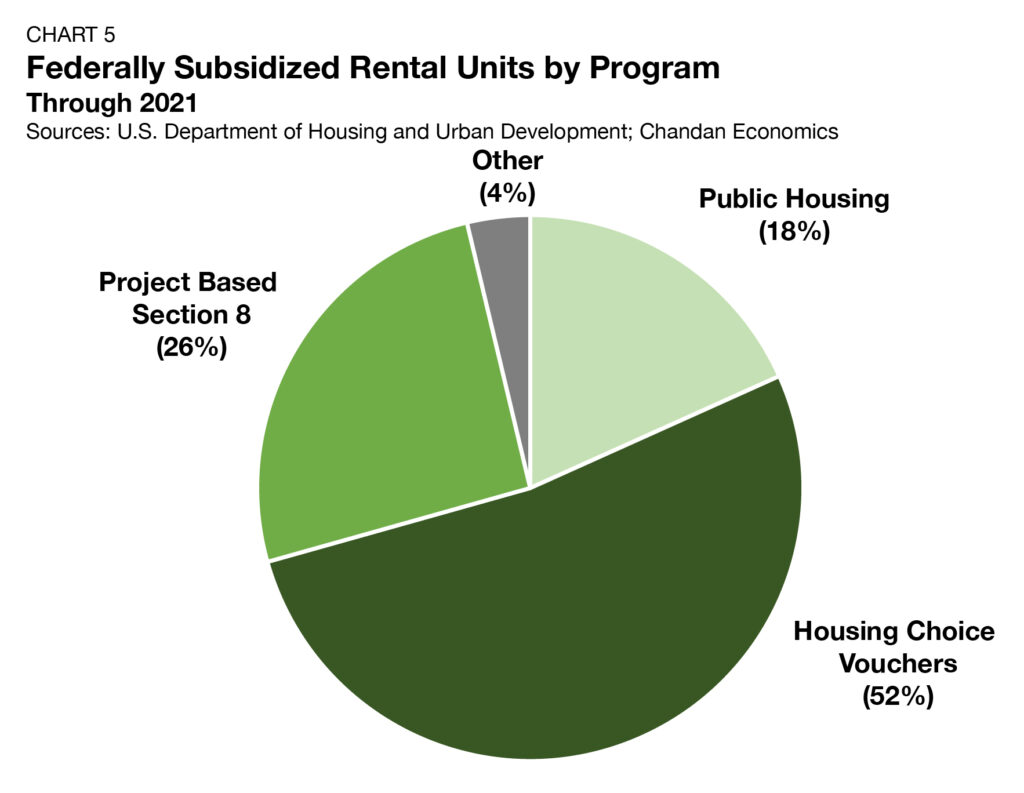
While LIHTC is the largest supply-side Affordable housing program, the Housing Choice Voucher (HCV) program is the largest overall, accounting for 2.7 million units.4 As a share of all federally subsidized rental units, the HCV Program accounted for 52% in 2021, a rise of 66 basis points (bps) from 2020 (Chart 5). The next largest program by unit count, Project-Based Section 8, is a distant second, accounting for 26% of federally subsidized units.
The HCV program is primarily a form of tenant-based housing assistance, where renters spend 30% of their adjusted monthly income on rent, and the balance is covered through a subsidy. It provides targeted assistance to very low-income households. The average household income for renters in this program in 2021
was $15,577.
HUD’s policy guidelines dictate that 75% of new families enrolled in the program must earn at most 30% of the local area median income (AMI). The balance of households in the program may earn up to 80% of AMI. HCVs are widely supported by private-market advocates. Unlike rent control which places the burden of the subsidy on the landlord, HCVs interact openly in a market setting. Moreover, a renter household can retain their subsidy should they choose to move, encouraging positive housing mobility.
The HCV program has expanded slowly in recent years, failing to keep pace with growing market needs. Between 2015 and 2020, the number of units covered under the program expanded between 0% and 2% per year. However, some meaningful progress is underway. Announced on September 23, 2022, HUD awarded 19,359 new HCV vouchers to 1,945 Public Housing Authorities — the most expansive allocation in nearly 20 years. HUD also recently announced its 2023 Fair Market Rent (FMR) estimates, a criteria benchmark used to determine whether a unit qualifies for an HCV renter to reside in. FRMs are set to go up by an average of 10% around the country next year, which should help to offset the impact of the inflationary rise in housing costs experienced throughout 2022.
The HCV program looked like it was in line for a significant expansion as part of the White House’s proposed “Build Back Better” plan, though the earmarked funding was left out of the Inflation Reduction Act. Still, the White House’s proposed 2023 fiscal year budget currently calls for a 9.4% step up in HUD appropriations — a request that would bring the Department’s annual budget up to $71.9 billion. The proposal includes a request for $1.6 billion in funding for the creation of an additional 200,000 new vouchers. A new piece of bipartisan legislation that was introduced to Congress in March 2022 aims to boost private-market participation in the HCV program through grant funding incentives. However, the bill has not been brought forward for a vote in either chamber of Congress. Further, U.S. Representative John Katko (R-NY), one of the bill’s sponsors, is retiring at the end of this term, likely stalling the legislation’s advancement.
NOAH: Agencies Supporting Liquidity, Regulations Limiting Supply
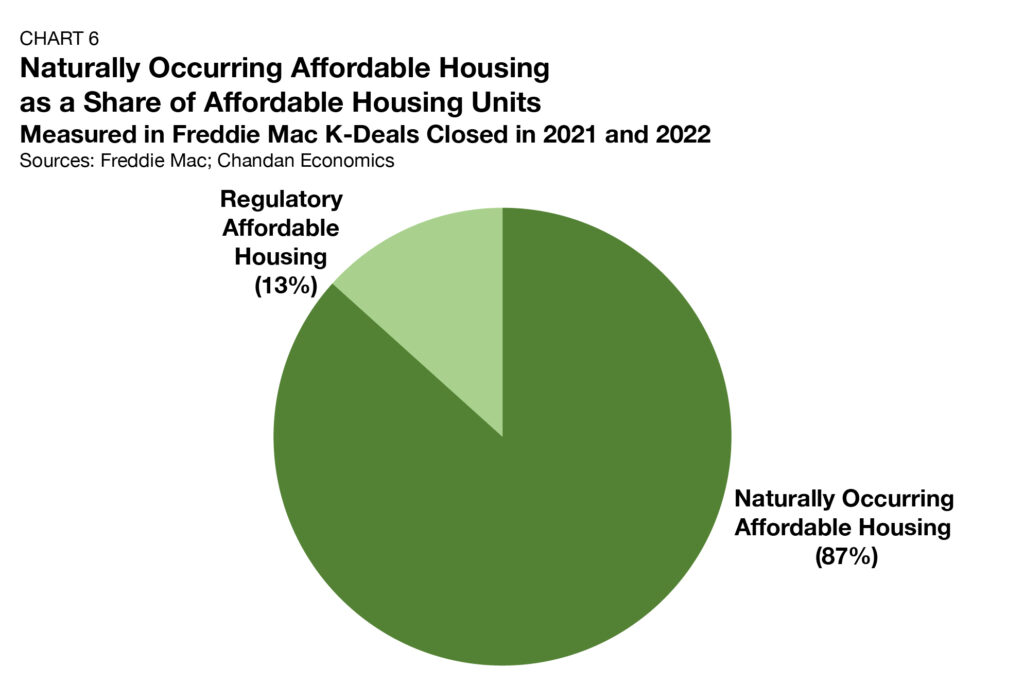
While most of the attention paid to the affordable housing sector focuses on regulation and policy intervention, the naturally occurring affordable housing (NOAH) supply is proportionally more significant. For Freddie Mac multifamily loans originated in 2021, 81% of the housing units that are affordable at 80% or below local AMI are NOAH properties (Chart 6).5 These data align with previous estimates that suggest NOAH units account for about three-quarters of all of the affordable housing supply.
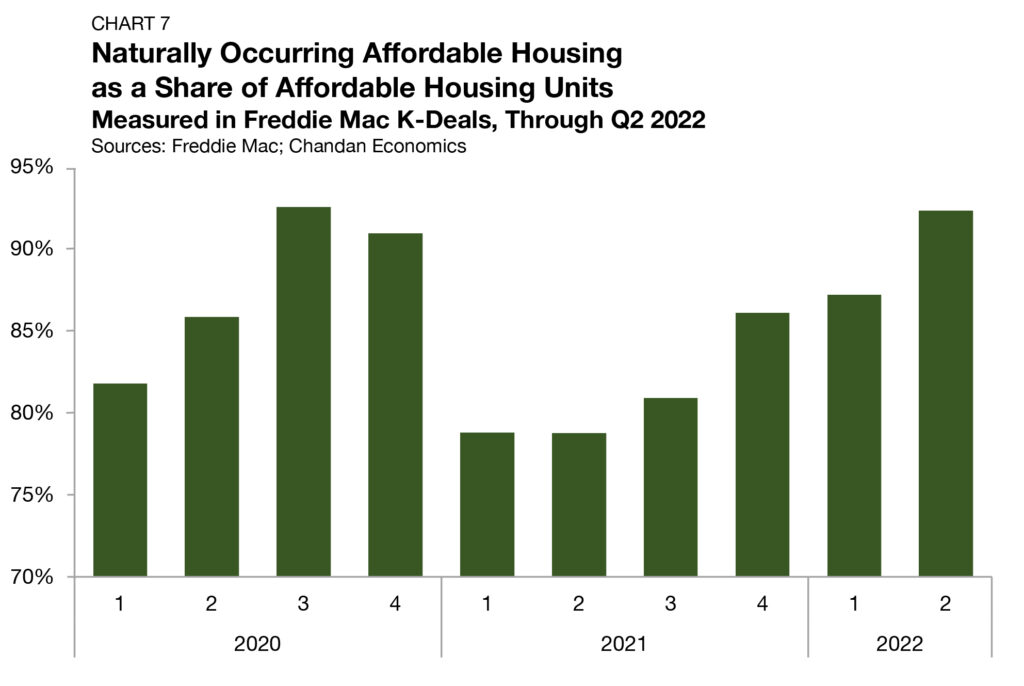
Under FHFA guidelines, Fannie Mae and Freddie Mac each have lending caps of $78 billion for the 2022 calendar year, with the direction that half of the total allowance must be directed towards mission-driven lending, which includes a primary focus on support for affordable housing. Notably, the NOAH share of affordable units in Freddie Mac K-Deals has grown considerably since 2021, surging from 78.8% in the second quarter of 2021 to 92.3% in the second quarter of 2022 (Chart 7).
An argument often supported by housing industry advocates is that by reducing the regulatory costs of construction, developers could add more units, thereby creating more NOAH supply. According to a report released in June 2022 by the National Multifamily Housing Council and the National Association of Home Builders, regulatory compliance accounts for a staggering 40.6% of multifamily development costs. Moreover, 47.9% of developers report avoiding localities with inclusionary zoning mandates, and a consensus (87.5%) report avoiding areas with rent control measures on the books.
What to Watch
In the months ahead, there are several developments to watch that could impact the landscape of affordable housing heading into 2023. As was the case heading into 2022, the White House’s proposed budget calls for a larger HUD funding increase than the Department received in the passing resolution. As 2022 comes to a close and Congress sets its sights on FY 2023, the HUD budget increase is an item to watch for because it may influence the potential expansion of the HCV program. The collective $16 billion increase in Agency lending caps in 2022 meant, at minimum, an additional $8 billion in liquidity for mission-qualifying housing. The lending caps for 2023 are expected to be announced later this year.
Elsewhere in Washington, D.C., there has been a renaissance in policy ideas aimed at improving affordable housing outcomes, though no substantive legislation has advanced as of late. In July, the Senate’s Housing, Transportation, and Community Development Subcommittee held the Opportunities and Challenges in Addressing Homelessness hearing, which “showcased bipartisan support for addressing the affordable housing crisis.” An expansion of the LIHTC was among the solutions supported by both a majority of witnesses and committee members. The creation of a Neighborhood Home Tax Credit and a Middle-Income Tax Credit to support ownership opportunities in distressed communities and housing affordability for workforce renters, respectively, were two other proposed solutions of note.
All else equal, 2022 marks a unique and challenging moment for the affordable housing landscape. Policymaking priorities, public sentiment, and investment preferences are aligned in support of the creation of affordable housing. Still, the economic conditions over the past year have distinctly eroded affordability, making the prospect of adding new supply more difficult. The temperature gauge has risen for the affordable sector, and to turn the tide, 2023 will need to be a year where consensus solutions translate into substantive actions.
For more affordable housing research and insights, visit arbor.com/articles
1 These data are released by the U.S. Department of Housing and Urban Development (HUD) and can be retrieved here. According to HUD, 2020 data are scheduled for release in Spring 2022.
2 LIHTC Equity Pricing Trends are calculated as a quarterly series by Chandan Economics. 4% LIHTC usage is displayed as a four-quarter moving average. Novogradac data are utilized from Q1 2016 through Q4 2019. Cohn Reznick data are utilized Q1 2020 through Q4 2021.
3 Data presented in Chart 5 are displayed as a four-quarter moving average based on the date of initial endorsement.
4 Total is based on data retrieved from HUD’s Office of Policy Development and Research; Data are through 2021.
5 According to a Chandan Economics analysis of Freddie Mac K-Deals
6 An additional 36% of respondents in 2021 indicate that affordable housing is a minor problem in their local area.
Disclaimer
All content is provided herein “as is” and neither Arbor Realty Trust, Inc. or Chandan Economics, LLC (“the Companies”) nor their affiliated or related entities, nor any person involved in the creation, production and distribution of the content make any warranties, express or implied. The Companies do not make any representations regarding the reliability, usefulness, completeness, accuracy, currency nor represent that use of any information provided herein would not infringe on other third party rights. The Companies shall not be liable for any direct, indirect or consequential damages to the reader or a third party arising from the use of the information contained herein.


