In today’s constantly evolving market environment, partnering with a lender that can balance prioritizing speed of execution with tailored solutions makes all the difference in securing the financing you need. Arbor’s experience, expertise, and innovation, combined with our willingness to understand each deal and work to make it successful, set us apart from other multifamily lenders. In our more than three decades of closing deals, we’ve found that having these 10 items on hand at the beginning of your borrowing journey helps prevent roadblocks and streamlines the entire financing process.
Affordable Housing
Spring 2023
About This Report
The Arbor Realty Trust Affordable Housing Trends Report, developed in partnership with Chandan Economics, offers a wide-ranging lens into the complex, though critically important, affordable and workforce housing sectors. The aim of the report series is to provide a comprehensive primer for industry stakeholders to better understand the major trends shaping the market.
This series focuses on affordable housing supported by government subsidies or tax incentives like the Low-Income Housing Tax Credit (LIHTC), as well as the Naturally Occurring Affordable Housing (NOAH) segment. It addresses the significant changes observed both in terms of policy decisions and market dynamics and describes opportunities for investment and financing in the space.
Key Findings
- The Inflation Reduction Act of 2022 provided $4 billion in additional funding for the Housing Choice Voucher program, though further increases have met resistance.
- The shortage of affordable rental housing units grew by 500,000 from 2019 to 2021, reaching 7.3 million units.
- The 2024 Federal budget includes higher funding levels and rules changes to the Low-Income Housing Tax Credit program to encourage more affordable housing development.
-
Affordable Housing
Affordable housing broadly refers to housing that costs less than 30% of a household’s income. Affordable housing includes units that are naturally occurring without any policy intervention, as well as government-supported units that are made affordable to income-constrained renters through a subsidy or a tax incentive.
-
Affordability
Housing affordability is measured as spending up to 30% of a renter household's income on rent plus utilities.
-
Naturally Occurring Affordable Housing (NOAH)
Units that do not receive subsidies, but are affordable to low- and moderate-income renters. In this analysis, a NOAH unit is defined as one where a renter household earning at most 80% of the area median income would spend less than 30% of its income on rent plus utilities.
-
Housing Choice Voucher (HCV)
The federal government's major program for assisting low-income renters in the private market. A subsidy is paid to the landlord and the occupant pays the difference between the rent charged and the subsidy.
-
Low-Income Housing Tax Credit (LIHTC)
Tax credits provided for the acquisition, construction, and rehabilitation of affordable rental housing for low- and moderate-income tenants.
-
U.S. Department of Housing and Urban Development (HUD)
A U.S. government agency that supports community development and home ownership. The Agency oversees many affordable housing programs including the HCV and LIHTC.
Sources: U.S. Department of Housing and Urban Development; Tax Policy Center; Chandan Economics
State of the Market
The creation and preservation of affordable housing units in the U.S. have made great strides in recent years, but there has also been a fair share of setbacks. The affordable housing gap has widened even as funding levels for targeted programs have increased. As calls for change grow louder, economic headwinds are presenting a new set of challenges.
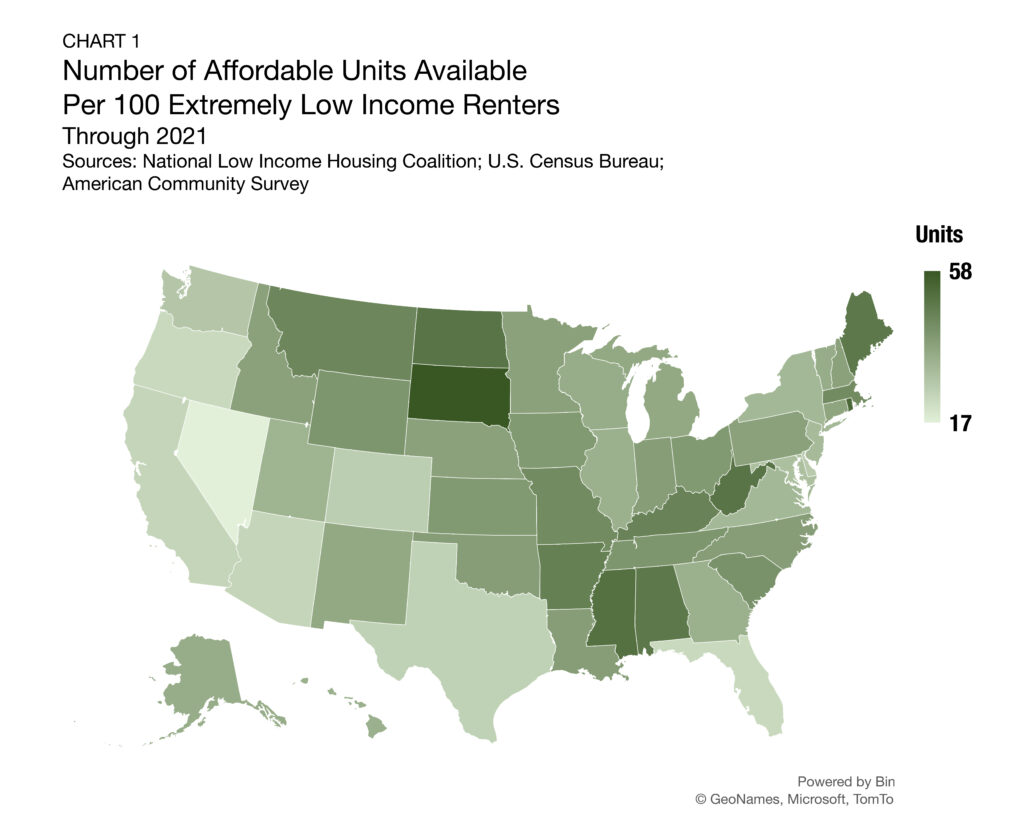
The Gap: A Shortage of Affordable Rental Homes, the National Low Income Housing Coalition’s (NLIHC) 2023 annual report, looked into how many units are affordable and available to extremely low-income (ELI) renters.1 No state in the U.S. and no major metropolitan area currently has enough supply to meet demand (Chart 1). South Dakota leads the nation with 58 units available per 100 ELI renters, while Nevada (17 units per 100 renters), Florida (23 units), and Texas (25 units) have the fewest affordable housing options. The NLIHC’s analysis shows that as public awareness of the affordable housing crisis in the U.S. grew so has the need for action. Between 2019 and 2021, the U.S. shortage of affordable rental homes increased by 500,000 units, reaching 7.3 million.
The federal government has made progress in expanding the Housing Choice Voucher (HCV) program, though recent additions have yet to prove to be transformational. Moreover, the Low-Income Housing Tax Credit (LIHTC) has faced a shortfall. The White House made an overhaul to both programs a priority in its 2024 budget proposal. The National Multifamily Housing Council (NMHC) applauded the Biden administration for its affordable housing focus and its “multi-faceted approach to meet housing demand”; however, NMHC also noted that the proposal’s call to have developers pay for the program expansions through higher taxes would work against the policy’s intention.
Rent control has remained a hot-button policy issue throughout the country. At least eight states (Massachusetts, Minnesota, Montana, New Hampshire, New Mexico, South Carolina, Virginia, and Washington) are actively considering new rent control measures at the state or local level. These types of corrective actions can have the unintended effect of reducing the incentive for private developers to add new housing supply. As a result, rent controls may do more to treat the symptoms, not the causes, of local affordable housing challenges, potentially exacerbating long-term supply-demand mismatches. Still, state legislatures are fluid incubators for creating new policy models for reaching higher equilibriums of affordable supply. California, which has the most restrictive statewide rent control in the country, recently authorized $7.2 billion in new spending over the next three years to encourage affordable housing and combat homelessness. Florida recently signed into law a provision that bans statewide rent control while also providing its state-sponsored Housing Finance Corporation $711 million in new funding to increase workforce housing options. New York State also recently announced a new affordable housing plan, which targets zoning code changes to encourage the development of new supply.
LIHTC: Policy Initiatives Aim to Close Financing Gaps
The Low-Income Housing Tax Credit (LIHTC) is the nation’s single-largest affordable housing program that directly addresses supply. It comes in two forms: a 9% tax credit to incentivize new development and a 4% tax credit for the rehabilitation and preservation of existing properties. According to the National Housing Preservation Database, LIHTCs support approximately 2.5 million rental units. However, new unit additions in the LIHTC program have slowed, according to the U.S. Department of Housing and Urban Development (HUD). Between 2007 and 2020, the number of new low-income units placed into service under the LIHTC program gradually dropped off from an annual high of 126,796 units to a recent low of 44,732 units.2
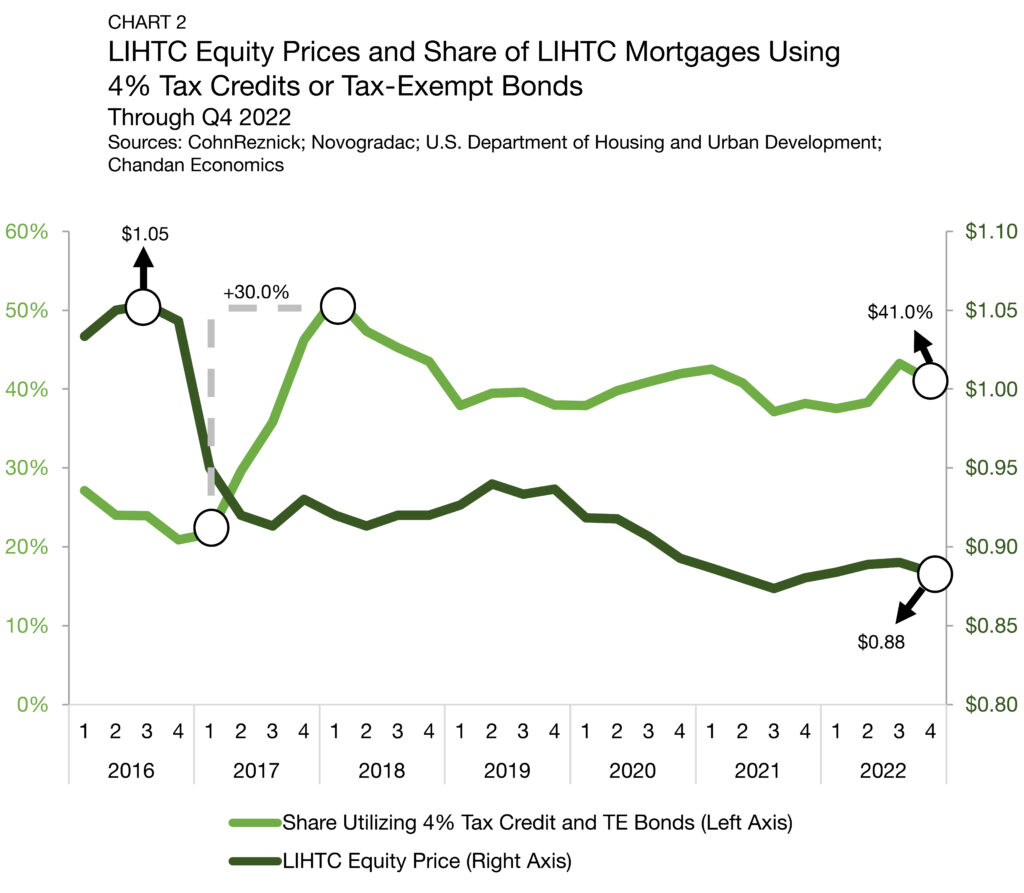
A key reason for the limited growth of new units in the LIHTC program is that developers often experience significant funding gaps for new projects. Construction costs have soared while the 9% LIHTC tax credit, which developers will sell off to finance their projects, has declined in value. LIHTC equity prices took a significant hit after the 2016 election, dropping by roughly 10% as investors anticipated and eventually received a decrease in tax liabilities (Chart 2).3 LIHTC equity prices eventually stabilized between $0.87 and $0.89 per credit, where they remain today, according to CohnReznick. The drop-off in LIHTC equity prices after 2016 meant that developers could not raise as much project capital by trading their tax credits. As a result, the adoption of a 4% LIHTC tax credit for rehabilitation became more attractive than the 9% tax credit for ground-up development, leading to a surge in its utilization in 2017.
The rehabilitation tax credit became more attractive after the December 2020 passage of the Consolidated Appropriations Act, which established a minimum 4% floor on the applicable federal tax credit rate for tax-exempt multifamily housing private activity bonds (PABs). The minimum floor made the 4% tax credit more valuable and increased how much funding developers can raise to finance construction. Through the fourth quarter of 2022, the share of LIHTC mortgages utilizing the tax credit remained elevated at 4.1%.
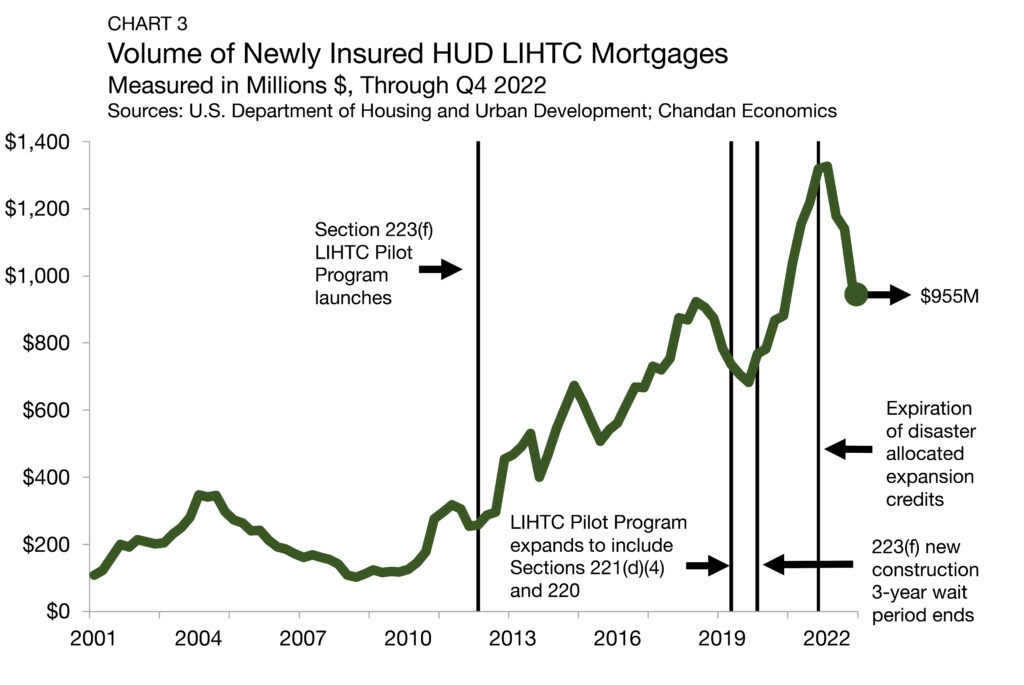
The dollar volume of HUD-insured LIHTC mortgages grew substantially over the past decade. However, there was an inflection in 2022 (Chart 3).4 In the fourth quarter of 2022, the dollar volume of newly issued mortgages utilizing LIHTC tax credits covered under insurance from HUD declined again — falling 16.3% to $955 million, according to HUD’s Insured Multifamily Mortgages Database. The removal of temporary factors that boosted volumes in 2021, including the 12.5% expansion of the 9% tax credit and other disaster-related credit allocations, may partially explain the 2022 inflection. Moreover, widening financing gaps are also limiting the volume of newly insured LIHTC mortgages.
More recently, the Federal Housing Authority (FHA) has shared positive updates, but there is widespread recognition that the program needs a more sizable overhaul. In September 2022, the FHA announced that it was increasing the frequency of allowable surplus cash distributions with most FHA-insured multifamily mortgages, making HUD-insured mortgages more like private debt instruments, boosting investor appeal. A late-2022 bipartisan push to lower private-activity bond financing requirements from 50% to 25% failed to make it into the 2023 budget resolution. However, the White House has called for the rule change as part of its 2024 budget proposal, in addition to a $28 billion expansion of the program over the next decade.
HCV: Marginal Annual Gains Fail to Keep Pace with Demand
While LIHTC is the largest supply-side affordable housing program, the Housing Choice Voucher (HCV) program is the largest overall, accounting for 2.7 million units.5 The HCV program accounted for 53.1% of all federally subsidized rental units in 2022, a rise of 70 basis points (bps) from 2021 (Chart 4).
The next largest program by unit count, Project-Based Section 8, is a distant second, accounting for 25.6% of federally subsidized units.
The HCV program is primarily a form of tenant-based housing assistance, where renters spend 30% of their adjusted monthly income on rent, and the balance is covered through a subsidy. It provides targeted assistance to very low-income households. The average household income for renters in this program in 2022 was $16,019.
HUD’s policy guidelines dictate that 75% of new families accepted into the program must earn at most 30% of the local area median income (AMI). The balance of households in the program may earn up to 80% of AMI. HCVs are widely supported by private-market advocates. Unlike rent control, which places the burden of the subsidy on the landlord, HCVs interact openly in a market setting. Moreover, a renter household can retain their subsidy should they move, encouraging positive housing mobility.
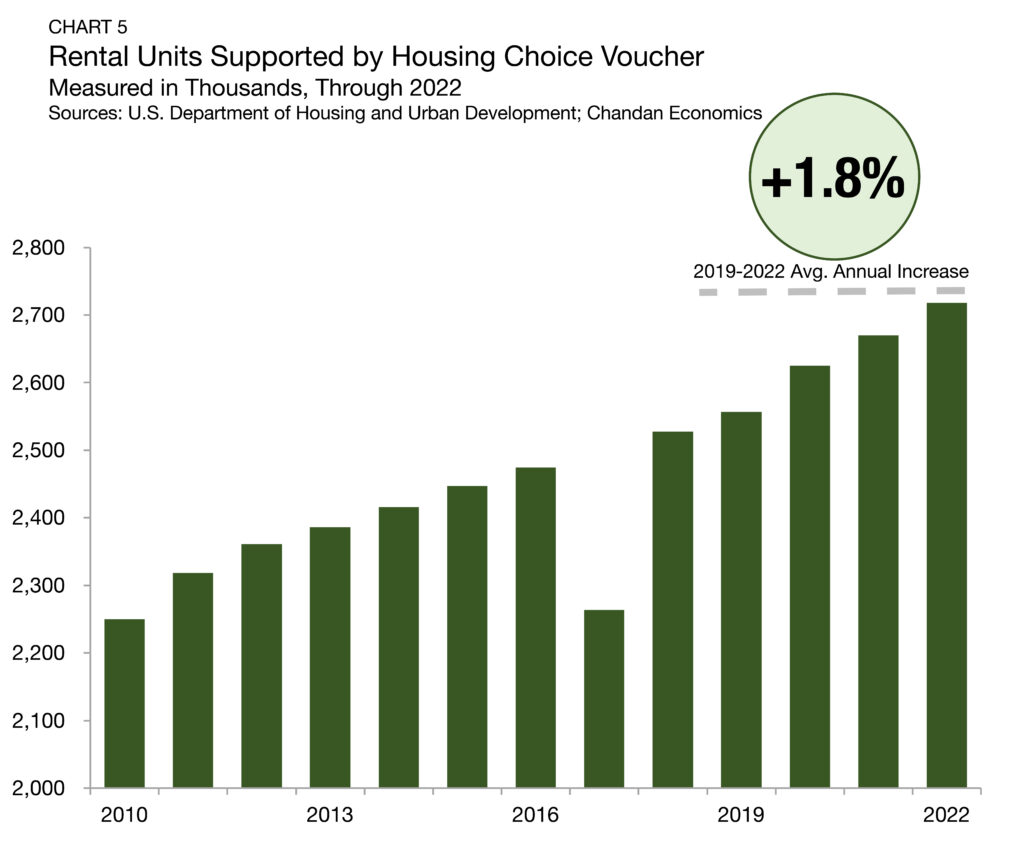
The HCV program has expanded slowly in recent years, failing to keep pace with growing market needs. Aside from 2017 and 2018, the number of units covered under the program has expanded between 1.1% and 2.7% per year since 2012 (Chart 5). While recent White House efforts for a more significant expansion of vouchers have failed to garner enough congressional support, momentum has been building over the past year. Within the signed version of the Inflation Reduction Act of 2022, HUD was provided an additional $4 billion for HCV expansion.
Since then, $23.5 billion has been provided for the 2023 fiscal year, which would cover all current in-place vouchers through this year. The 2023 budget bill also set aside a separate $4 billion that will become available to the agency in October 2023 if the previous amount is expended. The additional funding is estimated to be enough to expand vouchers to an additional 12,000 new households.
With the election season approaching, legislative compromise on affordable housing outside of budget reconciliation debates is less likely. Still, there remains enough bipartisan support for voucher expansion that it may pick up support in the upcoming 2024 budget negotiations. In a recent summary of the Administration’s housing proposals, HUD detailed a proposed $2.4 billion funding addition to the HCV program, which would maintain existing contracts and expand coverage to an additional 50,000 households.
On the congressional level, Senators Chris Coons (D-Del.) and Kevin Cramer (R-N.D.) re-introduced the Choice in Affordable Housing Act, in January 2023, which aims to increase the number of landlords that accept vouchers and expand overall access to affordable housing. The Coons-Cramer bill proposes to designate $500 million towards creating a new Housing Partnership Fund that would allow local housing authorities to award “signing bonuses” to a landlord of a unit in an area with a poverty rate below 20% and allow prospective tenants to receive security deposit assistance. The act would also require HUD to expand its use of Small Area Fair Market Rents to determine rents in a given area while removing some red tape from the approval process.
The Coons-Cramer bill has picked up several bipartisan co-sponsors and enjoys the endorsement of key national interest groups, such as the National Apartment Association, the National Low Income Housing Coalition, and the National Multifamily Housing Council, among others.
NOAH: Investors Rally Behind Workforce Housing
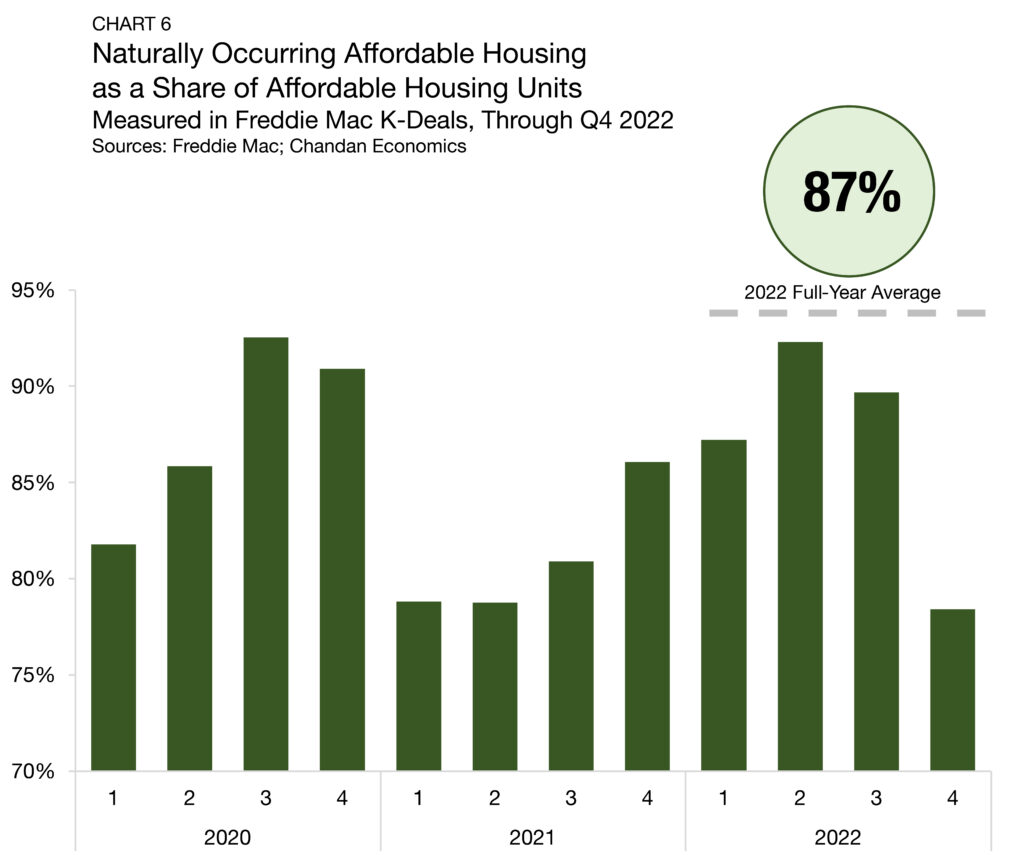
While most of the attention paid to the affordable housing sector focuses on regulation and policy intervention, the scale of the naturally occurring affordable housing (NOAH) supply is greater. By some estimates, NOAH outnumbers regulatory-supported units by a factor of four — a figure supported by Freddie Mac lending data. For multifamily loans originated in 2022, 87% of the units affordable at 80% or below of local AMI are NOAH properties (Chart 6).6 Moreover, on a quarterly basis, this share has ranged between 78% and 93% over the past three years.
In 2023, both Fannie Mae and Freddie Mac will have a $75 billion multifamily lending cap, with a direction that at least 50% of their loan volume is mission-driven lending, such as support for the creation and preservation of affordable housing, including NOAH. Given the lower regulatory burden associated with NOAH and the ample liquidity available in the space, investors remain optimistic about the growth of this sector in 2023. According to the 2023 ULI-PwC Emerging Trends in Real Estate, no residential sub-sector had a higher favorability rating for investment or development prospects than moderate-income/workforce housing.
What to Watch: Affordable Housing Creation Faces Challenges
Industry and advocacy-based priorities have uniquely converged on the issue of affordable housing in recent years, and the momentum has so far carried through 2023. On March 7, 2023, NMHC President Sharon Wilson Géno testified in front of the U.S. Senate Committee on Finance to discuss how tax policy could help reduce the supply-demand gap and increase housing affordability. In her remarks, Géno affirmed the multifamily industry’s push for an expansion of LIHTC incentives for adaptive reuse projects and easing regulatory rules for construction.
Géno’s testimony is timely, given the upcoming negotiations concerning the 2024 federal budget, which will likely include a significant push for affordable housing legislation. On March 13, HUD released the details of the Biden administration’s proposed budget for the agency that includes an expansion of the HCV program and a proposal to increase housing supply through a $300 million increase in the HOME Investment Partnerships Program (HOME), which is tasked with constructing and rehabilitating affordable rental housing.
Today’s divided U.S. Congress may make it more challenging to enact all of these spending priorities, but bipartisan interest in solving housing’s affordability crisis should give the issue traction on Capitol Hill.
Politics aside, market developments, including material cost inflation and tightening financial conditions, present potential headwind risks that investors should keep on their radar. Last year, vital progress was made toward affordable housing goals, but inflation and rising economic uncertainty threaten to weaken its long-term impact. As the affordable housing shortage continues growing, it will be critical for industry and political consensus to coalesce and translate into meaningful action.
For more affordable housing research and insights, visit arbor.com/articles
1 NLIHC defines ELI renters as those with “incomes at or below either the federal poverty guideline or 30% of their area median income, whichever is greater.”.
2 These data are released by the U.S. Department of Housing and Urban Development (HUD) and can be retrieved here. According to HUD, 2021 data are scheduled for release in Spring 2023.
3 LIHTC Equity Pricing Trends are calculated as a quarterly series by Chandan Economics. 4% LIHTC usage is displayed as a four-quarter moving average. Novogradac data are from Q1 2016 through Q4 2019. CohnReznick data are from the first quarter of 2020 through the fourth quarter of 2022.
4 Data presented in Chart 5 are displayed as a four-quarter moving average based on the date of initial endorsement.
5 Total is based on data retrieved from HUD’s Office of Policy Development and Research; data are through 2022.
6 According to a Chandan Economics analysis of Freddie Mac K-Deals.
Disclaimer
All content is provided herein “as is” and neither Arbor Realty Trust, Inc. or Chandan Economics, LLC (“the Companies”) nor their affiliated or related entities, nor any person involved in the creation, production and distribution of the content make any warranties, express or implied. The Companies do not make any representations regarding the reliability, usefulness, completeness, accuracy, currency nor represent that use of any information provided herein would not infringe on other third party rights. The Companies shall not be liable for any direct, indirect or consequential damages to the reader or a third party arising from the use of the information contained herein.


