As renters face a national shortage of 7 million low-income rental homes, the U.S. Department of Housing and Urban Development’s (HUD) Low-Income Housing Tax Credit (LIHTC) program is pivotal in helping to close the affordability gap for renters. It is the nation’s most significant resource for affordable apartment housing construction, which gives state and local agencies approximately $10 billion in annual budget authority to issue tax credits for affordable housing development.
Supply/Demand Imbalances Fuel Rising Valuations, Rents for Single-Family Product
Key Findings
- Cap rates ticked up to 6.0%, up from 5.9% the prior quarter
- Vacant-to-occupied rent growth accelerated to a new all-time high
- Purpose-built single-family rental (SFR) units accounted for 4.5% of single-family construction
State of the Market
If there were three real estate headlines to come out of the pandemic, they would focus on work-from-home trends, online retailing and single-family rentals (SFRs). By the end of 2021, the latter may be the only one of three to avoid some post-pandemic reversion. COVID-19 influenced which geographies and industries saw economic success in the past year and shifted housing preferences.
In major metropolitan areas, activity restrictions, acute job losses and public safety perceptions drove out residential demand — especially millennials with a loose attachment to their urban lifestyles. In adjacent suburban markets and smaller metros, demand sprang up as newly remote-working, former city dwellers sought a “new normal” amid a perplexing world event. SFR, a supply-constrained, still mostly mom-and-pop sector with a rapidly growing institutional presence, was uniquely positioned to absorb the sea change.
With SFRs now increasingly filling the role that starter homes had for previous generations, professional residential operators are quickly racing into the sector. According to Trepp, 2020 was the most active year for SFR securitizations on record, with new issuance topping $8.3 billion — a 99% increase from 2019 and a 9% increase from 2018’s previous record-high. Through mid-April, Trepp tracked $3.1 billion worth of newly securitized SFR CMBS, keeping 2021 on track to set a new record by year’s end. In line with these data, The Altus Group reports that institutional SFR operators are estimated to have purchased between 55,000 and 65,000 single-family homes last year, with 2021 forecasts landing north of 70,000.
All else equal, 2020 proved a banner year for the SFR sector. Before a real estate product type withstands its first recession, it is impossible to know for sure how it will perform during a downturn. The theory before the pandemic was that SFR was as recession resilient as they come and the past year confirmed just that. As the optionality of the single-family residential market grows to match that of the multifamily/condo space, professional SFR operators have their foot on the gas for what looks like yet another record-setting year.
Performance Metrics
Occupancy
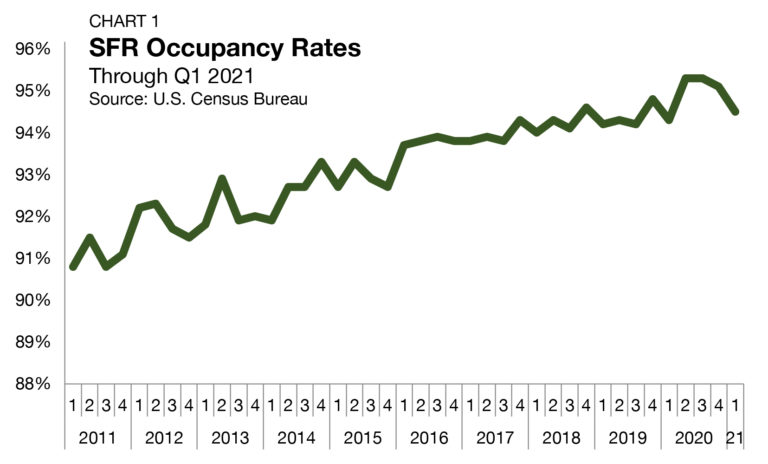
As measured by the U.S. Census Bureau, occupancy rates across all single-family rentals averaged 94.5% in the first quarter of 2021, ticking down by 40 basis points (bps) from the end of 2020 (Chart 1). Occupancy rates do tend to have a degree of seasonality, especially in recent history. In the first quarters of 2018, 2019 and 2020, the occupancy rate in SFR units dropped on a quarter-over-quarter basis, even as declining vacancies remained the long-term trend. Measured year over year, occupancy rates are up by a total of 20 bps.
Rent Growth
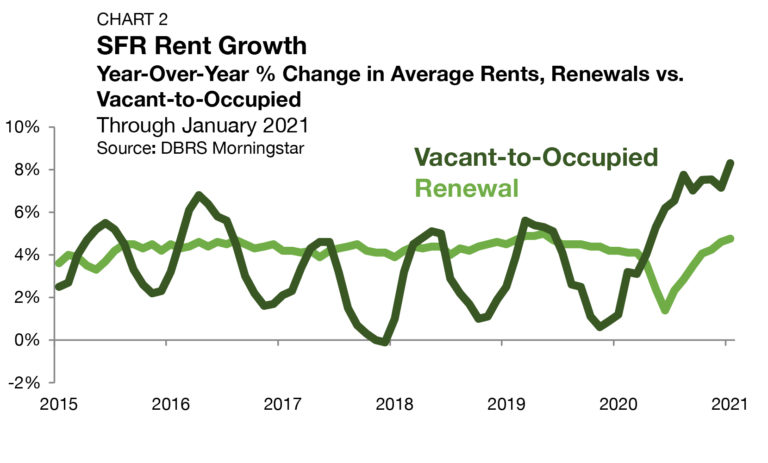
According to DBRS Morningstar, annual rent growth on vacant-to-occupied (V2O) SFR properties1 rose to its highest level on record, jumping by 115 bps to 8.3% in January, the latest month of data availability (Chart 2). After thawing from its winter-2019 hibernation, V20 units were on track to repeat their cycle of annual seasonality. In the spring of 2020 — the period of the year when SFR rent growth tends to accelerate — the normal cycle was interrupted by the pandemic. Once the shutdown lifted and households started to reorganize themselves based on COVID-era realities, rent growth in previously vacant single-family units started to warm up in a big way. By June 2020, annual rent growth reached 6.2%, its highest reading since May 2016, and continued its climb through the year’s end. Between May 2020 and January 2021, the pace of rent growth accelerated in seven of the nine months, reaching its new all-time high in January.
1Vacant-to-occupied (V20) units are single-family properties that were previously vacant and were recently leased by a new renter household. These units tend to adjust more quickly to seasonal and economic factors as they are not contractually tied to a base year rent and are free to adjust to prevailing market rents.
Annual rent growth for renewal properties rose by 17 bps to 4.8% in January, its highest level of annual growth since May 2019. Rent growth on lease renewals, which tends to see far less seasonal variability, fell between April and June 2020, dropping as low as 1.4% as landlords prioritized renter retention early in the pandemic. When landlords adjusted their pricing to match reinvigorated renter demand in mid-summer, rent growth intensified, climbing through the end of the year and into 2021.
Cap Rates & Prices
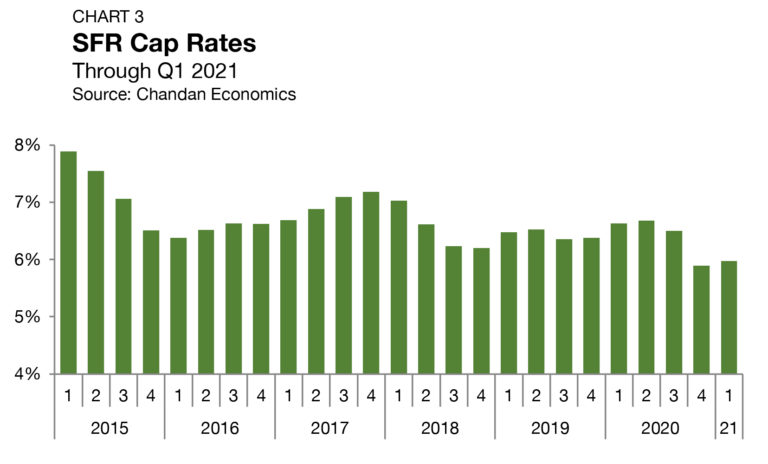
Property-level yields for SFR assets saw some upward pressure in the first quarter of 2021, partially reflecting rising benchmark interest rates. SFR cap rates began 2021 by ticking up to 6.0% — settling just above their record-low of 5.9% achieved the prior quarter.2 Measured quarter over quarter, cap rates rose by 9 bps (Chart 3). However, year over year, cap rates are down by a weighty 65 bps, reflecting both a firming outlook on the viability of the sector and an abundance of investment dollars chasing an undersupply of assets.
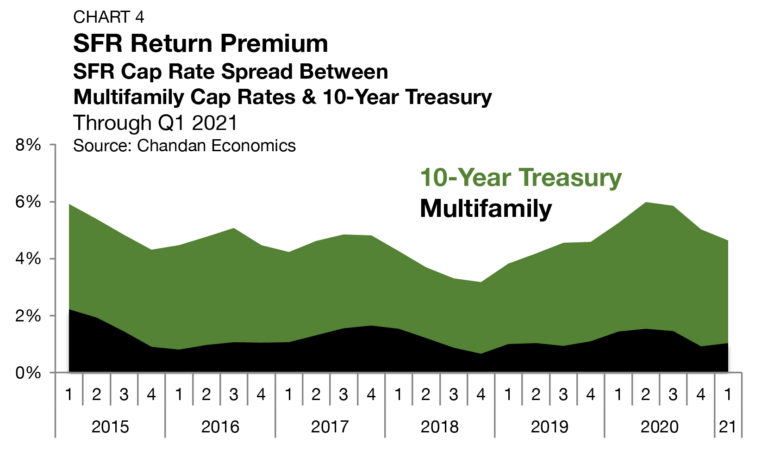
The yield spread between cap rates and the 10-year Treasury offers an estimate of the SFR risk premium (the amount of additional compensation needed to justify taking on the extra risk). In first-quarter 2021, this spread fell by 39 bps to 4.6% — the third consecutive quarterly decrease, as the risk premium settles back to near pre-pandemic levels (Chart 4). Spreads between SFR and multifamily cap rates ticked up to 1.0% in the first quarter, rising by 10 bps from the end of 2020. At the outset of the housing crisis, SFR return premiums routinely sat more than 5.0% above multifamily. The secular decline of the SFR-multifamily risk premium reflects the increased liquidity, commodification and efficiency introduced into the SFR sector over the past decade.
2Unless otherwise noted, all Chandan Economics data covering single-family rental cap rates, loan-to-value ratios and debt yields are based on model estimates and a sample pool of loans. Data are meant to represent conditions at the point of origination.
The single-family rental sector’s institutionalization has meant that new, purpose-built rentals are starting to contain differentiating characteristics from other single-family homes. However, the institutionally held slice of the SFR market is still dwarfed by individual investors, reflecting the sector’s infancy.
As of the Census Bureau’s 2018 Rental Housing Finance Survey (released in fall 2020), individual investors accounted for 72.5% of all SFR assets. The collection of LPs, LLC and LLPs accounted for another 15.7%. Between real estate corporations and real estate investment trusts, the share of institutionally controlled SFR assets totaled just 2.3%. While dedicated single-family build-to-rent communities and greater product heterogeneity are emerging trends, most current single-family rental properties look just like any other single-family home.
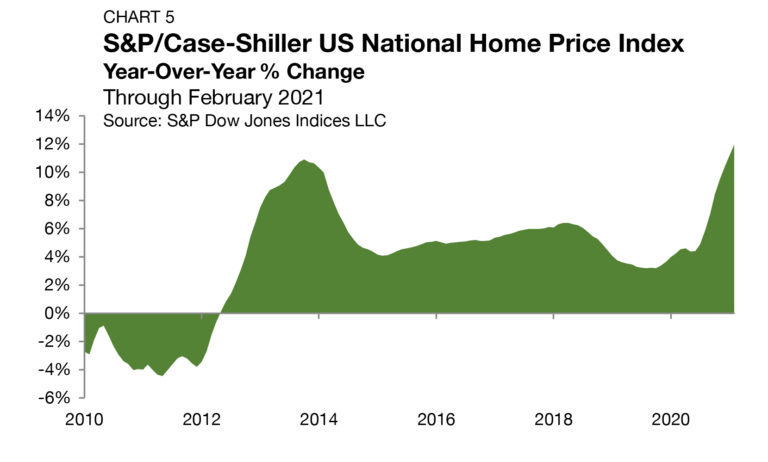
Across the U.S. housing market, prices are generally accelerating. According to the S&P Case-Shiller National Home Price Index, valuations are up by a substantial 12.0% from a year ago through February 2021 — the fastest rate of home price appreciation since 2006 (Chart 5). Home prices are surging due to an extreme undersupply of available inventory compared to current demand. According to the Census Bureau and the Department of Housing and Urban Development, as of March 2021 there were 3.6 months of supply available to buyers. Put another way, if no new housing units were put up for sale, it would take 3.6 months to exhaust available inventory down to zero. In April 2020, there were 6.8 months of supply available. Prior to this past year, the last time there was so little inventory relative to existing demand was in 2004.
LTVs
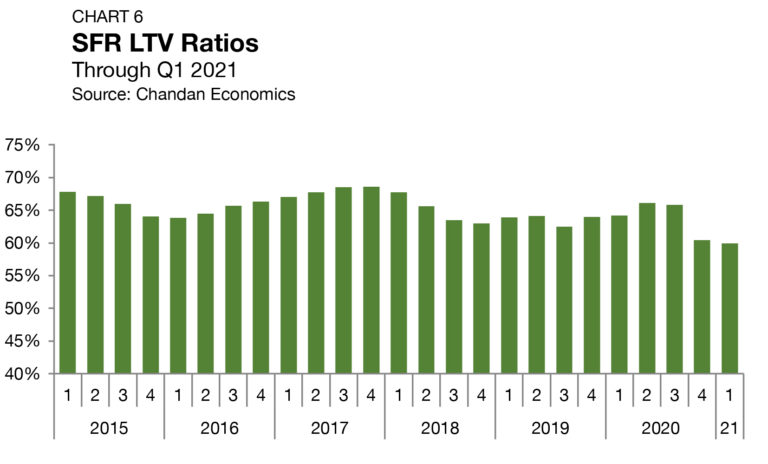
Loan-to-value ratios (LTVs) on SFR mortgages continued to fall in the first quarter of 2021, sliding 50 bps to 59.9% (Chart 6). While LTVs do tend to fall during recessions, the current decline is unique. Historically, a recessionary dip in LTVs would be caused by falling asset values, which, in turn, would prompt lenders to build in higher equity cushions to guard against potential defaults. In the current market, the continued downward pressure on LTVs is more reflective of accelerating asset values and modest conservatism from debt providers in a period of bullish volatility.
Debt Yields
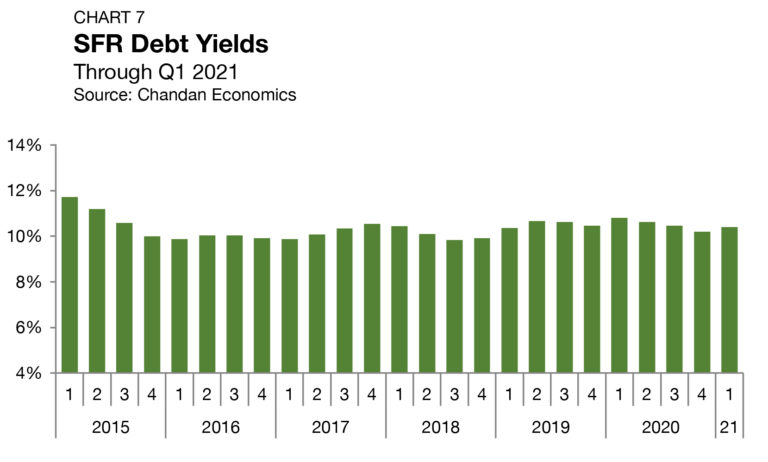
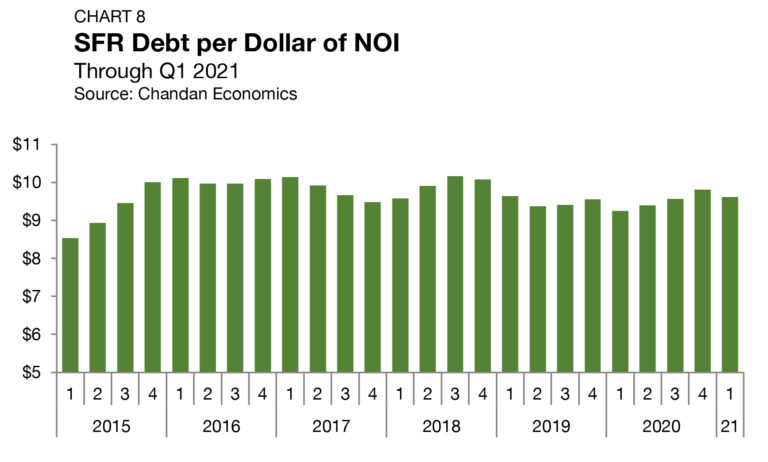
Debt yields nudged up by 26 bps between the fourth quarter of 2020 and the first quarter of 2021, settling at 10.4% (Chart 7). Debt yields have consistently sat between 9.8% and 10.8% since the middle of 2015. The inverse of debt yields, debt encumbrance per dollar of NOI, fell by 19 cents in first-quarter 2021, landing at $9.62 (Chart 8). These trends suggest that appetite for credit risk remains healthy despite the pandemic.
Supply & Demand Conditions
Residential Default Rates
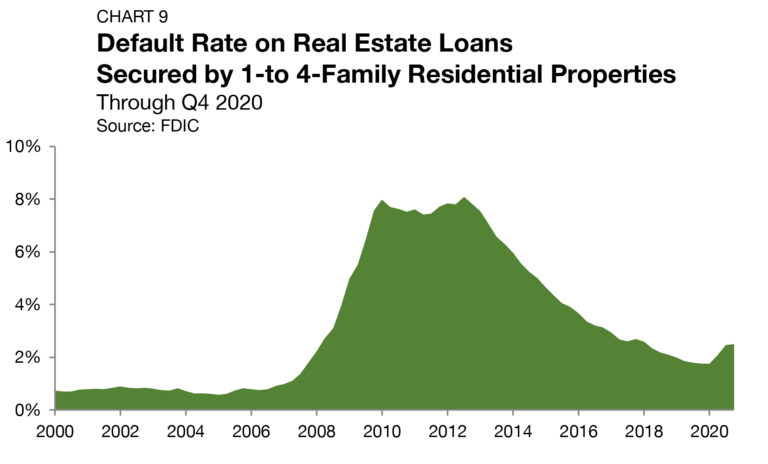
During the 2008 housing crisis, investors with available financing took advantage of the market dislocation, acquiring large portfolios of single-family assets at steep discounts. Mortgage default rates soared to 8.1%, and an abundance of buyers began seeding the SFR sector as we know it today (Chart 9).
In the fourth quarter of 2020 (the latest period of data availability), default rates rose by 3 bps to land at 2.5%. While default rates increased for three consecutive quarters, the pace of new distress is decelerating. In the second and third quarters of 2020, default rates rose by 31 bps and 39 bps, respectively. While the recent trajectory of rising defaults is a mild concern, the current scale of non-performance hardly reflects a distressed market in absolute terms. As of the end of 2020, default rates sat in line with levels last observed in early 2018. A categorical difference between this crisis and the Great Recession is that today’s housing market has an oversupply of potential buyers, and prices continue to rise. At-risk homeowners have a better menu of options this time around, namely the ability to sell into a seller’s market and greater access to refinance capital. While an increase in housing market defaults remains possible, the current market’s economics should limit the frequency and severity of distress.
Build-to-Rent
Purpose-built SFR properties, known as build-to-rent communities, continue to become a defining feature of the SFR sector, especially within the institutional slice of the market. However, as the industry has recognized the need for tailored supply pipelines, the strategies used to accomplish this added supply are diverse. Some operators add new units piecemeal, constructing a singular unit on each parcel of land, while others opt for large-scale community developments. The nonuniformity is leading to product differences in price, size and amenities offered. As a result, renters drawn to the asset class have a more robust set of options to meet their housing preferences.
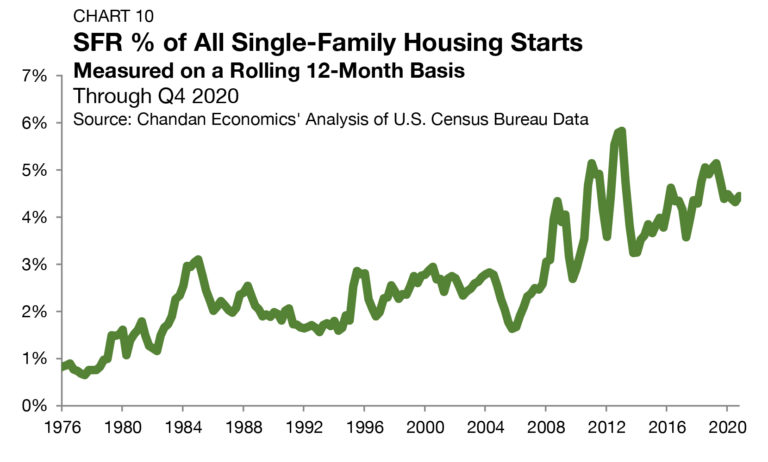
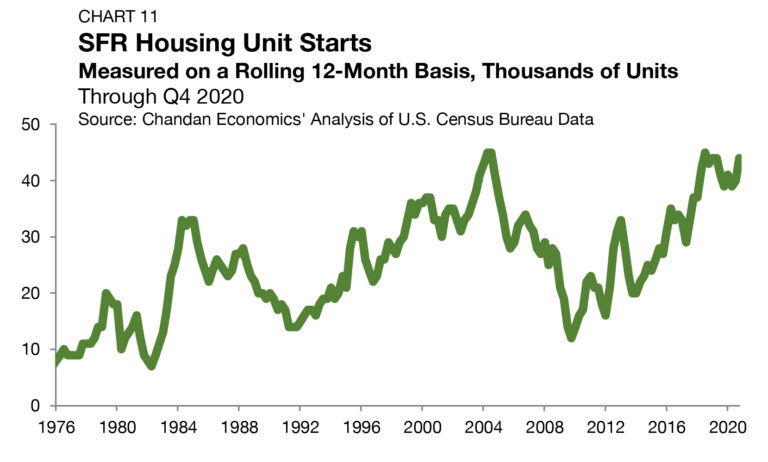
Based on an analysis of Census Bureau data, between 1975 and the start of the prior recession in 2007, SFRs accounted for a little less than 2.0% of all single-family construction (Chart 10). SFR’s share of single-family starts has since soared. In 2013, SFR’s construction share reached an all-time high of 5.8%. Today it remains elevated at 4.5%. SFR construction starts totaled 44,000 units through the 12 months ending in fourth-quarter 2020, up by 4,000 units from the previous period and only down 1,000 from its record high (Chart 11).
Tracking Future Demand
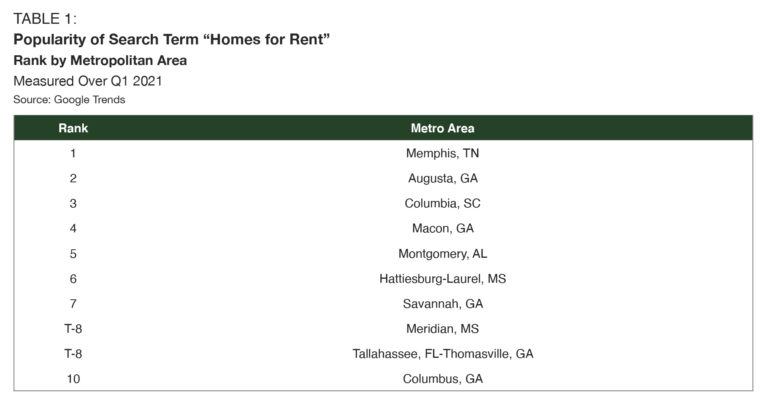
Utilizing Google Trends, the popularity of the search term “homes for rent” is leveraged as a proxy for hotspots of SFR demand. Metropolitan areas in the Southeast dominated the list throughout 2020, and there are no signs of that stopping through the first quarter of 2021. For the third consecutive quarter, Memphis, TN, charted the highest frequency of the search term. The metro consistently ranked near the top of the list in 2020, never falling below seventh.
According to the National Association of Realtors, listed home prices for units for sale in Memphis are up a weighty 13.6% from a year earlier through March 2021. Moreover, according to a Chandan Economics analysis of the Census Bureau’s 2019 American Community Survey, Memphis ranks second and third in the country for the highest SFR share of single-family households and the highest SFR share of rental households, respectively.3 Through 2019, 32.6% of all single-family households in the Memphis metro area were renters. Further, 64.2% of all rental households in the Memphis MSA lived in a single-family property.
Moving past Memphis, metro areas in Georgia are well-represented near the top of the rankings, with Augusta in third, Macon in fifth and Savannah in seventh. Taking the region as a whole, the Southeast is undisputed as the epicenter of SFR demand in 2021. Within the top 25 on the rankings list, there are only three occurrences of non-Southeast metro areas.
3Analysis limited to the top 100 MSAs by population.
Outlook
In the next few years, the SFR sector will mature into a period of linear growth from the non-linear trajectory that has categorized 2019 and 2020. However, that transition is highly unlikely to happen in 2021. The sector shows no signs of slowing down, as short-term economic factors and long-term demographics both support a step up in demand for professionally managed single-family housing units.
According to survey data from National Apartment Association, Gen Zers have a higher preference for vibrant suburban life than the millennial cohort that precedes them.4 The survey results indicate that 43% of Gen Zers want to rent single-family homes following the completion of their university education. With the current age range of Gen Z spanning six to 24 years old, the first wave of this cohort is just now starting to make an impact on rental housing demand. These results come as the JBREC/NRHC Single-Family Rental Market Index, a measure of overall SFR market activity, reached an all-time high in fourth-quarter 2020. It’s clear the SFR sector remains uniquely positioned to benefit from the impacts of the COVID-related recession, and with its countercyclical resiliency now demonstrated, the year ahead is poised for exceptional growth.
4National Apartment Association survey was completed in partnership with Statisfacts/Apartment Ratings
For more single-family rental research and insights, visit arbor.com/blog
Disclaimer
All content is provided herein “as is” and neither Arbor Realty Trust, Inc. or Chandan Economics, LLC (“the Companies”) nor their affiliated or related entities, nor any person involved in the creation, production and distribution of the content make any warranties, express or implied. The Companies do not make any representations regarding the reliability, usefulness, completeness, accuracy, currency nor represent that use of any information provided herein would not infringe on other third party rights. The Companies shall not be liable for any direct, indirect or consequential damages to the reader or a third party arising from the use of the information contained herein.