As renters face a national shortage of 7 million low-income rental homes, the U.S. Department of Housing and Urban Development’s (HUD) Low-Income Housing Tax Credit (LIHTC) program is pivotal in helping to close the affordability gap for renters. It is the nation’s most significant resource for affordable apartment housing construction, which gives state and local agencies approximately $10 billion in annual budget authority to issue tax credits for affordable housing development.
Record Demand Sends Rents, Values Soaring as More Institutional Players Enter the Space
Key Findings
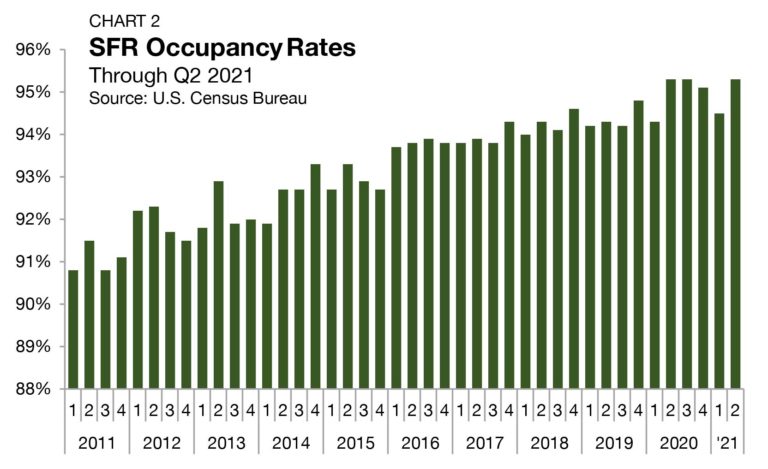
- Occupancy rates rose to 95.3%, matching the highest level since 1994
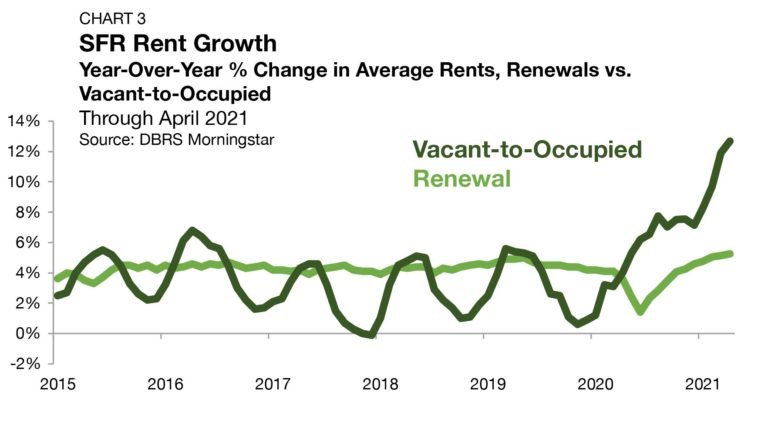
- Vacant-to-occupied (V20) rent growth accelerated to 12.7%, a record high
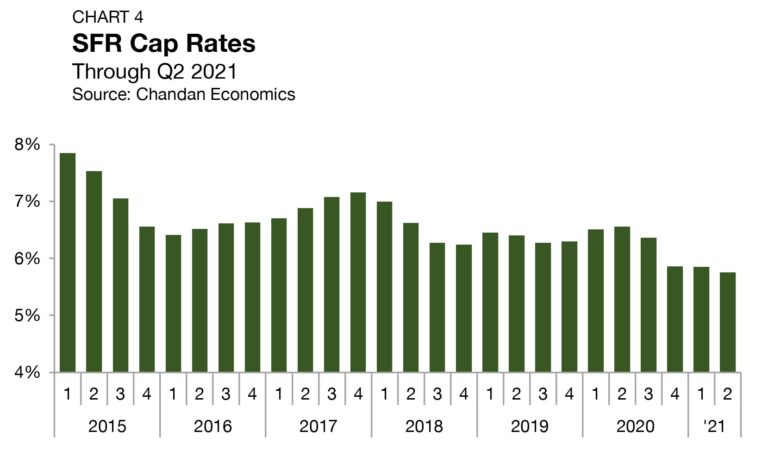
- Cap rates dipped to 5.8% amid rising asset valuations
State of the Market
The single-family rental sector (SFR) remained strong in the second quarter of 2021, with most indicators pointing to a solid expansion as the broader economy rebounds. Heading into the pandemic, the sector was already enthralled in a period of record growth, as rising technological efficiencies and growing institutional participation led to greater professionalization. In recent months, several high-profile acquisitions and capital raises have taken place.
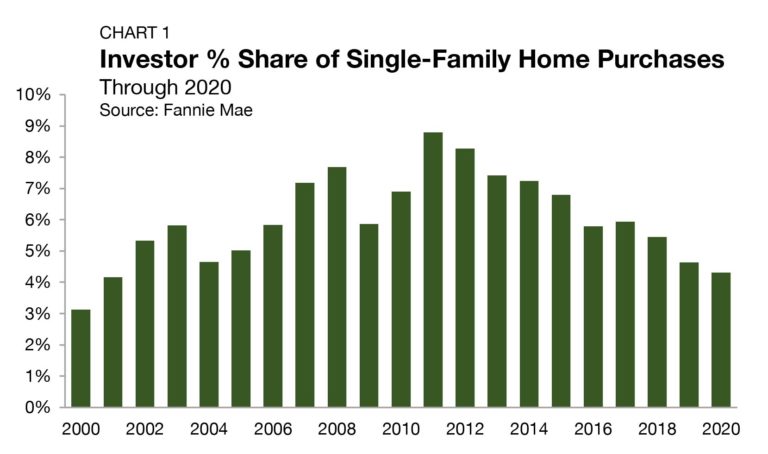
Despite growing investment and attention in the national press, through 2020, there is little evidence that SFR operators have crowded out potential homebuyers in recent years. According to a Chandan Economics analysis of Fannie Mae securitized mortgages, the percentage of single-family units acquired by investors (a proxy for SFR) has declined consistently since peaking at 8.8% in 2011 (Chart 1).1 The investor percentage of newly acquired single-family units was 4.3% in 2020, falling 30 basis points (bps) from a year earlier.
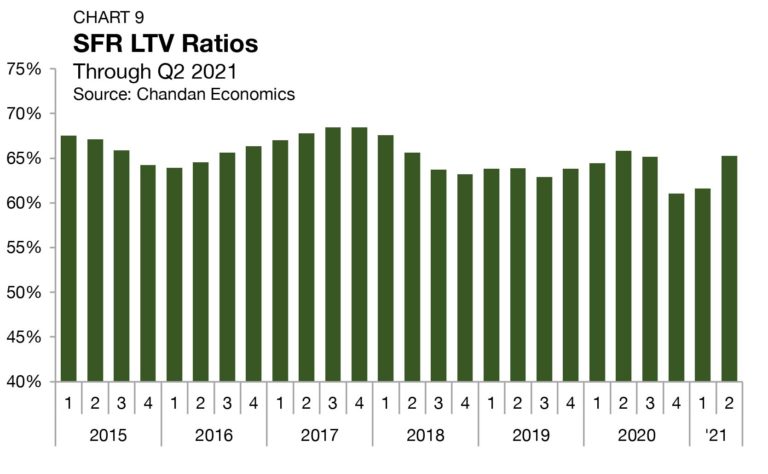
All else equal, the SFR sector is firing on all cylinders. Loan-to-value ratios (LTVs) were the only SFR-specific criteria to see some pandemic-related deterioration, and they have already quickly returned to pre-COVID levels. Record demand is leading to declining cap rates and surging rent growth, and the need to add purpose-built SFR supply is persistent. All signs are pointing to sustained growth for the SFR sector as it continues to both mature and evolve.
1Data are retrieved from Fannie Mae’s Data Dynamics Portal.
Performance Metrics
Occupancy
As measured by the U.S. Census Bureau, occupancy rates across all single-family rentals averaged 95.3% in the second quarter of 2021, rising by 80 bps from the first quarter (Chart 2). The second-quarter reading brings SFR occupancy rates back to their generational highs, matching the same level from one year ago.
Rent Growth
Annualized rent growth on vacant-to-occupied (V2O) SFR properties consecutively hit record levels in March and April, the latest months of data availability, according to DBRS Morningstar.2 April’s reading of 12.7% was the highest mark since tracking began in 2015 (Chart 3).
2Vacant-to-occupied (V20) units are single-family properties that were previously vacant and were recently leased by a new renter
household. These units tend to adjust more quickly to seasonal and economic factors as they are not contractually tied to a base year rent
and are free to adjust to prevailing market rents.
V2O rent growth has been surging since second-quarter 2020, as a tight housing market placed upward pressure on rents. Since May 2020, annualized monthly rent growth has averaged 8.1%, compared to a historical average of 3.3% over the metric’s lifetime.
For lease renewals, rent growth reached a record 5.2% annualized rate in April, the latest month of data availability. April’s reading is the third consecutive month when rent growth was 5.0% or higher, a level only reached once prior to 2021. Rents for renewals, which tend to see far less seasonal variability, fell dramatically at the onset of the pandemic, reaching as low as 1.4% in June 2020 — a sign that landlords were prioritizing tenant retention. It has since accelerated in each successive month, though momentum started to normalize as the economic recovery picked up.
At the metro-level, the Sun Belt has dominated SFR rent growth over the past year. According to CoreLogic’s Single-Family Rent Index (SFRI), the Arizona metros of Phoenix and Tucson saw the largest annual jump in SFR rents, climbing by 12.2% and 10.6%, respectively, from April 2020 through April 2021. Las Vegas posted the third highest one-year increase of 9.3%, followed closely by Atlanta (9.1%) and Austin (8.5%) rounding out the top five. Of the 20 metros in the analysis, only Boston and Chicago posted declining annual SFR rents, falling 5.9% and 2.6%, respectively.
Cap Rates
Property-level yields for SFR assets ticked down in the second quarter of 2021, reflecting strong investor demand and asset price growth. Through the second quarter of 2021, SFR cap rates averaged 5.8%, down 10 bps from the previous quarter and a weighty 81 bps from the same time last year (Chart 4).3
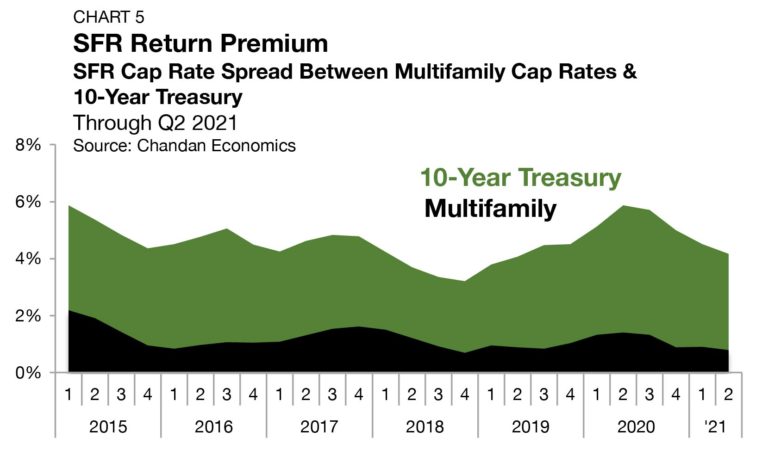
The second-quarter reading marks the lowest observed cap rates since Chandan Economics began tracking the sector in 2011. The yield spread between cap rates and the 10-year Treasury offers an estimate of the SFR risk premium (the amount of additional compensation investors need to justify taking on the extra risk). In the second quarter, this spread fell by 35 bps to 4.2% — the fourth consecutive quarterly decrease (Chart 5)
3 Unless otherwise noted, the Chandan Economics data covering single-family rental cap rates, loan-to-value ratios and debt yields are
based on model estimates and a sample pool of loans. Data are meant to represent conditions at the point of origination.
This risk premium is now in line with pre-pandemic levels, reaching the lowest rate since the second quarter of 2019. The cap rate spread between SFR assets and multifamily properties fell to an all-time low in the second quarter of 2021, declining by 12 bps to settle at just 0.8%. In the past year, the spread has declined by a sizeable 63 bps. Moreover, it was still less than 10 years ago when SFR cap rates were more than 500 bps higher than multifamily averages — a function of the U.S. housing market’s return to health and the professionalization of the single-family rental sector, even among smaller operators.
Pricing
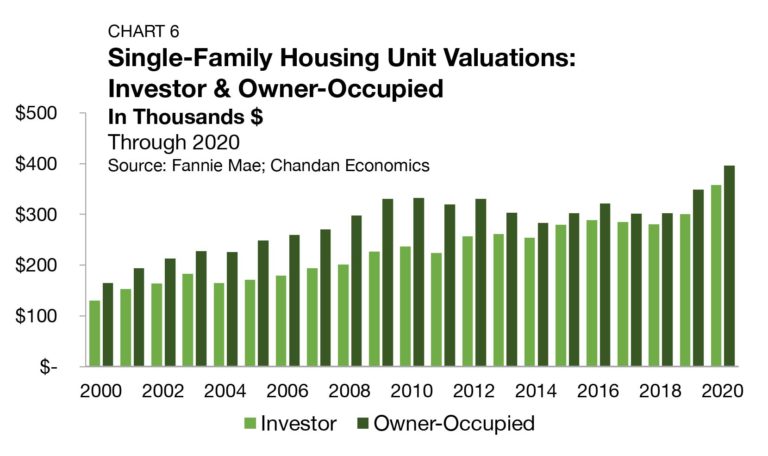
According to a Chandan Economics analysis of Fannie Mae securitized mortgages, there are material differences between the average assessed property values on mortgages originated to single-family owner-occupants versus single-family investors. Through 2020, the average underwritten value of a single-family investment property was $357,950 (Chart 6). Meanwhile, for owner occupied single-family properties, the valuation sat 9.7% higher at $396,293.
There are likely several factors that could explain this valuation gap. The first could be differing investment strategies, as many investors are targeting value-add assets rather than paying top dollar for value that already exists. A second group of potential contributing factors can be found at the property level. Investor-owned SFR properties often have vacancy, turnover and management-related expenses that owner-occupied units do not have to account for, which could also contribute to lower values for the rental units. Finally, financing for investment units is often more expensive than owner-occupied units, all else equal, which would also affect the valuation and explain part of the valuation difference.
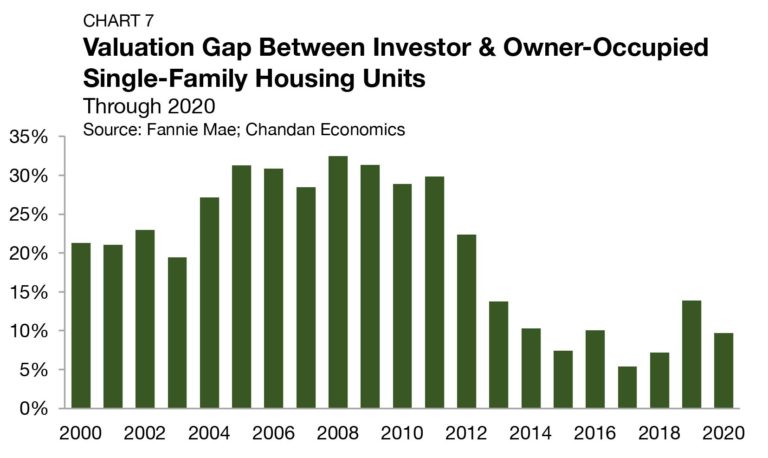
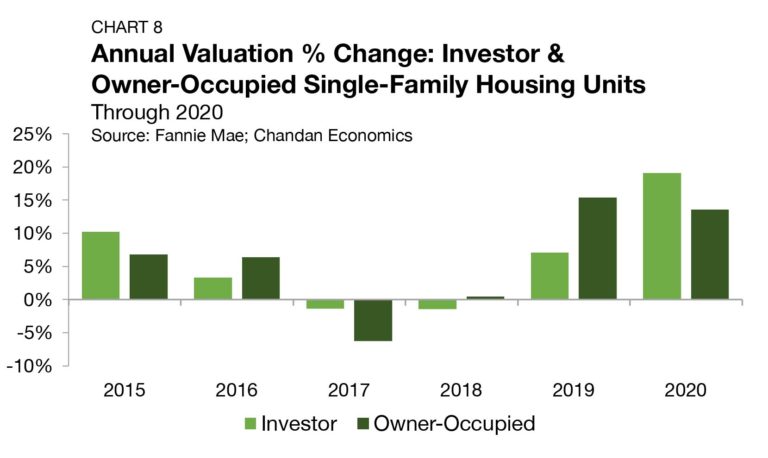
Between 2004 and 2011, the valuation gap sat in a consistent range of 27.2% to 32.5% (Chart 7). As more investors and capital entered the SFR space, discounted units became harder to find, and competition for inventory ramped up. The valuation gap fell to an all-time low of 5.4% in 2017 and has moderated in the following years. The closing valuation gap comes as average valuations on SFR properties have risen more quickly than owner-occupied single-family properties in three of the last five years, including in 2020. According to these data, the valuation of investment single-family properties grew by 19.1% last year, outperforming owner-occupied single-family properties by 5.5% (Chart 8).
Credit Trends
LTVs on SFR mortgages increased in the second quarter of 2021, surging by 362 bps — the largest observed one-quarter increase post-Great Financial Crisis (Chart 9). The rapid rise in LTVs is a welcome sign of credit risk normalizing as the economy recovers. LTVs held up through the middle of last year, as SFR lenders remained cautious despite surging demand for housing that led to appreciably higher prices. In the fourth quarter of 2020, SFR LTVs reached a low of 61.0%, declining by 481 bps in half a year. The second-quarter 2021 reversion brings LTVs back within pre-pandemic range and signals confidence in the economic recovery and the housing market, even as stabilizing government policies are slowly removed.
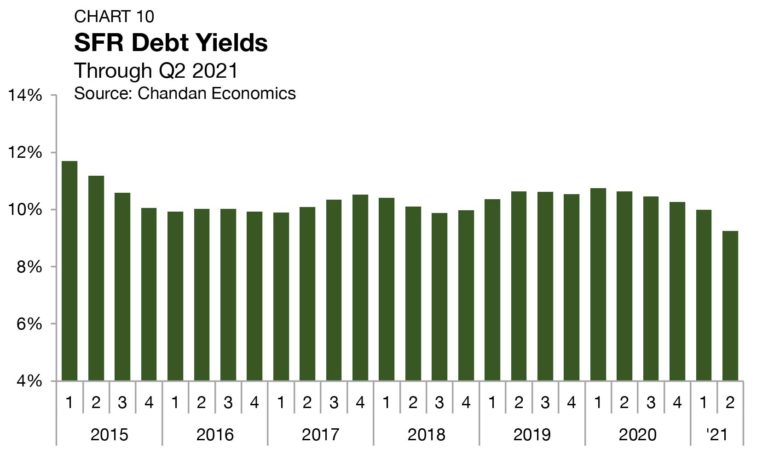
Debt yields fell by 75 bps between the first and second quarters of 2021, settling at 9.2% — the lowest rate on record (Chart 10). The drop in debt yields translates to SFR investors securing more debt capital for every dollar of property-level net operating income (NOI). Through the second quarter of 2021, SFR debt increased to $10.82 for every dollar of NOI, a $0.81 increase from the prior quarter and a $1.42 increase from this time last year.
Supply & Demand Conditions
Residential Default Rates
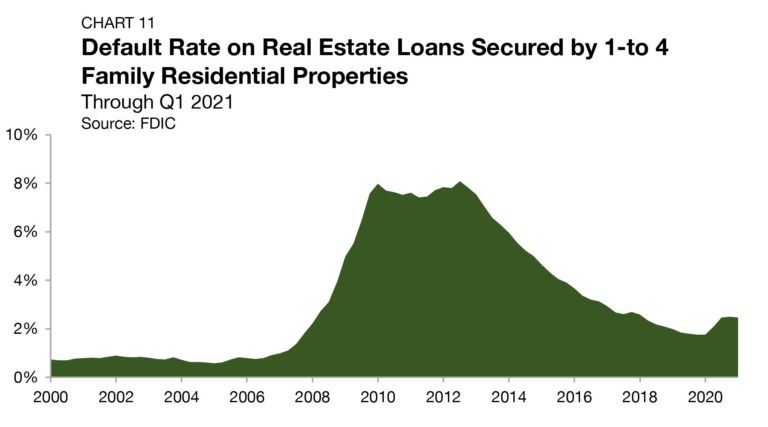
During the 2008 housing crisis, investors with available financing took advantage of the market dislocation, acquiring large portfolios of single-family assets at steep discounts. According to the Federal Deposit Insurance Corporation (FDIC), mortgage default rates peaked at 8.1% in 2012, leading to an abundance of investor acquisitions and the beginning of the SFR sector as we know it today (Chart 11).
While home finances were stretched during the pandemic and many households are still behind, they have not translated into a wave of distress. Even as the federally extended measures of forbearance are coming to an end, most analyses do not forecast a rise in serious delinquencies resembling anything near Great Financial Crisis levels. Through the first quarter of 2021, the latest quarter of FDIC data availability, default rates across most banks have stabilized at 2.5% — 70 bps higher than the same time one year ago, though 4 bps lower than the previous quarter.
Build-to-Rent
Purpose-built SFR properties, known as build-to-rent communities, continue to become a defining feature of the SFR sector, especially within the institutional slice of the market.
However, as the industry has recognized the need for tailored supply pipelines, the strategies used to meet the demand are diverse. Some operators add new units piecemeal, constructing a singular unit on each parcel of land, while others opt for large-scale community developments. The nonuniformity is leading to product differences in price, size and amenities offered. As a result, renters drawn to the asset class have a more robust set of options to meet their housing preferences.
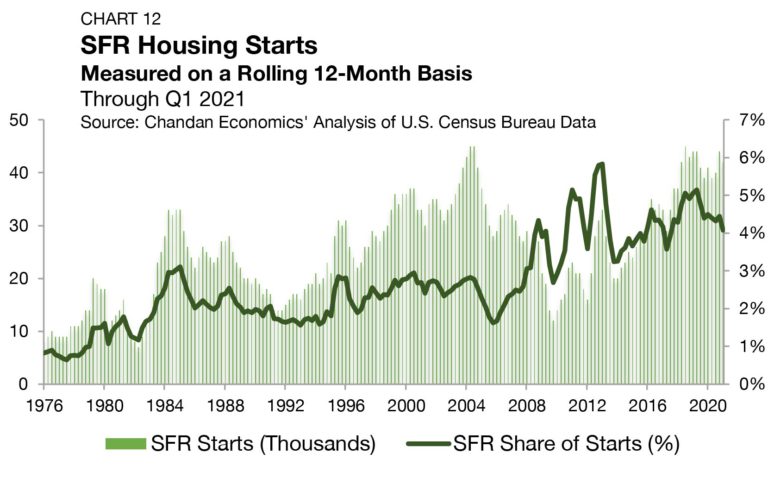
Based on an analysis of Census data, between 1975 and the start of the prior recession in 2007, SFRs accounted for a little less than 2.0% of all single-family construction starts (Chart 12). SFR’s share of single-family starts has since settled into a consistently higher range. In 2013, SFR’s percentage share of construction starts reached an all-time high of 5.8%, and through first-quarter 2021, the share remained elevated at 4.1%.
Tracking Demand
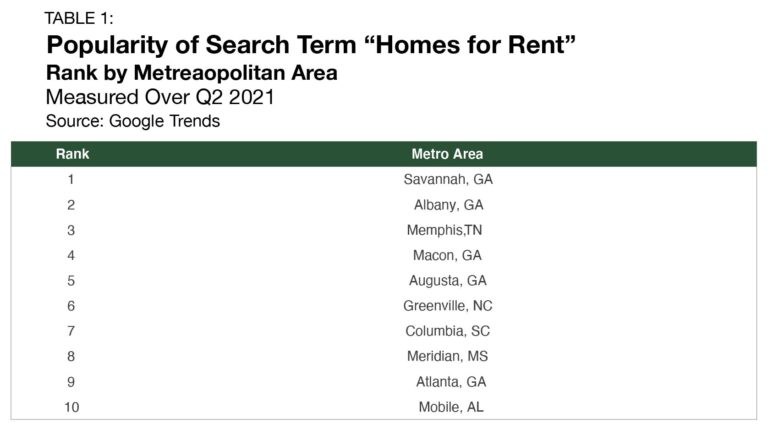
Utilizing Google Trends, the popularity of the search term “homes for rent” is leveraged as a proxy for hotspots of SFR demand. Savannah, GA was the most popular area where the term was searched during the second quarter of 2021, dethroning Memphis, TN, which had seen the highest search in the previous period (Table. 1).
Sun Belt markets are continuing to dominate the list in 2021, much as they had through 2020. Institutional SFR strategies are most concentrated in the Sun Belt as there is a greater availability of buildable land, allowing operators to develop full rental communities. Moreover, the Sun Belt is experiencing population growth well above the national average, which should continue to support rental demand and regional economic growth.
Outlook
Fueled by population and economic growth in geographies best suited for the product-type, single-family rental strategies are enjoying unprecedented success. Measures of occupancy, rent growth and valuation are at their all-time highs. These results come as the JBREC/NRHC Single-Family Rental Market Index (SFRMI), a measure of overall SFR market activity, reached another all-time high in the first quarter of 2021. Further, the SFRMI Survey indicated that operators are extremely upbeat on their assessments of current leasing activity and their forecast for leasing activity six months ahead.
The SFR sector remains uniquely positioned to benefit from structural and cyclical forces, including filling a significant needs gap for affordable access into suburban housing markets, especially for younger families. All told, the SFR sectors recent run of success is both impressive and has yet to show any signs of slowing down.
For more single-family rental research and insights, visit arbor.com/blog
Disclaimer
All content is provided herein “as is” and neither Arbor Realty Trust, Inc. or Chandan Economics, LLC (“the Companies”) nor their affiliated or related entities, nor any person involved in the creation, production and distribution of the content make any warranties, express or implied. The Companies do not make any representations regarding the reliability, usefulness, completeness, accuracy, currency nor represent that use of any information provided herein would not infringe on other third party rights. The Companies shall not be liable for any direct, indirect or consequential damages to the reader or a third party arising from the use of the information contained herein.