Articles

Annual Build-to-Rent Starts Hit Another High in Q3 2024

As more single-family rental (SFR) operators rely on build-to-rent (BTR) development to supply new inventory, construction starts have steadily risen, reaching another record high in the third quarter of 2024. SFR/BTR construction has eclipsed 92,000 units in the last four quarters — an all-time high and an annual increase of 31.4%.

Articles

LIHTC Program: An Impactful Affordable Housing Financing Resource

As renters face a national shortage of 7 million low-income rental homes, the U.S. Department of Housing and Urban Development’s (HUD) Low-Income Housing Tax Credit (LIHTC) program is pivotal in helping to close the affordability gap for renters. It is the nation’s most significant resource for affordable apartment housing construction, which gives state and local agencies approximately $10 billion in annual budget authority to issue tax credits for affordable housing development.

Articles

FHFA Loan Caps for 2025: What Multifamily Borrowers Need to Know

The Federal Housing Finance Agency (FHFA) announced a $3 billion boost to Fannie Mae and Freddie Mac’s volume cap for loan purchases in 2025 to $146 billion ($73 billion for each agency). This increase in FHFA loan caps for 2025 aligns with industry expectations, given the anticipation of improving market conditions and lending activity expected in a lower interest rate environment. Next year’s cap for the Government-Sponsored Entities (GSEs) is an increase of approximately 4% from the $140 billion limit set for 2024.

Analysis

U.S. Multifamily Market Snapshot — November 2024

The U.S. multifamily market held steady in a more normalized cycle through the first three quarters of 2024, following its skyrocketing recovery from the pandemic-related contraction. Rental demand remained strong, driven by the continued nationwide housing shortage and strong wage growth, while the high levels of new construction seen over the last two years appears to have peaked.

Current Reports

Small Multifamily Investment Trends Report Q4 2024

Small multifamily’s normalization pushed forward last quarter as the Federal Reserve made a long-awaited reduction to the target federal funds rate. Arbor’s Small Multifamily Investment Trends Report Q4 2024, developed in partnership with Chandan Economics, shows signs of stability have multiplied. Robust rental demand, a limited supply of quality affordable housing, and several other promising developments should support the subsector’s strength heading into 2025.

Analysis

Top U.S. Multifamily Rent Growth Markets — Q3 2024

The U.S. multifamily market held steady in a more normalized cycle during the third quarter of 2024. Rental demand remained strong, while new leaders emerged among the top markets for rent growth.

Articles

Top Markets for Wage Growth in 2024

One of the most essential factors multifamily investors need to consider before executing a transaction is the health of the local labor market. Wage growth and other trends are driven by a delicate, constantly adjusting balance of labor supply and demand. In some markets, an inflow of employers can cause wages to spike. In others, population outflows can create the same effect. In this deep dive, we expand on the data findings from the 2024 Top Markets for Multifamily Investment Report, exploring the unique conditions driving metro wage growth trends.

Press Contact

Press Contact If you are a member of the media and would like to arrange an interview with one of our knowledgeable multifamily and commercial real estate finance executives or if you have general media questions about Arbor, please contact us at [email protected] or through the below form.   Fill out the form to reach our press team.  

General: 800.ARBOR.10

Q4 2021
Single-Family Rental
Investment Trends
Report

Cap Rates Reach New Lows as Build-to-Rent Construction Accelerates

Key Findings

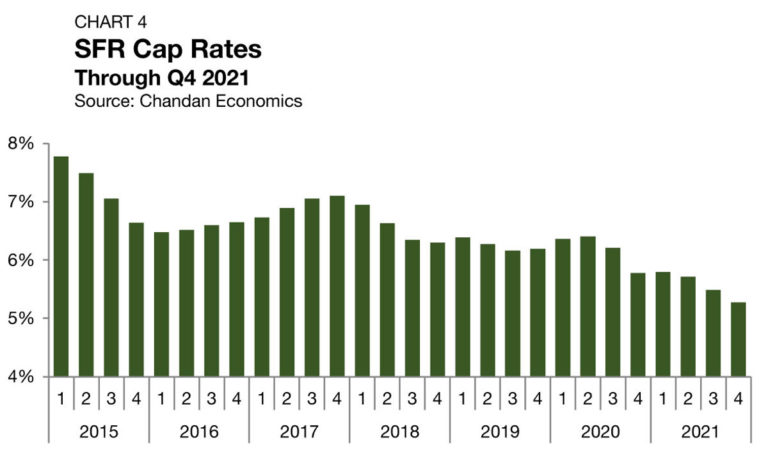
  • Cap rates dipped to 5.3% in fourth-quarter 2021 — a new all-time low
  • Vacant-to-occupied (V2O) annual rent growth remains robust, hitting 13.5% through October
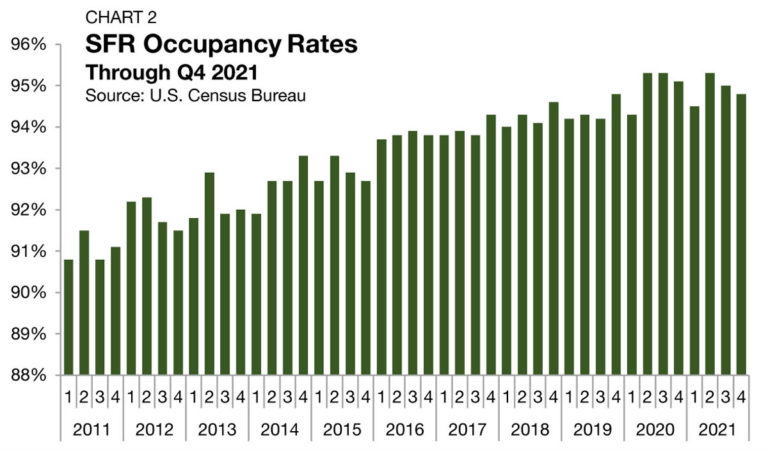
  • Occupancy rates edge down to 94.8% in the third quarter, just 50 bps off their generational high

State of the Market

The single-family rental sector (SFR) enjoyed its best year on record in 2021, as demographic and pandemic-related forces combined with growing investment enthusiasm.

The sector’s decade-long trend of institutionalization has accelerated over the past year. According to Finsight, SFR CMBS issuance reached a record $16.6 billion in 2021— nearly doubling 2020’s total of $8.9 billion.

Despite the recent impressive growth, the sector looks ready to continue growing rapidly. According to a recent survey of 3,300 renters by RentCafe, nearly 4-out-5 respondents would consider moving into an SFR community. Further, current housing market conditions will likely mean that the transition into ownership will be increasingly complex over the medium term. Home prices have already surged to new peaks, and 30-year fixed mortgage rates have started to rise, reaching their highest levels since before the pandemic as of January 2022. According to the National Association of Home Builders, the share of prospective home buyers looking to buy a home in the next 12-months has dropped for two consecutive quarters through the end of 2021.

On balance, the demand for single-family housing in the U.S. has only increased throughout the pandemic while access to ownership has not. Single-family rentals have helped to fill the gap, providing accessible housing options in suburban neighborhoods with family-centric amenities. Nationally, the SFR sector remains in growth mode with many supportive tailwinds.

Performance Metrics

Originations
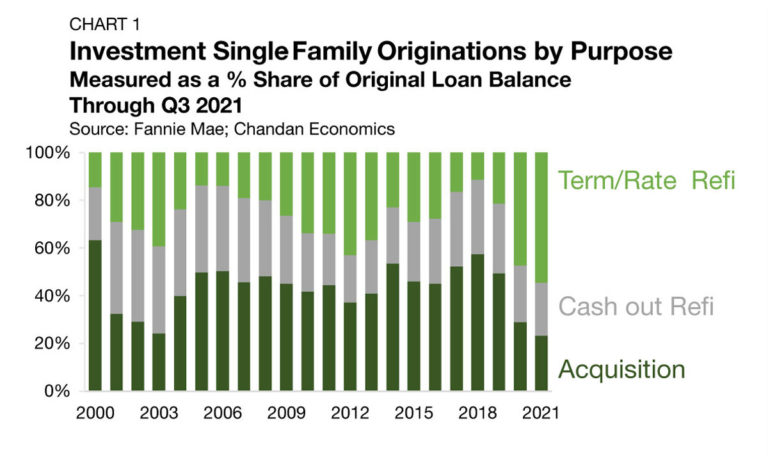
According to a Chandan Economics analysis of Fannie Mae data, a lending source for mostly non-institutional borrowers, refinancing, instead of acquiring, has accounted for the significant majority of recent originations to single-family investors. In 2020, refinancing activity accounted for 71.0% of tracked originations. Through the third quarter of 2021, the refinancing share was even higher, reaching up to 76.7%— its highest percentage on record (Chart 1). As recently as 2018, originations for acquisitions still accounted for most lending activity. However, with borrowing rates falling to new all-time lows in recent years and through the pandemic, investors have seized the opportunity to lock in lower financing rates. Notably, rate-and-term refinancings have accounted for 54.6% of all originations and a weighty 71.2% of refinancings in 2021, a sign that investors are locking into low interest rates ahead of the Federal Reserve’s anticipated monetary tightening.

Occupancy
As measured by the U.S. Census Bureau, occupancy rates across all SFRs averaged 94.8% in the fourth quarter of 2021, dipping by 20 basis points (bps) from the third quarter (Chart 2). The fourth-quarter reading brings the SFR occupancy rate 50 bps off their generational highs, though it still indicates that the sector is operating at or near full potential occupancy.
Rent Growth
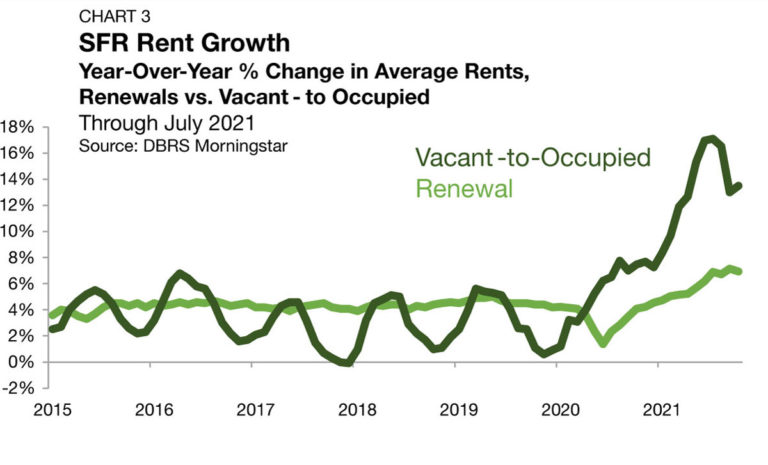
Annualized rent growth on vacant-to-occupied (V2O) SFR properties remains robust, though it has started to slow 1. According to DBRS Morningstar, V2O annual rent growth reached an all-time high of 17.1% in July 2021 before retreating in August and September (Chart 3). Through October 2021, the last month of available data, V2O annual rent growth sits at 13.5%— 359 bps off the July peak but still 670 bps higher than any pre-pandemic reading. The 2021 surge in V2O rents coincides with a historic rise in home property values. According to the S&P/Case-Shiller Home U.S. National Home Price Index, annual home price appreciation reached a high watermark of 19.0% in August.

For lease renewals, annual rent growth hit a record high in September 2021, reaching up to 7.2%. Through October, the latest month of available data, average rents in lease renewals are up by 6.9% from a year earlier. Between 2015 and the onset of the pandemic in 2020, SFR renewal rent growth consistently ranged between 3.3% and 5.0%. Since February 2021, SFR renewal rent growth has topped the 5.0% mark in nine consecutive months of observations.

Unsurprisingly, the Sun Belt has maintained its SFR rent growth dominance over the past year at the metro level. According to CoreLogic’s Single-Family Rent Index (SFRI), annual rent growth across the top 20 U.S. metros through November was highest in Miami, Phoenix, and Las Vegas, climbing by 33%, 19%, and 17%, respectively. According to a recent report by Redfin, the trio of Miami, Phoenix, and Las Vegas account for the three U.S. metros with the highest net inflows of new residents.
1 Vacant-to-Occupied (V2O) units are single-family properties that were previously vacant and were recently leased by a new renter household. These units tend to adjust more quickly to seasonal and economic factors as they are not contractually tied to a base year rent and are free to adjust to prevailing market rents.
Cap Rates
Property-level yields for SFR assets continued to compress in the fourth quarter of 2021, reflecting that growing investor demand continues to outpace the delivery of new SFR supply. Through the fourth quarter of 2021, SFR cap rates averaged 5.3%, down 21 bps from the previous quarter and down 50 bps from the same time last year (Chart 4) 2. The fourth-quarter reading marks the lowest observed cap rates since Chandan Economics began tracking the sector in 2011. Moreover, SFR cap rates have fallen for four consecutive quarters after marginal increases in 2020.
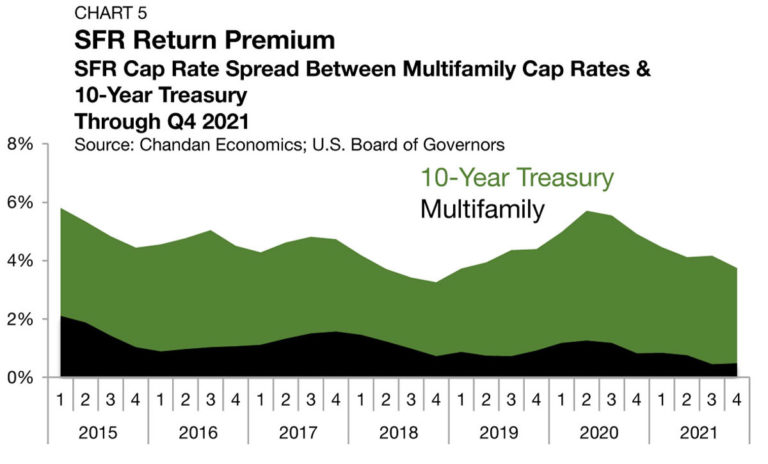
The yield spread between SFR cap rates and the 10-year Treasury estimates the SFR risk premium. This spread narrowed as Treasurys rose and SFR yields fell in the fourth quarter. In total, the risk premium sank 42 bps from the previous quarter to land at 3.7%— the lowest level since early 2019. Moreover, the risk premium is down by a weighty 117 bps from one year ago. The cap rate spread between SFR assets and multifamily properties ticked up by 3 bps in the fourth quarter of 2021, settling at 48 bps. In the prior quarter, the cap rate spread hit an all-time low of 45 bps. The marginal increase in the latest data comes as cap rates for multifamily properties fell more significantly than the decline measured for SFR assets to close the year. Measured from one year earlier, the cap rate spread between the two asset types is down by 33 bps. Over the past decade, SFR/multifamily cap rate spreads have narrowed from a high of 496 bps in 2012 to the current sub-50 bps levels observed today. In addition to capital inflows, tech adoption, namely smart home technologies and property management software, have allowed the sector to achieve critical operating efficiencies, reducing risk.
2 Unless otherwise noted, the Chandan Economics data covering single-family rental cap rates, loan-to-value ratios, and debt yields are based on model estimates and a sample pool of loans. Data are meant to represent conditions at the point of origination.
Pricing
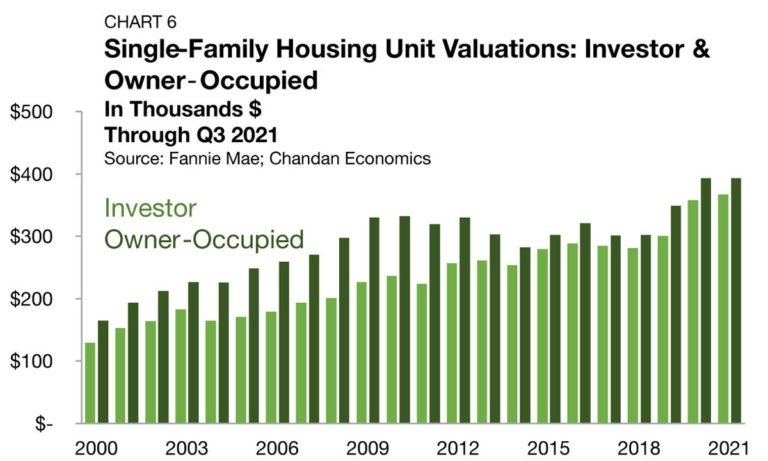
According to a Chandan Economics analysis of Fannie Mae securitized mortgages, there are material differences between the average assessed property values on mortgages originated to single-family owner-occupants versus single-family investors. Through the third quarter of 2021, the average underwritten value of a single-family investment property last year has averaged $367,250 compared to $407,387 for owner-occupied units (Chart 6).
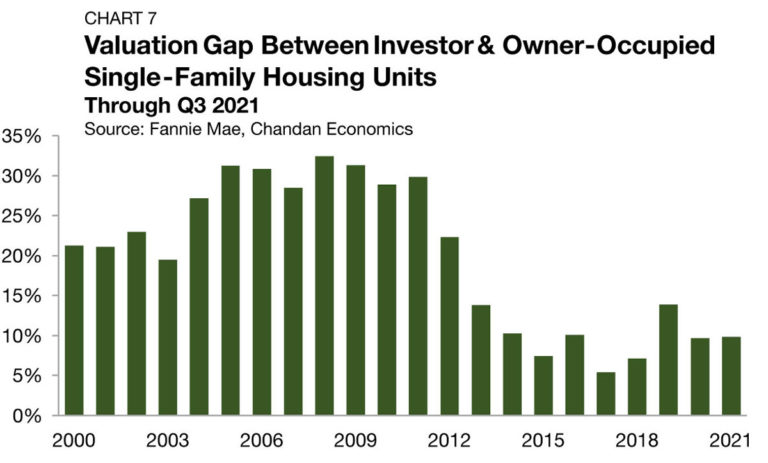
Several likely factors contribute to this valuation gap, one being that many investors are targeting value-add assets rather than paying top dollar for value that already exists. Additionally, investor-owned SFR properties have vacancy, turnover, and management-related expenses that owner-occupied units do not have to account for, contributing to lower values for the rental units. Nevertheless, the gap has narrowed dramatically over the past decade.

Between 2004 and 2011, the valuation gap sat in a consistent range of 27.2% to 32.5% (Chart 7). As more investors and capital entered the SFR space, discounted investment units became harder to find and competition for inventory ramped up. The valuation gap fell to an all-time low of 5.4% in 2017 before moderating in the years since. Through the third quarter of 2021, the average valuation gap this year has sat at 9.9%— a marginal 18 bps increase from the 2020 average.
Credit Trends
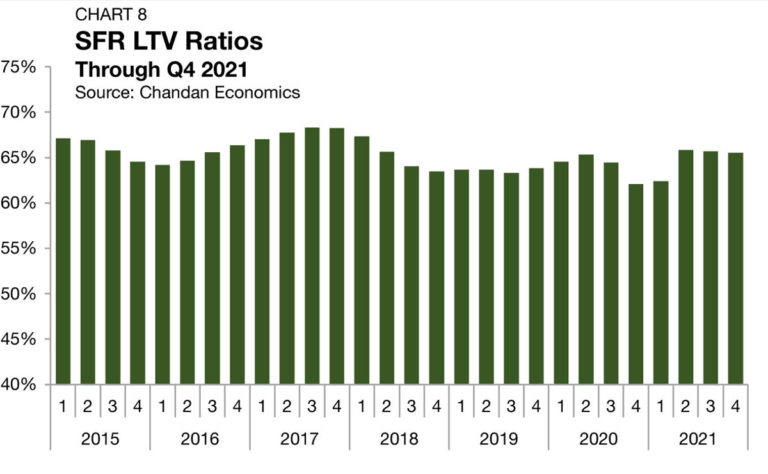
Loan-to-value ratios (LTVs), a measure of credit risk on SFR mortgages, ended the year by edging down for the second consecutive quarter, shaving off 17 bps to land at 65.5% (Chart 8). After sinking by 328 bps between the second and fourth quarters of 2020, LTVs quickly recovered back to pre-pandemic levels by mid-2021. Despite recent marginal declines, SFR LTVs remain higher than they were at the onset of the pandemic. The return and stabilization of LTVs to pre-COVID-19 levels are a welcome signal that credit risk appetites have recovered and remain aligned with the sector’s favorable outlook.
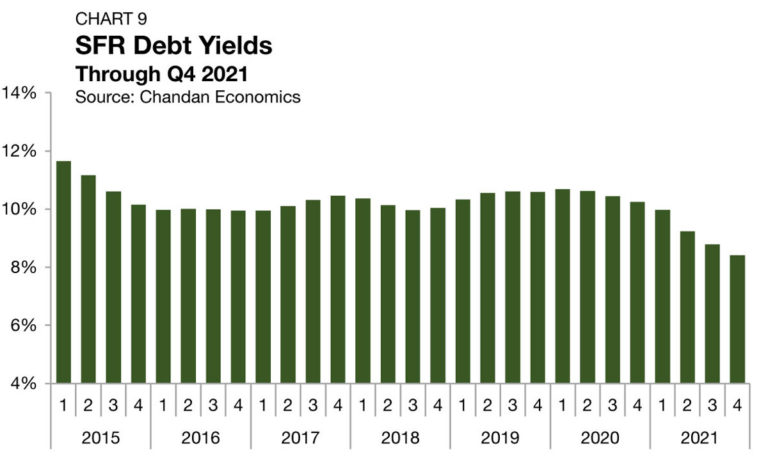
Debt yields, another key measure of credit risk, fell by 37 bps between the third and fourth quarters of 2021, settling at 8.4%— the lowest rate on record (Chart 9). The drop in debt yields translates to SFR investors securing more debt capital for every dollar of property-level net operating income (NOI). Through the fourth quarter of 2021, SFR debt increased to $11.89 for every dollar of NOI, a $0.50 increase from the prior quarter and a $2.13 increase from this time last year.

Supply & Demand Conditions

Residential Default Rates
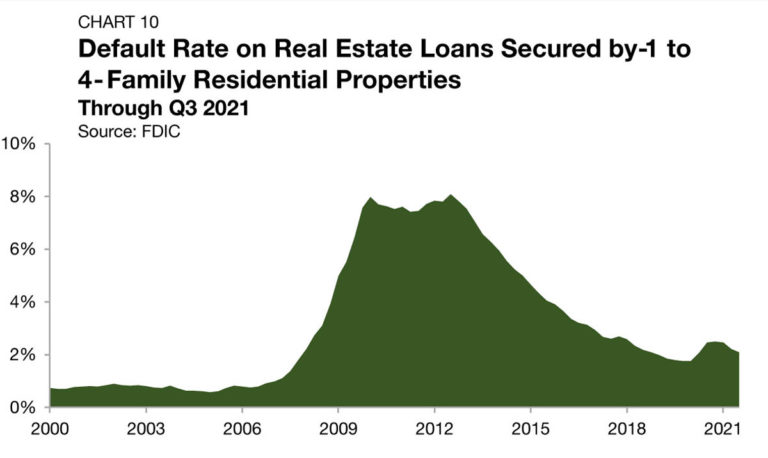
During the 2008 housing crisis, investors with available financing took advantage of the market dislocation, acquiring large portfolios of single-family assets at steep discounts. According to the Federal Deposit Insurance Corporation (FDIC), mortgage default rates peaked at 8.1% in 2012, leading to an abundance of distressed sales and the beginning of the SFR sector as we know it today (Chart 10).

When the pandemic reached the U.S. in 2020, there was concern that there might be a wave of household defaults and a housing crisis on the horizon. However, those fears never materialized. Residential default rates never rose above 2.5% during the pandemic and have now fallen for three consecutive quarters, settling at 2.1% through the third quarter of 2021. The lack of default activity during the pandemic triggered recession is a feature of housing market demand. Unlike during the Great Recession, homeowners who found themselves unable to meet their monthly mortgage payments had the option to sell their assets at favorable valuations. Moreover, federally directed forbearance also limited the scope of housing market distress, giving homeowners flexibility during the worst of the pandemic’s economic pain.

Build-to-Rent

Purpose-built SFR properties, known as build-to-rent (BTR) communities, continue to become a defining feature of the SFR sector, especially within the institutional slice of the market.

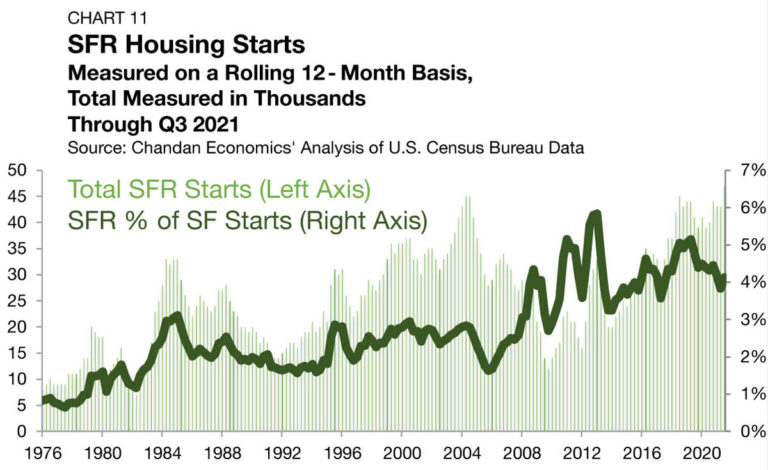
Based on an analysis of Census Bureau data, between 1975 and the start of the prior recession in 2007, BTRs accounted for a little less than 2.0% of all single-family construction starts (Chart 11). In 2013, BTR’s percentage share of construction starts reached an all-time high of 5.8%, and through the third quarter of 2021, the share remained elevated at 4.1%. BTR construction starts totaled 47,000 units through the year ending in third-quarter 2021, a 17.5% growth rate from a year earlier and a new all-time high— a significant growth rate, but one that appears to be understated.

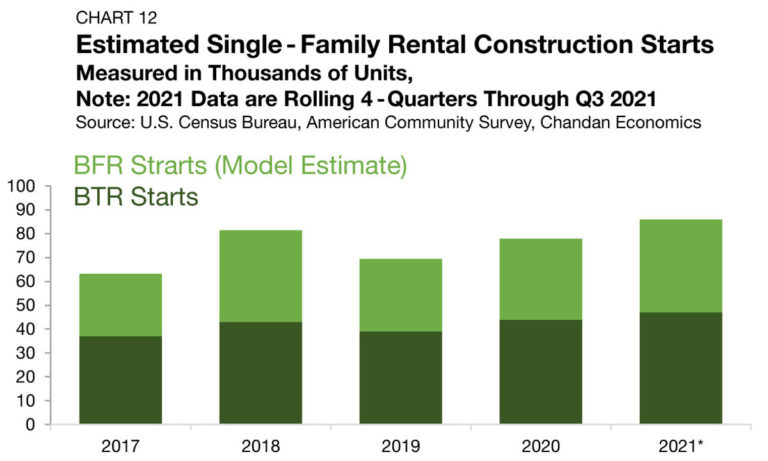
The reason why the initial BTR estimate may be understated is that the single-family construction starts data do not include units that are started and sold to SFR operators (build-for-rent or BFR). In a recent Arbor-Chandan analysis, Chandan Economics estimates that the total number of SFR construction starts over the past year may be as high as 86,000 through third-quarter 2021 (Chart 12).

Tracking Demand

Utilizing Google Trends, the popularity of the search term “homes for rent” is leveraged as a proxy for hotspots of SFR demand. Macon, GA, was the most popular area where the term was searched during the fourth quarter of 2021, dethroning Columbus, GA, which had seen the highest search frequency in the previous period (Table 1).

The Sun Belt continues to be the U.S. epicenter for SFR demand. All of the top 10 markets searched for in the fourth quarter of 2021 are in the Sun Belt. Moreover, all ten are in the Census Bureau’s South region, which saw its resident population grow by 0.65% in 2021— 60 bps better than the Western Census region, which was the only other area of the country to see population growth last year. Among the reasons why the Sun Belt continues to attract new residents and SFR demand, affordability, lower taxes, and warmer weather all top the list.

Outlook

The SFR sector remains firmly in its honeymoon as a newly minted institutional asset class. Even as investment activity has surged, distress remains limited, indicating that growing enthusiasm has not led to widespread undue risk-taking. After the levels of rent growth measured in 2021, some declining pricing momentum should be expected, and evidence suggests that a reversion to more “normal” levels of robust rent growth is already underway. All told, the SFR sector continues to be an attractive option for both lifestyle renters as well as forming families that lack the means to transition into affordable homeownership. SFR has emerged as a vital option in the U.S. housing stock, and with the cost of homeownership set to rise, demand for single-family rental inventory is poised to grow in the years ahead.

For more single-family rental research and insights, visit arbor.com/blog

Disclaimer All content is provided herein “as is” and neither Arbor Realty Trust, Inc. or Chandan Economics, LLC (“the Companies”) nor their affiliated or related entities, nor any person involved in the creation, production and distribution of the content make any warranties, express or implied. The Companies do not make any representations regarding the reliability, usefulness, completeness, accuracy, currency nor represent that use of any information provided herein would not infringe on other third party rights. The Companies shall not be liable for any direct, indirect or consequential damages to the reader or a third party arising from the use of the information contained herein.