Unless an 11th-hour agreement is reached, an impasse will trigger the first U.S. government shutdown since 2019. Starting December 21, 2024, many non-essential federal government operations will be limited or suspended, but most multifamily financing activities will not be disrupted.
Acquisitions, Refinancing Activity both Surge, Sending Small Multifamily Originations Soaring
Key Findings
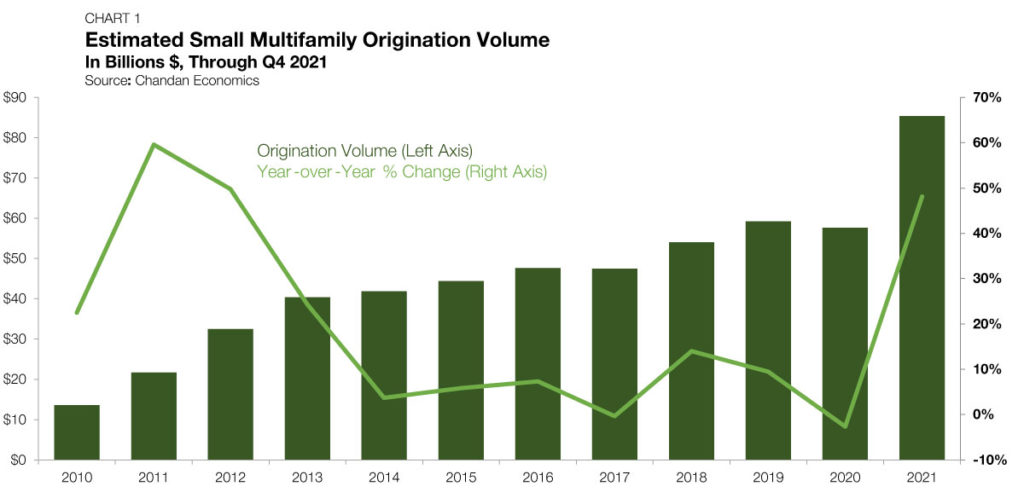
- Small multifamily originations jump by 48.1% in 2021, reaching $85.4 billion.
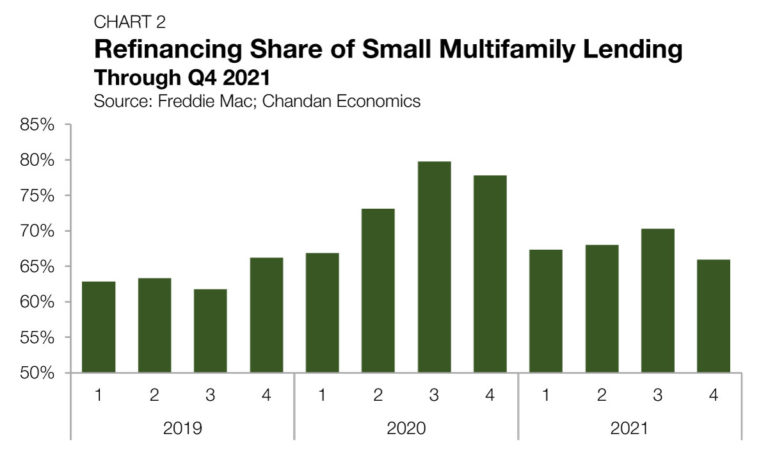
- The refinancing share of originations has settled back near a normal, pre-pandemic range.
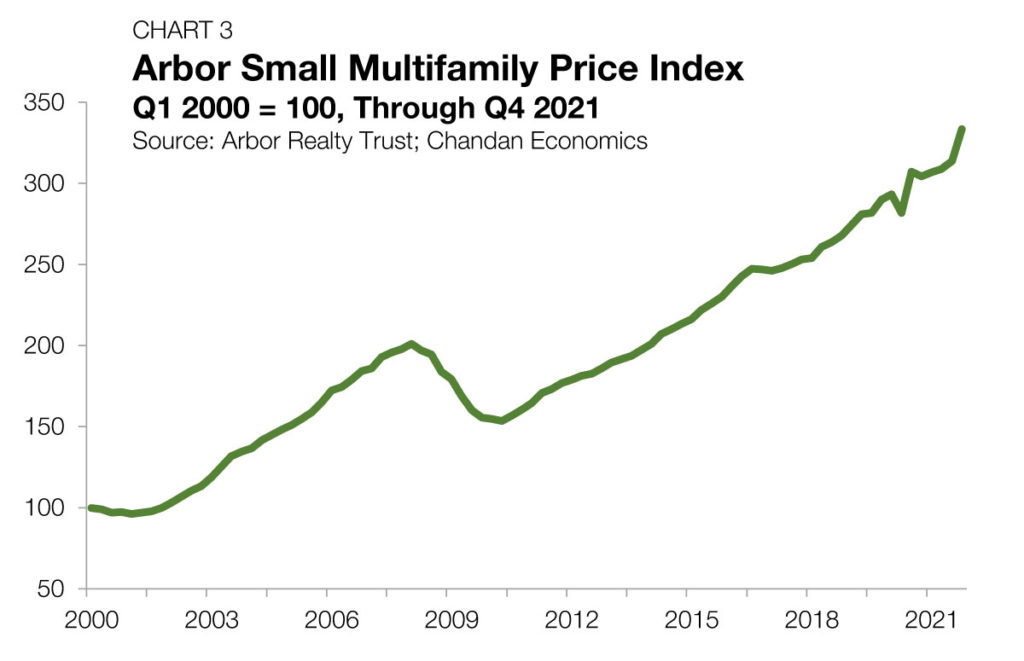
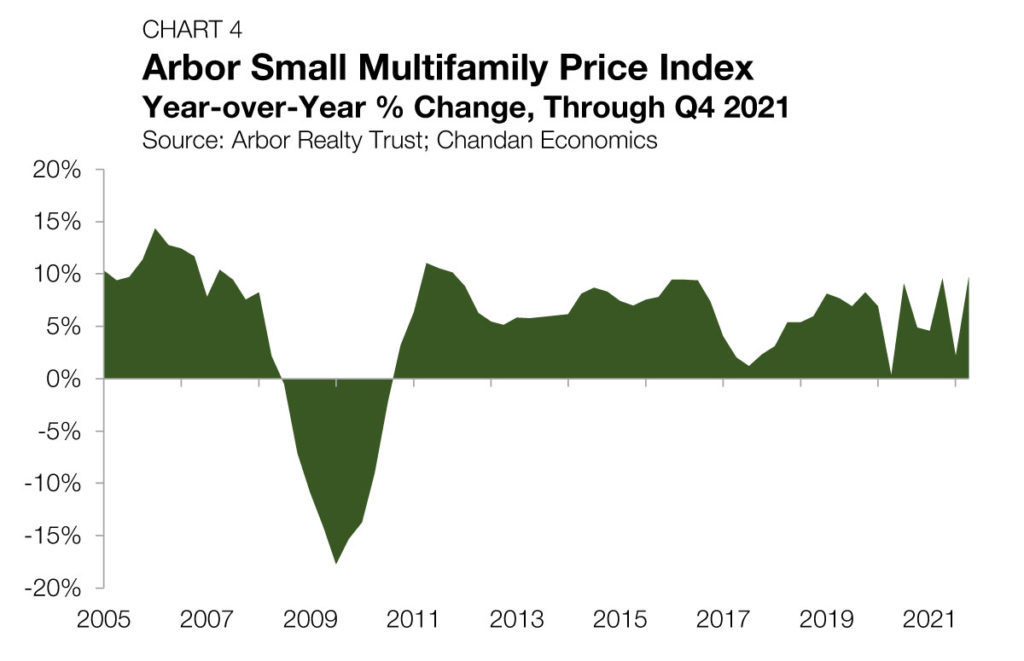
- Asset prices rose a robust 9.7% from a year earlier.
State of the Market
The U.S. economy grew by 5.7% in 2021, reaching $19.4 trillion (measured in inflation-adjusted, 2012 dollars), according to the Bureau of Economic Analysis. Considering the ongoing pandemic, the annual growth figure is a testament to the resiliency of the U.S. economy and strength of the current recovery.
Supply chain disruptions, labor shortages, and a shift to more goods consumption (as opposed to services) have all collectively stoked inflationary pressures. According to the Bureau of Labor Statistics (BLS) Consumer Price Index, prices of goods and
services increased 7.0% from one year ago through December — the highest mark since 1982. In response, the Federal Reserve is prepping for a monetary policy tightening cycle. As of the latest Summary of Economic Projections, the policy-setting body of the Fed currently forecasts hiking interest rates three times in 2022 and three times again in 2023.
Annual lease structures within the multifamily sector are proving a valuable feature in a high inflation setting. According to Real Page, new lease rent growth reached 13.9% in November 2021 — a record-setting pace. Beyond inflation, data from the Mortgage Bankers Association indicates that mortgage credit availability remains significantly below pre-pandemic levels, supportive of rental housing demand.
Within the small multifamily sub-sector, there is significant recovery optimism, though some pandemic-era concerns remain. According to a recent analysis by Chandan Economics and RentRedi, independent landlords operating small multifamily properties continue to see lower full- and on-time collection rates compared to a pre-pandemic benchmark. With operating expenses rising with inflation and collection rates remaining below normal levels, small multifamily expense ratios have risen through 2021. Still, as this report will detail, small multifamily cap rates remain stable near their all-time lows, and loan-to-value ratios have started to recover. Moreover, a frenzied return of buyers and a wave of borrowers seeking to refinance ahead of the Fed’s monetary tightening are leading to record levels of origination and transaction activity. All else equal, while risks remain, demand stability and growing liquidity for small multifamily assets are broadly supportive of the sector heading into 2022.
Lending Volume
The initial year-end 2021 estimate of new multifamily lending volume on loans with original balances between $1 million and $7.5 million1 — including loans for apartment building sales and refinancing — surged to $85.4 billion (Chart 1). The estimate is a substantial step-up from previous 2021 annualized estimates, reflecting a sizable increase in originations at the end of the third quarter through the end of the year. The current estimate would represent an annual increase of $27.7 billion from last year’s total, or a 48.1% growth rate— the highest annual growth rate since 2012. Moreover, the 2021 originations estimate blows past the previous high of $59.2 billion set in 2019. Behind the dramatic surge in small multifamily lending volume are two interrelated trends. Confidence in the multifamily sector’s growth and the protection that tangible assets offer against inflation risk contributed to a wave of transaction activity through the end of the year. At the same time, with a Federal Reserve preparing for monetary tightening in 2022, borrowers are increasingly refinancing to lock into low-interest rates.
The balance of small multifamily originations for the purpose of refinancing versus acquisitions has come back in line with pre-pandemic levels. The refinancing share of small multifamily lending fell to 65.9% in the fourth quarter of 2021, declining from 70.3% in the previous quarter (Chart 2). The refinancing share of originations grew considerably through 2020, reaching a high of 79.7% of new small multifamily debt as lenders kept up production while pandemic-triggered uncertainty limited “arm’s length” transactions between buyers and sellers.
Arbor Small Multifamily Price Index
As measured by the Arbor Small Multifamily Price Index2, small multifamily asset valuations accelerated in the final quarter of 2021, notching robust quarterly and annual gains of 6.3% and 9.7%, respectively (Chart 3 and Chart 4). On an annual change basis, the fourth quarter rise in small multifamily asset values marks the largest jump since 2011. Compared to the crisis-low point reached in the second quarter of 2020, asset valuations are up by a significant 18.4%. Moreover, valuations are up by 13.8% over where they were at the onset of the pandemic.
2 The Arbor Small Multifamily Price Index (ASMPI) uses model estimates of small multifamily rents and compares them against small multifamily cap rates. The index measures the estimated average price appreciation on small multifamily properties with 5 to 50 units and primary mortgages of $1 million to $7.5 million. For the full methodology, visit arbor.com/asmpi-faq.
Cap Rates & Spreads
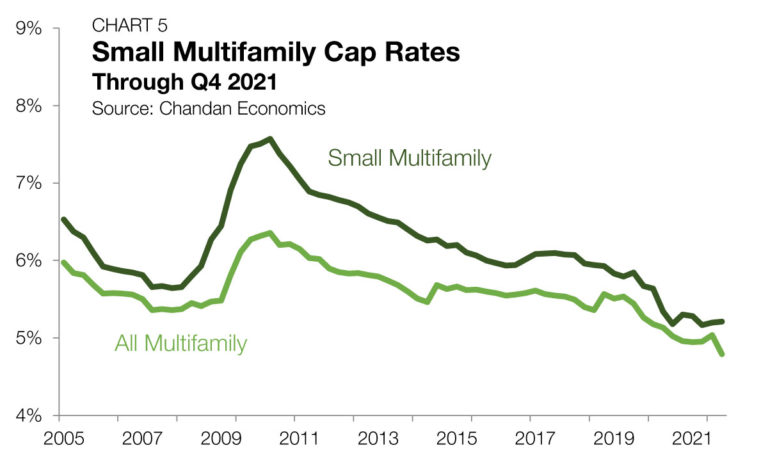
National average cap rates for small multifamily properties were effectively flat in the fourth quarter of 2021, rising 1 basis point (bps) and remaining at a rounded 5.2% (Chart 5). While cap rate movements over the past half-year have been marginal, the fourth quarter reading marks the first time that small multifamily cap rates have risen in consecutive quarters since 2017. Small multifamily cap rates compressed considerably during the last real estate cycle, declining from a cyclical high of 7.6% in 2010 to their current range near 5.2%. Since the second quarter of 2020, small multifamily cap rates have sat in a narrow range between 518 bps and 534 bps.
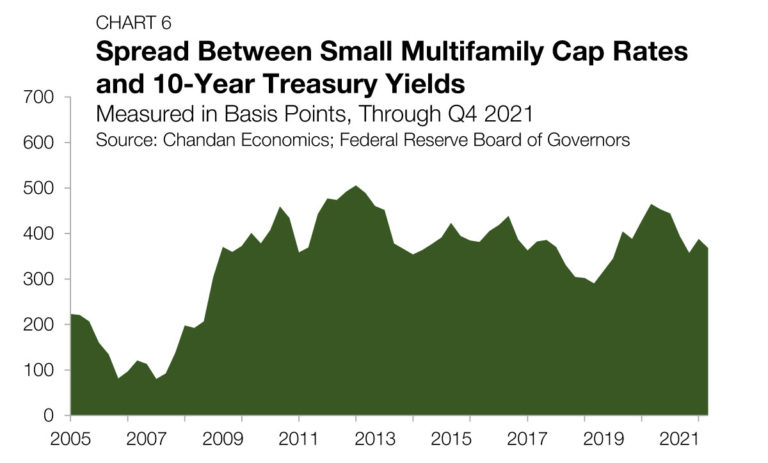
The small multifamily risk premium, a measure of additional compensation that investors require to account for higher levels of risk, is best measured by comparing cap rates to 10-year Treasury yields. The credit quality of the U.S. government is perceived as unmatched, making the price it pays for its debt an approximation for the risk-free interest rate.
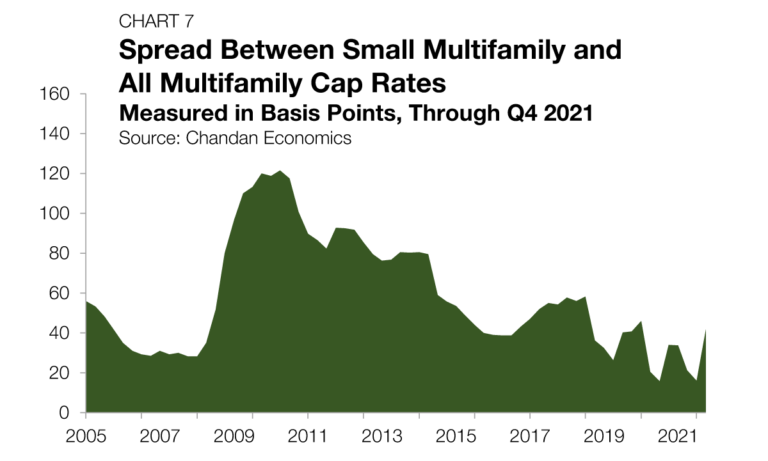
The small multifamily risk premium averaged 368 bps in the fourth quarter of 2021, down from 388 bps the previous quarter (Chart 6). After reaching as high as 466 bps in the second quarter of 2020, risk premiums have normalized, declining in five of the past six quarters. In 2019, small multifamily risk premiums ranged from 318 bps to 405 bps, indicating that current levels are in-line with pre-pandemic assessments of risk. The cap rate spread between small multifamily assets and the rest of the multifamily sector, a measure of the risk that is unique to smaller properties, rose by 26 bps in the fourth quarter of 2021, settling at 42 bps— the largest spread since the first quarter of 2021 (Chart 7).
Expense Ratios
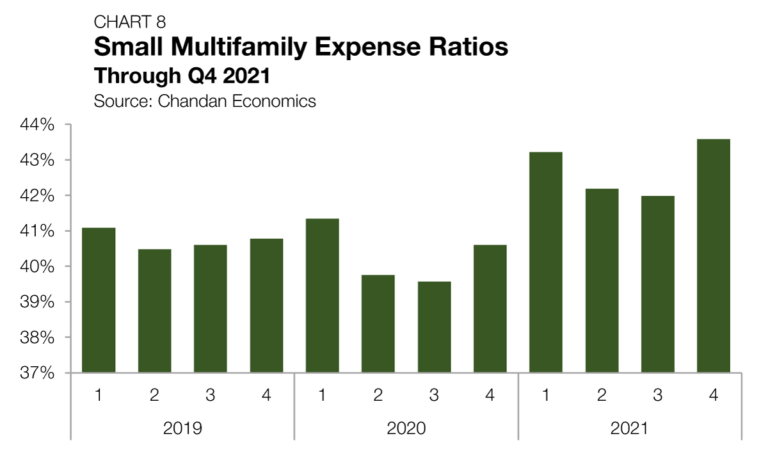
Expense Ratios, measured here as the relationship between underwritten property-level expenses to effective gross income, have risen for small multifamily properties over the past year— a sign that operators have not been able to boost rents enough to offset rising expenses. Moreover, a dip in rent collections is also impacting property-level cashflows. On-time rent payment rates in independently operated small multifamily properties were down by 6.0% from their pre-pandemic benchmark through December 2021. In 2019, before the pandemic, small multifamily expense ratios sat in a narrow range between 40.5% and 41.1% (Chart 8). Through the fourth quarter of 2021, expense ratios have grown to 43.6%. According to an analysis by the National Apartment Association, renter delinquencies and rising operating expenses, namely insurance premiums, have squeezed net returns during the pandemic.
Leverage & Debt Yields
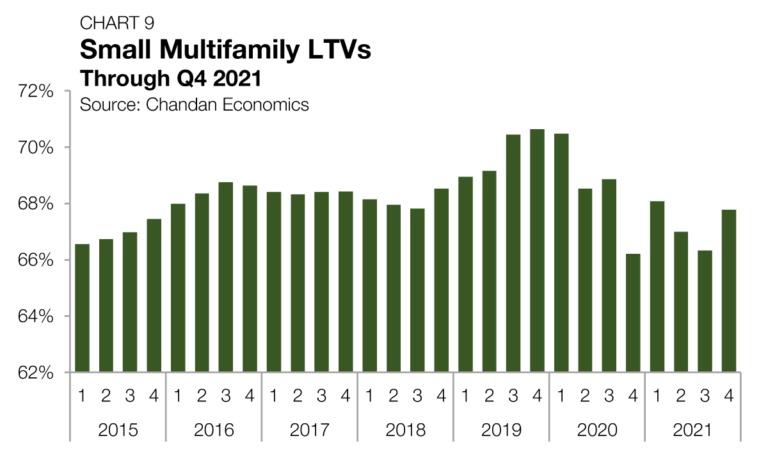
The general trend for loan-to-value ratios (LTVs) on newly originated small multifamily loans was that of declines throughout most of the past two years. Prior to the fourth quarter of 2021, LTVs fell in five of the past seven quarters. For reference, small multifamily LTVs fell on a quarter-over-quarter basis only five times in the entire decade leading up to the pandemic. In the fourth quarter of 2021, small multifamily LTVs showed signs of recovery, jumping 146 bps to 67.8%. Still, compared to the high watermark of 70.6% reached in the fourth quarter of 2021, LTVs remain down by 285 bps (Chart 9).
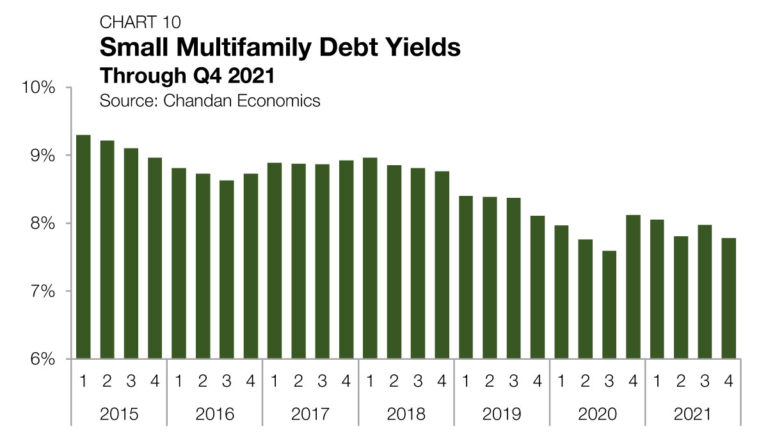
Debt yields for small multifamily loans fell by 20 bps to 7.8% in the fourth quarter of 2021— just 19 bps above its all-time low (Chart 10). Debt per dollar of NOI, the inverse of debt yields, rose for small multifamily loans in the fourth quarter. Small multifamily borrowers were securing an average of $12.85 in new debt for every $1 of property NOI, up 32 cents from the previous quarter.
Outlook
Small multifamily remains well-positioned to for 2022. With inflation reaching its highest levels in a generation and higher interest rates on the horizon, a higher expense environment over the short-term is probable for many properties. The success of small multifamily operators will rest on their ability to match rising costs with rising rental revenues. Nevertheless, with standard apartment leases lasting only for an average of one year, cashflows can more quickly adjust to inflationary pressures than other commercial real estate sectors, making the asset class more attractive in the current environment. Resurgent levels of multifamily transaction activity and the abundant presence of buyers offers significant insulation to downside pressures potentially posed by the pandemic and expectations for monetary tightening. Moreover, despite rising levels of residential construction, the U.S. housing shortage is present. With the small multifamily sector acting as a critical source of the nation’s affordable housing stock for renters by necessity, the demand for these properties remains strong.
For more small multifamily research and insights, visit arbor.com/articles
Disclaimer All content is provided herein “as is” and neither Arbor Realty Trust, Inc. or Chandan Economics, LLC (“the Companies”) nor their affiliated or related entities, nor any person involved in the creation, production and distribution of the content make any warranties, express or implied. The Companies do not make any representations regarding the reliability, usefulness, completeness, accuracy, currency nor represent that use of any information provided herein would not infringe on other third party rights. The Companies shall not be liable for any direct, indirect or consequential damages to the reader or a third party arising from the use of the information contained herein.