The Federal Housing Finance Agency (FHFA) announced a $30 billion boost to Fannie Mae and Freddie Mac’s volume cap for loan purchases in 2026 to $176 billion ($88 billion for each agency). This increase in FHFA loan caps for 2026 aligns with industry expectations, given the anticipation of improving market conditions and lending activity expected in a lower interest rate environment. Next year’s cap for the Government-Sponsored Entities (GSEs) is an increase of approximately 20% from the $146 billion limit set for 2025.
Single-Family Rental Investment Trends Report Q1 2023
Investor Purchases, New Starts, and Tenant Performance Show Strength as Cap Rates Rise
Key Findings
- SFR/BTR accounted for 6.9% of new single-family construction starts in the past year, a new record high.
- Cap rates jumped to 5.9%.
- Investor purchasing activity increased in 2022 despite macroeconomic headwinds.
Table of Contents
State of the Market
For the first time since the institutional emergence of the single-family rental (SFR) sector, investors must navigate through an economic environment absent of overwhelming macroeconomic tailwinds. Still, SFR’s significant structural support has enabled it to take noticeable steps forward, while other commercial property types have been merely treading water.
The SFR sector has been contending with two major forces in recent months — both of which were initiated by rising interest rates. First, home prices have fallen from their record highs, impacting SFR asset valuations. Secondly, and most recently, banking sector turmoil has taken its toll. The CMBS market, which institutional investors access to find liquidity for large-scale deals, has seen a dramatic contraction of new activity.
Nevertheless, investors purchased more SFR units in 2022 than in 2021 — a trend that starkly contrasts the owner-occupied single-family housing markets. Moreover, construction continues to ramp up in the sector, with SFR starts reaching all-time highs by unit count and market share. Even in this high-interest rate environment, the long-term ascent of the sector remains undeterred.
Performance Metrics
CMBS Issuance
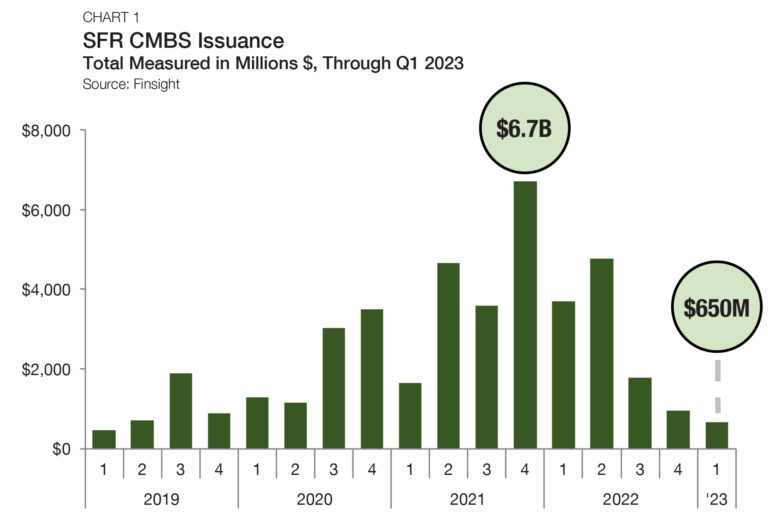
In the CMBS market, SFR issuance continued to slow. According to Finsight, SFR CMBS issuance totaled just $650 million in the first quarter of 2023 — the lowest quarterly amount since 2019 (Chart 1). SFR CMBS issuance has now declined in each of the past three quarters. However, the drop-off in activity is not unique to SFR — rather, it is a symptom of a broader pullback from CMBS. According to Trepp, overall CMBS deal volume finished down 79% in the first quarter of 2023 compared to a year ago.
Originations by Purpose
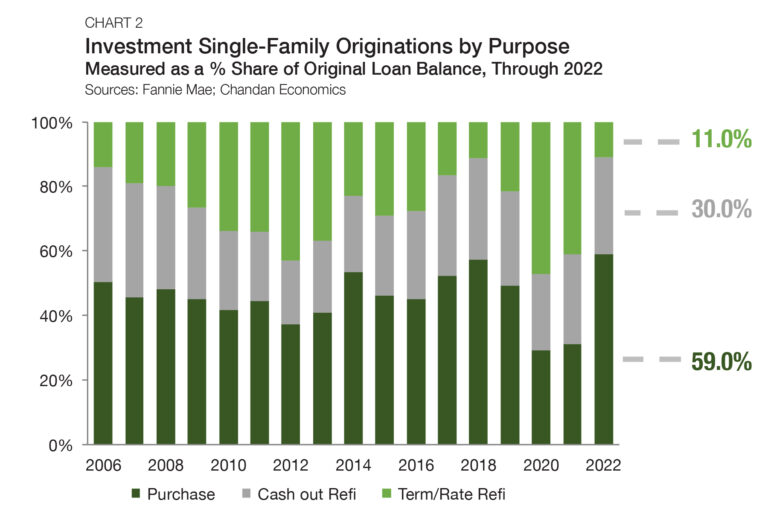
Loans for purchasing, not refinancing, accounted for the majority (59.0%) of originations to single-family investors in 2022 for the first time since 2018, according to Fannie Mae (Chart 2). Moreover, purchases accounted for the largest share of investor originations since 2000.
The market shifted in 2022 after the Federal Reserve began its monetary tightening cycle. In the 15 months ending in May 2023, the Fed hiked interest rates 10 times, bringing its federal funds target rate from 0.25% to 5.25%. As a result, voluntary refinancings of existing mortgages became less advantageous.
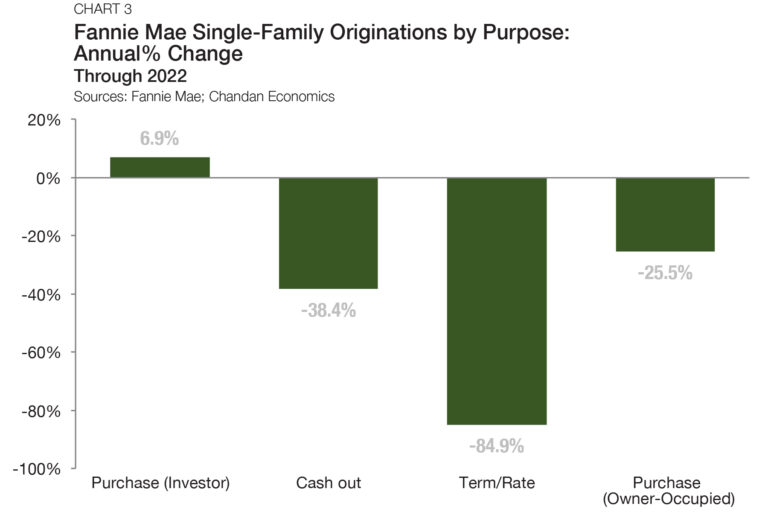
According to Chandan Economics’ analysis of Fannie Mae data, the dollar volume of term/rate refinancings fell by 84.9% in 2022 compared to the year prior. Cash-out refinancings also dropped off but by a milder 38.4% (Chart 3). The relative discrepancy between rate/term and cash-out refis likely reflects the fact that accrued equity, especially for smaller-scale investors, represents the capital needed for a down payment on new acquisitions. Most strikingly, single-family purchases by investors bucked the overarching trend of declines, posting a 6.9% year-over-year increase in 2022 — even as purchases by owner-occupants fell 25.5%.
Occupancy
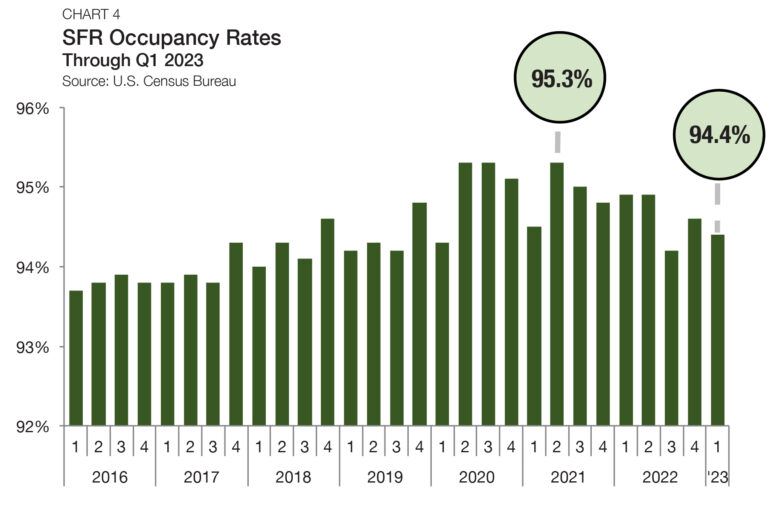
Occupancy rates across all SFRs averaged 94.4% in the first quarter of 2023, declining by 40 bps from the previous quarter, according to U.S. Census Bureau data (Chart 4). The data aligns well with similar data from private sources. DBRS Morningstar, which actively tracks the performance of 123,929 SFR properties, reported a 94.1% SFR occupancy rate in February 2023.
Rent Growth
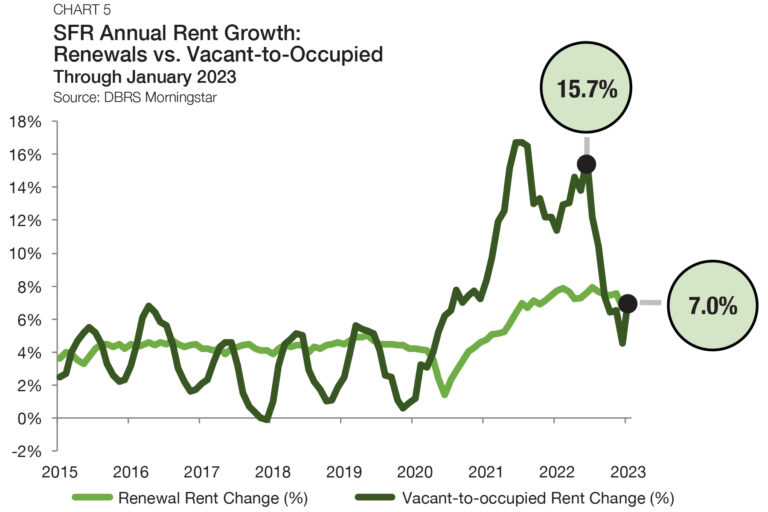
DBRS Morningstar also reported that vacant-to-occupied (V2O) annual rent growth tumbled in late 2022, falling from a high of 15.7% in June 2022 to reach a low of 4.5% in December (Chart 5). However, V2O rent growth jumped again in January 2023, rising to 7.0%. Since the onset of the pandemic, V2O rent growth has been volatile. As a new stable equilibrium takes hold in the coming years, a return to seasonal V2O rent growth patterns can be expected, where price pressures peak in the early summer and reach a bottom in the early winter.
For lease renewals, annual rent has also slowed from its peaks, albeit far more gently. After hitting an all-time high of 7.9% in July 2022, lease renewal rent growth has slid in four-of-six months, landing at 7.0% through January 2023. Further, despite the recent declines, current levels of renewal rent growth remain exceptionally high by recent historical standards. Between 2015 and 2020, SFR renewal rent growth never eclipsed 5.0%. As of January 2023, SFR renewal rent growth has sat above 7.0% for 15 straight months, marking an unrivaled period of sustained gains.
Rent Collections
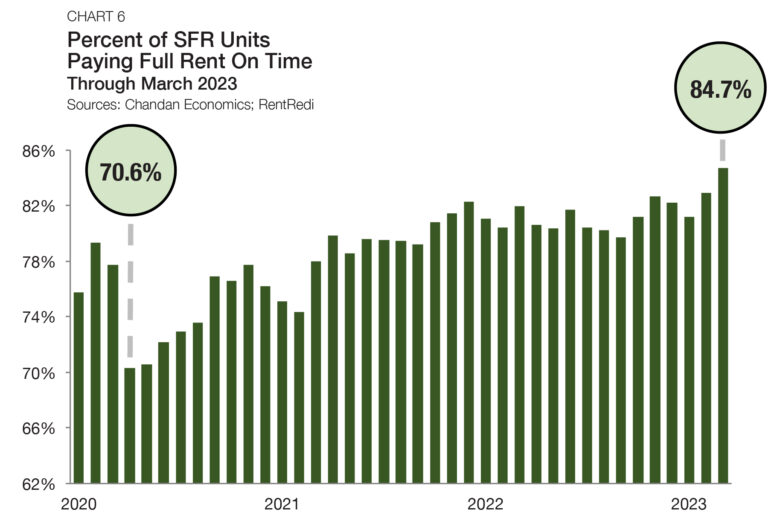
On-time rent payments in SFR properties remain at healthy levels. In March 2023, an estimated 84.7% of units paid their full rent on time, according to the Independent Landlord Rental Performance Report (Chart 6). These on-time payment rates fell as low as 70.6% during 2020 as pandemic-related financial distress was widespread. However, rent collection performance gradually improved and is now consistently reaching new highs. These trends signal that the household balance sheets of SFR renters remain healthy, especially as the labor market shows signs of resiliency. As a result, SFR properties continue to have strong cash flows even amid growing economic headwinds.
Cap Rates
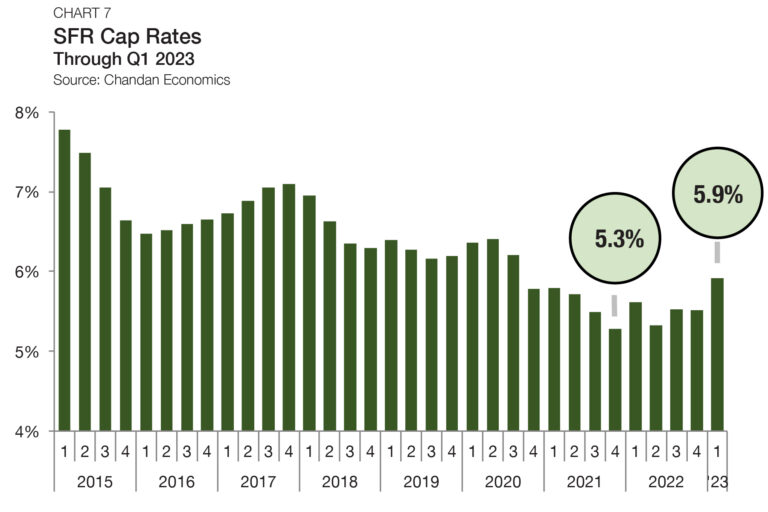
SFR cap rates continued to tick up in the first quarter, moving 40 bps higher to land at a rounded 5.9% (Chart 7).1 Cap rates during the pandemic and its aftermath compressed as single-family home prices appreciated at record-setting rates. Now, as home prices have fallen from their record highs, cap rates have started moving in reverse. However, according to the S&P Case-Shiller Home Price Index, valuations have stabilized and even started rising again in February. If home prices start another ascent, SFR cap rates would likely see less upward pressure.
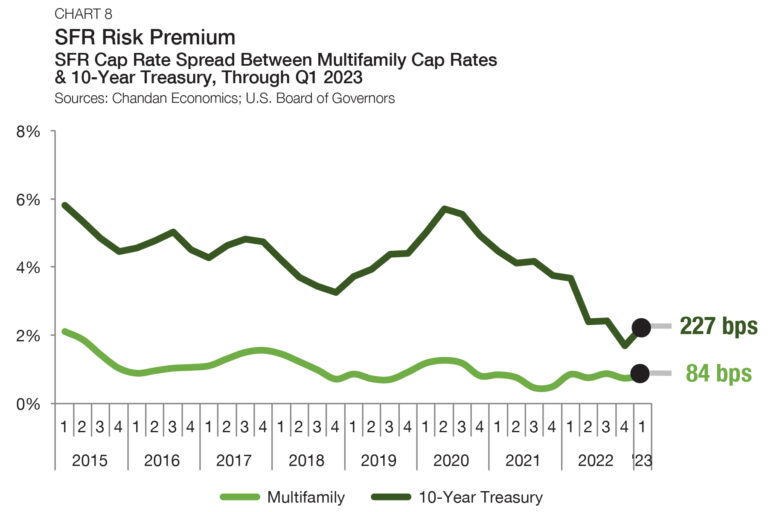
The spread between SFR cap rates and 10-year Treasury yields approximates the SFR risk premium. With SFR cap rates jumping in the first quarter of 2023 and Treasury yields falling slightly, the SFR risk premium saw its largest quarterly increase since 2020. The SFR risk premium averaged 227 bps in the first quarter — rising 58 bps from the previous period (Chart 8).
Meanwhile, the spread between SFR and multifamily properties has stabilized. In each of the past five quarters, SFR cap rates have stood between 75 and 90 bps higher than multifamily cap rates. In the first quarter of 2023, this SFR/multifamily yield spread averaged 84 bps, increasing 9 bps from the previous quarter.
Pricing
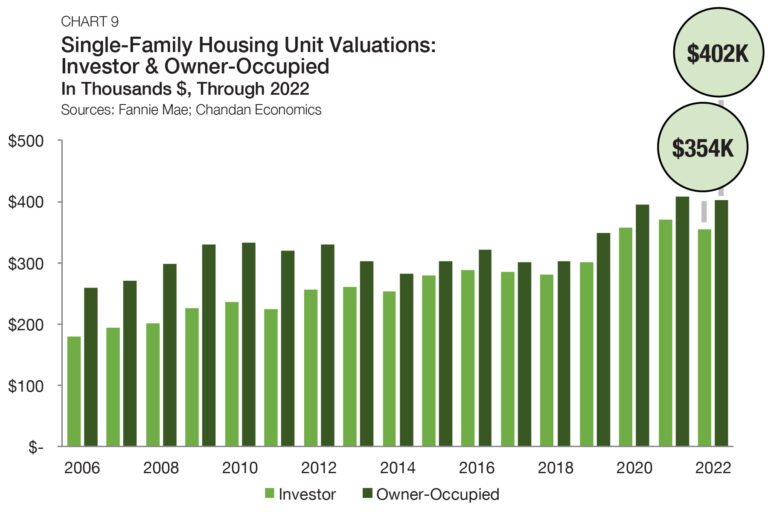
There have been consistent differences between the average assessed property values on mortgages originated to single-family owner-occupants versus single-family investors since 2006. Now, investors are incentivized to target value-add assets rather than paying top dollar for value that already exists. Additionally, investor-owned SFR properties have vacancies, turnover, and management-related expenses that owner-occupied units do not have, contributing to lower values for the rental units. Before the Financial Crisis, the valuation gap between owner-occupied single-family units and SFRs routinely sat at about 30%. However, this gap has contracted over the past decade to the 10% range where it remains today.
In 2022, the average valuation of an SFR receiving a Fannie Mae mortgage was $354,236 — down 4.5% from a year earlier (Chart 9). Meanwhile, for owner-occupied units, valuations sank by just 1.4% to $401,935. Subsequently, the average valuation gap between the two groups of properties increased slightly in 2022 from 9.0% to 11.9%. The widening can likely be explained by the fact that investors and owner-occupants have different purchasing considerations. Investors need a reasonable degree of certainty that their asset will appreciate over the short term to justify the purchase. As a result, especially in a housing market where home prices are falling, investors require higher yields and lower prices before they are willing to execute an acquisition.
A slight annual increase in the valuation gap has emerged as valuations across all single-family properties have declined this year. The average underwritten value of a single-family investment property through the third quarter of 2022 was $358,019, a drop-off of 3.5% from the 2021 average. Owner-occupied units hold an average underwritten valuation of $403,511 in 2022, down 1.0% from the year prior (Chart 10).
Debt Yields
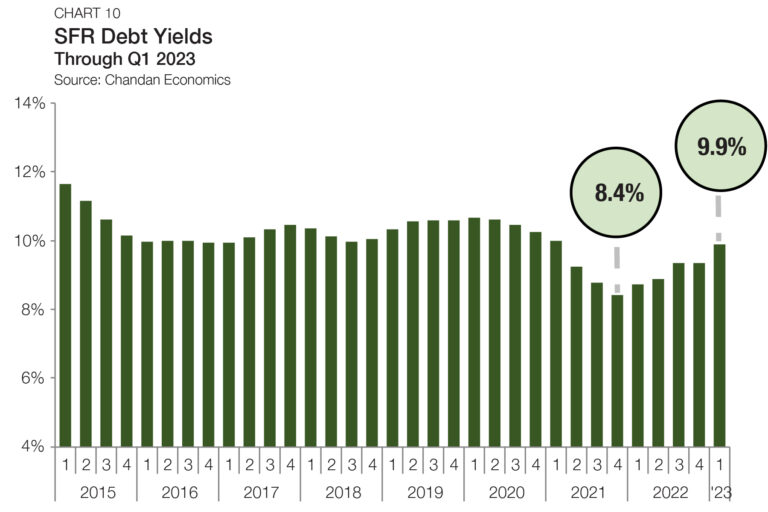
Debt yields, a key measure of credit risk, rose by 55 bps during the first quarter of 2023, jumping to 9.9% (Chart 10). The quarter-over-quarter increase was the largest on record since 2012. Moreover, the rise marked the fourth increase in the past five quarters, signaling that lenders have continued to exercise caution in an unsettled housing market.
The rise in debt yields in recent quarters translates to SFR investors securing less debt capital for every dollar of property-level net operating income (NOI). Through the first quarter of 2023, SFR debt declined to $10.12 for every dollar of NOI, a decrease of $0.60 from the previous quarter and $1.33 from the same time last year.
Supply & Demand Conditions
Residential Default Rates
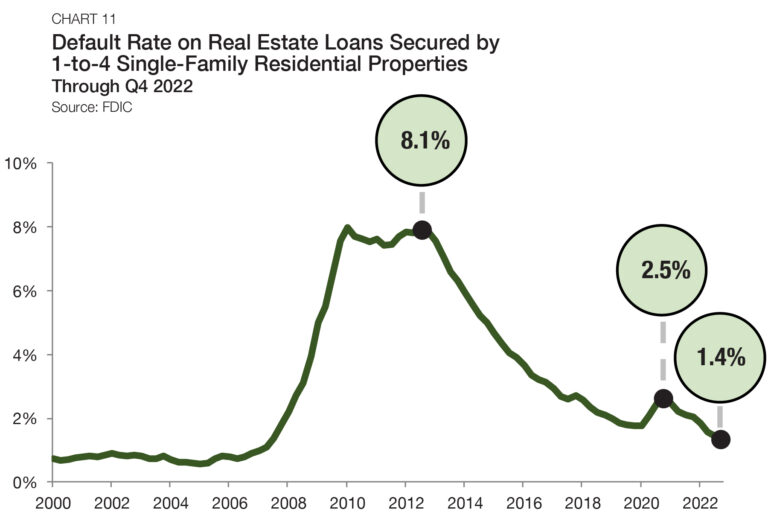
After a record runup in prices through 2021 and the first half of 2022, many investors believed that a housing market correction was inevitable, which would create a unique buying opportunity. To date, national home prices have not dropped substantially. While new home sales have cratered, average home valuations are down by less than 3.0% compared to their recent peaks. The combination of a strong labor market and most homeowners being locked into low-interest rates has resulted in an exceedingly low rate of mortgage defaults. According to the Federal Deposit Insurance Corporation (FDIC), mortgage default rates fell to a new post-Financial Crisis low of 1.4% in the fourth quarter of 2022, declining 4 bps from the third quarter (Chart 11).
Build-to-Rent
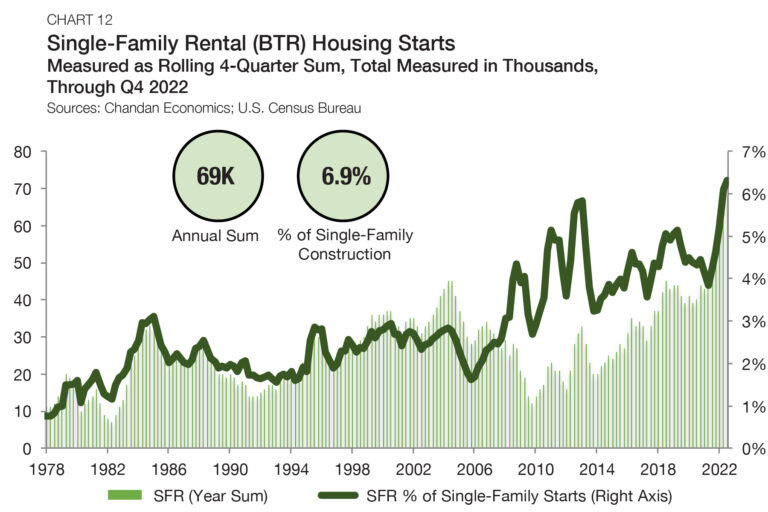
Purpose-built SFR properties, known as build-to-rent (BTR) communities, have become a defining feature of the SFR sector, especially within the institutional slice of the market. Through the end of 2022, despite a construction slowdown throughout the rest of the single-family sector, BTR production held at elevated levels. During 2022, BTR accounted for 6.9% of all single-family construction starts — another new record for this product type (Chart 12). For comparison, between 1975 and the start of the prior recession in 2007, BTRs accounted for a little less than 2.0% of all single-family construction starts, according to an analysis of Census Bureau data.
By unit count, there were 69,000 BTR construction starts in 2022, growing at a rate of 32.7% when compared to the year before.
Tracking Demand
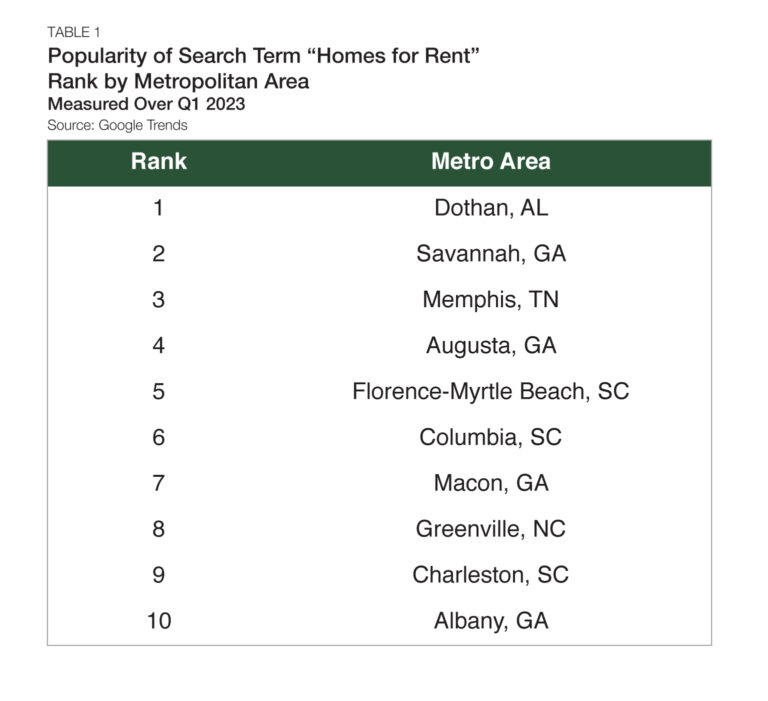
Google Trends can be used to track the popularity of the search term “homes for rent,” and help identify potential hotspots for SFR demand. Dothan, AL, was the area for which “homes for rent” was searched most during the first quarter of 2023, dethroning Augusta, GA, from the fourth quarter of 2022 (Table 1). All the metros within the top 10 most searched locations are found in five southeastern Sun Belt states (Georgia, Tennessee, Alabama, North Carolina, and South Carolina). In addition to demand-side factors, lower average land prices in the Southeast have made the region more attractive for large-scale SFR strategies. According to an analysis of Census Bureau data, more than half (52.1%) of all SFR/BTR housing starts in 2022 were in the South.
Outlook
The Federal Reserve’s public comments hint that the May 2023 interest rate increase could be the conclusion of its historically aggressive tightening cycle. If interest rates normalize in the coming months, SFR could be one of the many beneficiaries. For the sector to continue expanding, access to active capital markets is necessary to power its momentum.
However, just because a car needs gas, it does not mean the engine is broken. Underlying performance data, from lease renewal rent growth, rent collections, and investor acquisitions, all point to a sector that remains on solid footing despite macroeconomic headwinds.
Moreover, demographic and generational trends have made it more difficult for younger households to find affordable entry points into homeownership — a factor that should continue to influence SFR demand. While economic conditions continue challenging investors, SFR’s short- and long-term tailwinds are two big reasons to be optimistic for brighter days ahead.
1 Unless otherwise noted, the Chandan Economics data covering single-family rental cap rates and debt yields are based on model estimates and a sample pool of loans. Data are meant to represent conditions at the point of origination.
For more single-family rental research and insights, visit arbor.com/articles
Disclaimer All content is provided herein “as is” and neither Arbor Realty Trust, Inc. or Chandan Economics, LLC (“the Companies”) nor their affiliated or related entities, nor any person involved in the creation, production and distribution of the content make any warranties, express or implied. The Companies do not make any representations regarding the reliability, usefulness, completeness, accuracy, currency nor represent that use of any information provided herein would not infringe on other third party rights. The Companies shall not be liable for any direct, indirect or consequential damages to the reader or a third party arising from the use of the information contained herein.


