National rent growth in the single-family rental (SFR) sector remained strong and consistent in 2025 as market-level pricing momentum was broad-based and robust, according to an analysis of newly released data from the Zillow Observed Rent Index. Year-end annual rent gains averaged 2.9%, down from 4.1% in 2024, marking the most modest increase since 2015. But even as the intensity of SFR rent growth abated last year, its reach was extensive, with 98 of the 100 largest markets posting year-over-year gains.
Single-Family Rental Investment Trends Report Q1 2024
SFR Construction Starts Soar to a New High as Cap Rates Jump
Key Findings
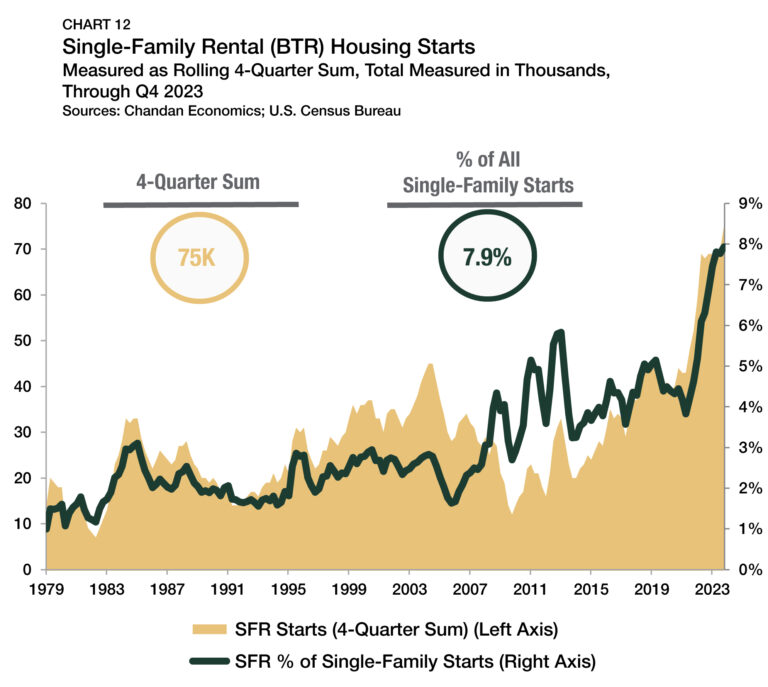
- SFR/BTR construction starts reached a record high of 75,000 in 2023, signaling a surge in development.
-
Renewal rent growth remains strong while new leases revert to seasonal patterns.
-
Cap rates jumped to 6.3% as the benchmark interest rate remained elevated.
Table of Contents
State of the Market
While high benchmark interest rates have impacted all commercial property types, the single-family rental (SFR) sector continues to fare better than most, with home prices remaining resilient and delinquency rates holding at rock-bottom levels.
SFR construction has been the sector’s greatest strength as affordable access to homeownership has decreased substantially over the last few years. According to data from the Atlanta Federal Reserve Bank, buying a home is about 37% less affordable today than it was at the onset of the pandemic. As a result, developers are leaning into build-to-rent (BTR) projects, driving the number of SFR/BTR construction starts to an all-time high.
A combination of high barriers to homeownership and the addition of more purpose-built SFR communities has led to an increase in lifestyle renters. Compared to existing SFR households, new renters entering the sector are younger, less likely to have started a family, and earn an average of $11,000 more per year.
Performance Metrics
CMBS Issuance
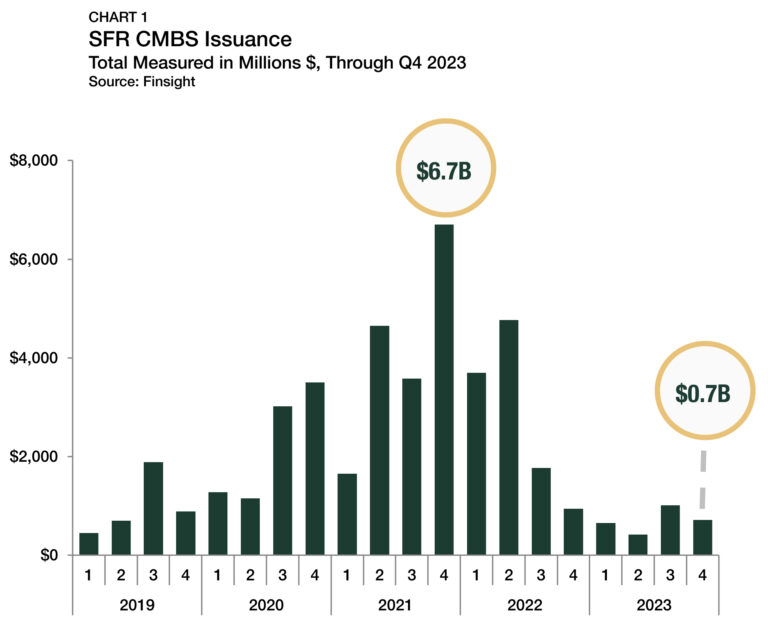
Following a historic run of investment over the previous two years, SFR issuance in the commercial mortgage-backed security (CMBS) market slowed during 2023. According to Finsight, SFR CMBS issuance totaled $713 million in the fourth quarter of 2023 — sliding back down from the $1.0 billion recorded in the prior quarter (Chart 1).
Issuance totaled $2.8 billion for the entire year — the lowest annual sum on record since 2013. While CMBS activity is unlikely to return to 2021 levels in the near future, forecasts indicate that 2024 will be a more active year. Credit rating agency KBRA projects that market-wide CMBS issuance will improve by 23.6% in the year ahead.
Originations by Purpose
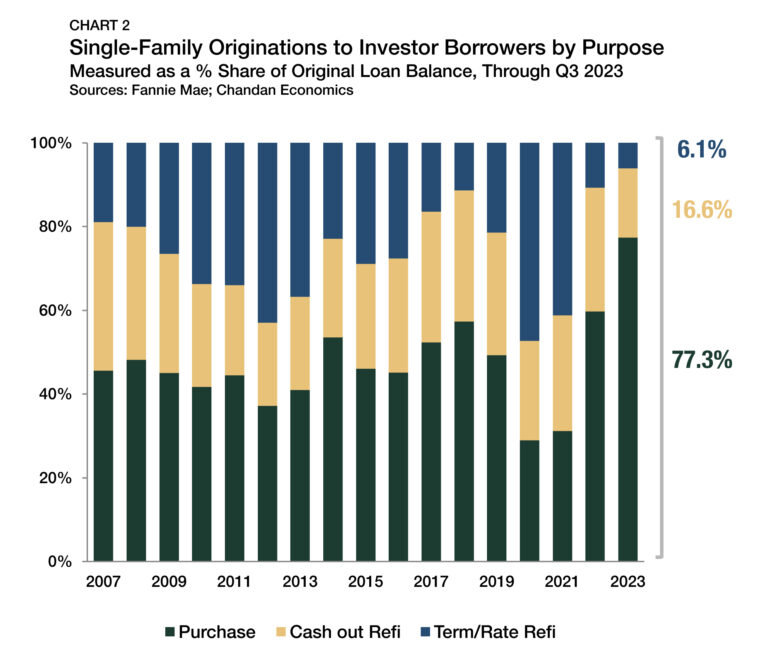
Driven primarily by the interest rate environment and a lack of demand for refinancings, new acquisition loans have emerged as the primary purpose for SFR originations in recent quarters. According to Fannie Mae, new loans intended for purchasing accounted for a majority (59.7%) of SFR lending activity in 2022 for the first time since 2018 (Chart 2). Through the third quarter of 2023, the purchasing share of originations has continued to soar, rising to 77.3% — the highest share on record going back to 1999. Meanwhile, rate-and-term refinancing loans, which accounted for 47.3% of originations as recently as 2020, account for just 6.1% of 2023’s lending activity.
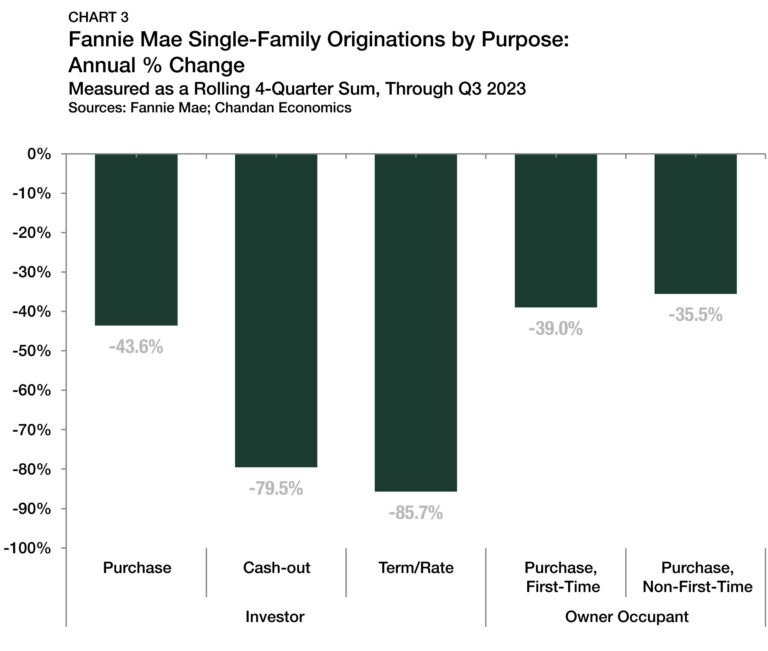
According to an analysis of Fannie Mae data, the dollar volume of rate-and-term refinancings fell by 85.7% during the 12 months ending in September 2023 compared to the prior 12 months (Chart 3). Cash-out refinancings also dropped by 79.5%. Meanwhile, investor single-family purchases fell by 43.6%. The slide in SFR purchasing activity has been proportional to declines observed throughout the rest of the housing market. Single-family home purchases by first-time and non-first-time homebuyers fell by 39.0% and 35.5%, respectively.
Occupancy
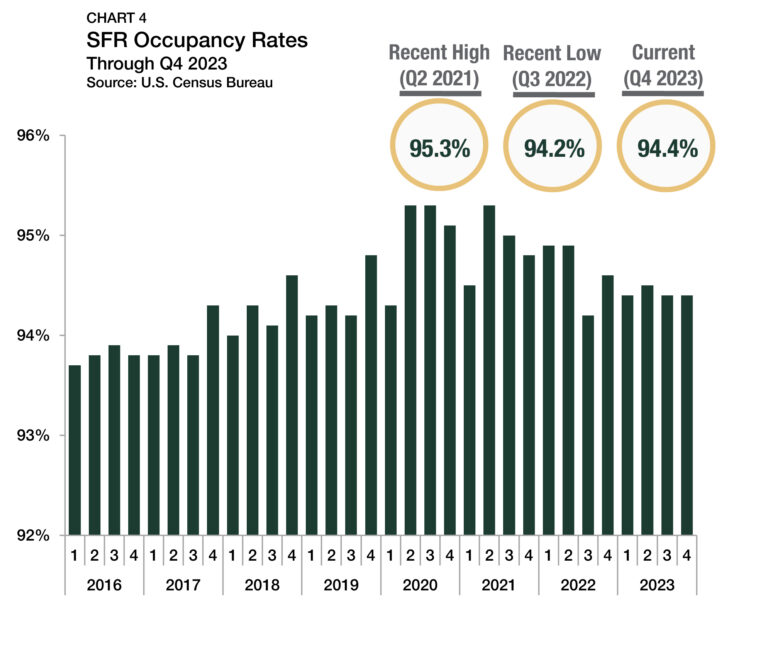
Occupancy rates across all SFR property types averaged 94.4% in the fourth quarter of 2023, remaining unchanged from the previous quarter, according to U.S. Census Bureau data (Chart 4). DBRS Morningstar reported a similar SFR vacancy rate of 92.8% in November 2023.
Rent Growth
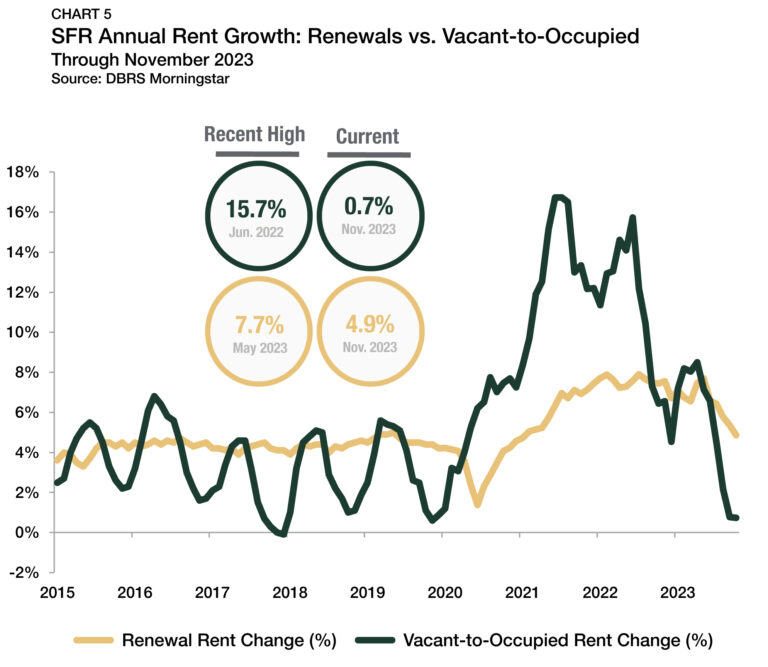
According to data from DBRS Morningstar, vacant-to-occupied (V2O) annual rent growth resumed a pattern of seasonality that was commonplace before the pandemic. Through October 2023, V2O rents are up just 0.7% from a year earlier (Chart 5). With V2O rent growth having now slid for five consecutive months, its recent performance matches the 2015-2019 trend in which price pressures peak in the early summer and reach a bottom in the early winter.
Meanwhile, annual rent growth of SFR lease renewals has gradually decelerated from record highs. After renewal rent growth peaked at 7.9% in July 2022, the pace of its increase has slowed in 11 of the last 15 months. Through October 2023, renewal rent growth increased 4.9% — a slight elevation from the 2015-19 average of 4.3%. Further, October was the first time in 33 months that SFR renewal rent growth failed to eclipse 5.0%, a departure from a prolonged period of sustained gains.
Cap Rates
SFR cap rates ascended again in the fourth quarter of 2023, jumping 22 bps to settle at 6.3% (Chart 6).1 Cap rates have now risen in four of the past six quarters, increasing by a total of 93 bps in that time. SFR cap rates have now hit their highest point since the second quarter of 2020. With interest rates still elevated, investors have been broadly revising their yield requirements.
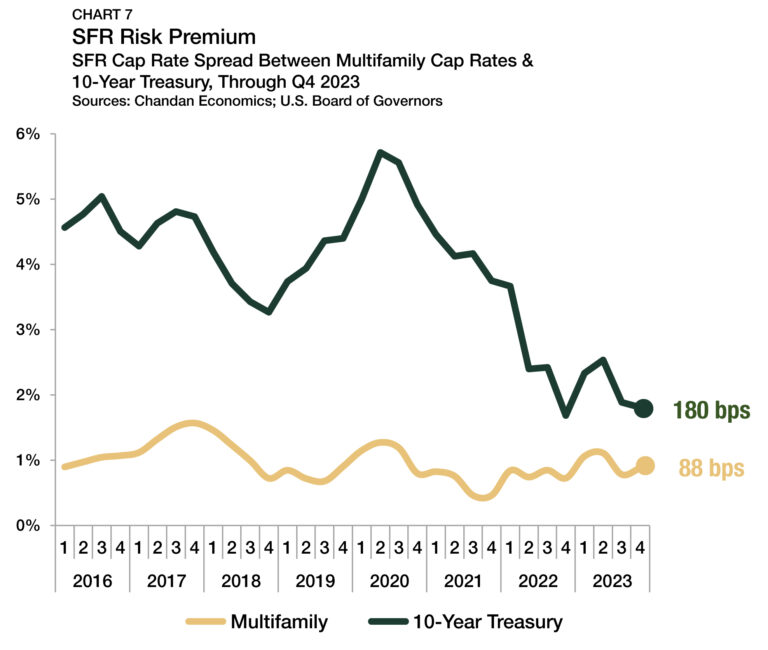
The spread between SFR cap rates and 10-year Treasury yields approximates the SFR risk premium. While SFR cap rates rose in the fourth quarter, Treasury yields jumped slightly, causing the SFR risk premium to slide to 180 bps (Chart 7). From the previous quarter, the SFR risk premium shrank by nine bps. Further, the SFR risk premium sits just 12 bps above its all-time low of 169 bps reached one year ago. Meanwhile, the spread between SFR and multifamily properties widened slightly by 10 bps, averaging 88 bps in the fourth quarter of 2023.
Pricing
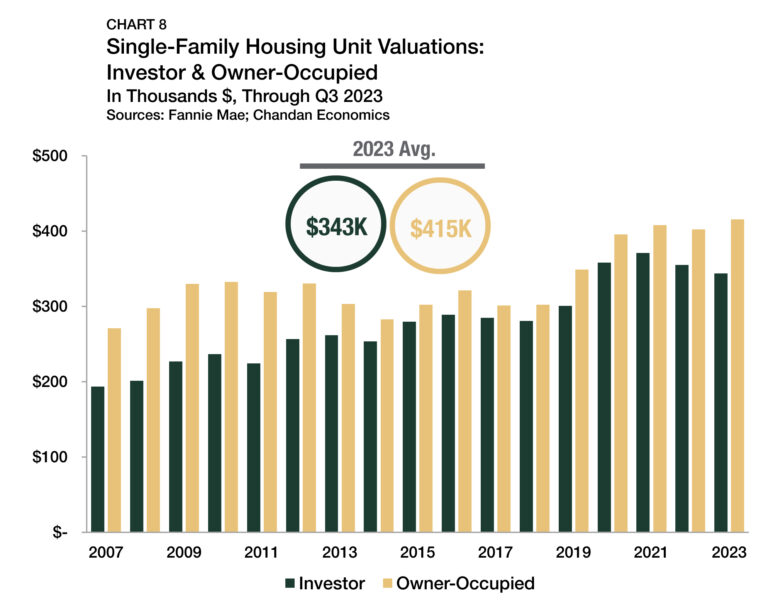
There are consistent differences between the average assessed property values on mortgages originated to single-family owner-occupants versus single-family investors. Underwriters consider factors such as vacancies, turnover, and management-related expenses that owner-occupied units do not have, contributing to lower assessed values for rental units. Additionally, investors are incentivized to target value-add assets rather than paying top dollar for existing value.
Through the third quarter, the average valuation of a single-family rental that had received a Fannie Mae mortgage in 2023 was $343,498 — down 3.2% from the 2022 average (Chart 8). Average valuations for owner-occupied units increased 3.3% during the same time, reaching $415,281. Subsequently, the average underwritten valuation gap between the two groups of properties has increased to 17.3% through the three-quarters mark of 2023 — its widest point since 2012.
The drop-off in SFR valuations on Fannie Mae mortgages is the likely result of investors becoming more selective. Investors want to have a high degree of confidence that their asset will appreciate over the short term to justify making a purchase. In a housing market with fewer trades, many investors require higher yields and lower prices to execute an acquisition.
Debt Yields
Debt yields, a key measure of credit risk, jumped during the fourth quarter of 2023, rising by 33 bps to land at 10.3% (Chart 9). The increase marked the sixth time debt yields have risen in the past eight quarters, highlighting that lenders have remained cautious in an unsettled investment climate. The rise in debt yields in recent quarters translates to SFR investors securing less debt capital for every dollar of property-level net operating income (NOI). Through the fourth quarter of 2023, SFR debt declined to $9.69 for every dollar of NOI, a decrease of $0.33 from the previous quarter and a drop of $1.29 from the same time last year.
Supply & Demand Conditions
Residential Distress
Even with mortgage rates reducing homebuyer demand, there is an equal (if not greater) impact on housing supply. According to a July 2023 analysis by Apollo, a majority of mortgages outstanding had an annual interest rate below 4.0%. The difference between what homeowners pay on existing mortgages and what they would have to pay on a new mortgage is often significant. As a result, the housing market is locked into a so-called golden handcuffs effect.
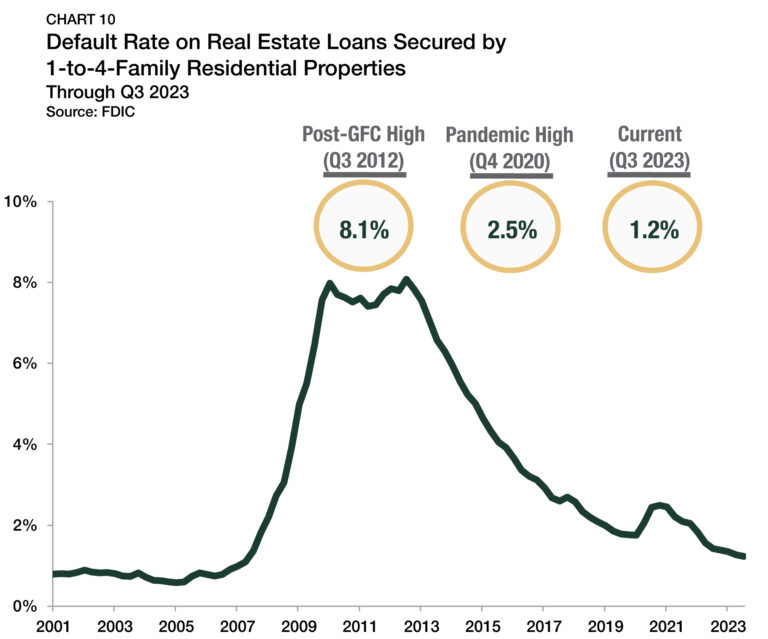
Despite fewer buyers in the market, the dearth of available inventory means that sellers are still receiving favorable pricing. Further, the labor market remains robust. Altogether, these factors are leading to a housing market distress environment that is practically nonexistent. According to the Federal Deposit Insurance Corporation (FDIC), mortgage default rates fell to a new post-financial crisis low of 1.2% in the third quarter of 2023, declining four bps from the prior quarter (Chart 10).
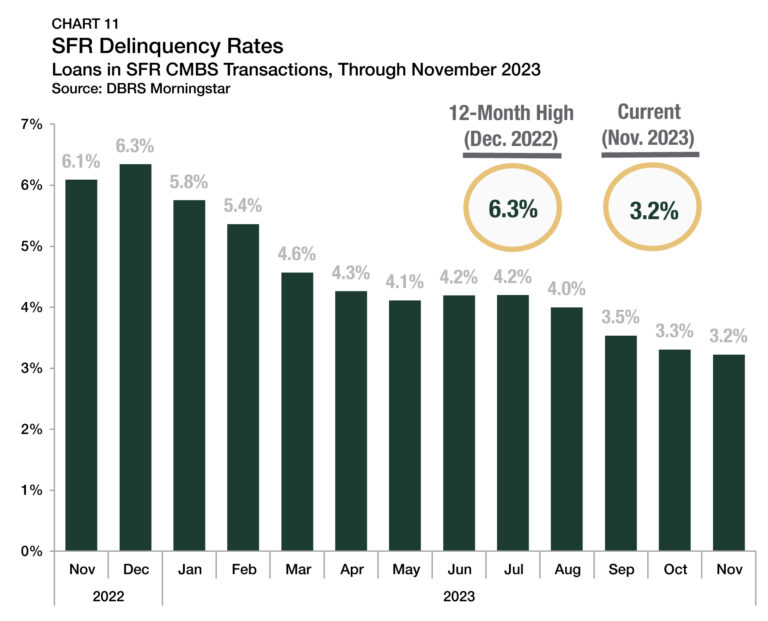
Evidence suggests that distress within the SFR sector mirrors the broader single-family ecosystem. According to DBRS Morningstar, within rated SFR CMBS transactions, only 3.2% of loans were delinquent in November 2023 — nearly half the 6.3% rate reported at the end of 2022 (Chart 11).
Build-to-Rent
BTR communities have become a defining feature of the SFR sector. Through the fourth quarter of 2023, BTR production remains robust. Over the past 12 months, BTR accounted for 7.9% of all single-family construction starts, remaining near the record high for the product type (Chart 12). For comparison, before the SFR sector materialized in the aftermath of the 2007-09 recession, the BTR share of single-family construction never eclipsed 3.1%. By unit count, there were 75,000 BTR construction starts in 2023 — another all-time high and an increase of 8.7% from the 2022 total demonstrating a sustained surge in development.
Tracking Demand
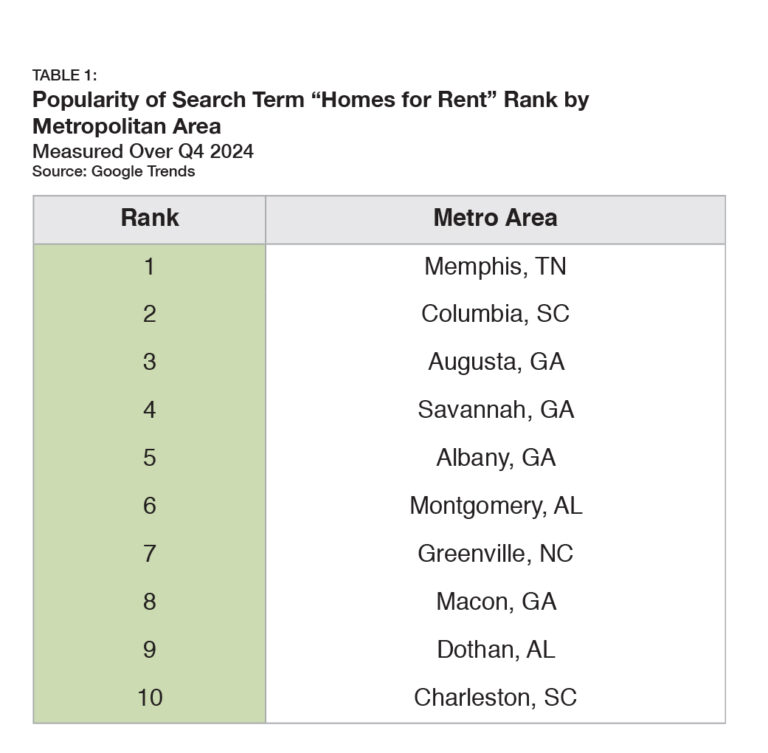
Google Trends can identify potential markets for high SFR demand by tracking the popularity of the search term “homes for rent.” In the fourth quarter of 2023, Memphis, TN, ranked highest in search volume for the term (Table 1). All the top 10 metros with the highest number of searches in Google for “homes to rent” are in five southeastern Sun Belt states (Tennessee, Georgia, South Carolina, Alabama, and North Carolina). While SFR communities have succeeded nationwide, the Southeast remains the sector’s epicenter thanks to favorable population growth trends and affordable living costs.
Outlook
Even as the Federal Reserve considers its time frame for lowering interest rates, the pace of any cuts is unlikely to match the speed at which the central bank raised rates in 2022 and 2023. As a result, interest rates that are higher for longer could serve as both a tailwind and a headwind through different channels.
On the one hand, malaise in SFR CMBS markets should be expected, and cap rates may have more room to grow. On the other hand, mortgage rates may not return to pre-2023 levels in the near term. According to Fannie Mae, 30-year mortgage rates are forecast to average 6.1% and 5.6% in 2024 and 2025, respectively. With homeownership remaining prohibitively expensive for many would-be buyers, SFR is positioned to absorb a sizeable portion of housing demand. On balance, the SFR sector continues to demonstrate strength amid economic turmoil, attracting increased attention from the broader multifamily investment community.
1 Unless otherwise noted, the Chandan Economics data covering single-family rental cap rates and debt yields are based on model estimates and a sample pool of loans. Data are meant to represent conditions at the point of origination.
For more single-family rental research and insights, visit arbor.com/research


