In any multifamily project, site selection is a critical step requiring careful consideration. From New York to Los Angeles and all the major metropolitan areas in between, U.S. metros are ripe for new investment, but narrowing down the optimal location is never easy. In a new video, Dr. Sam Chandan, one of the commercial real estate industry’s leading scholars, shares his expert insight into Arbor Realty Trust’s latest Top Markets for Multifamily Investment Report.
Single-Family Rental Investment Trends Report Q1 2025
Rent Growth Resumes Pre-Pandemic Patterns as CMBS Activity Climbs
Key Findings
- SFR/BTR construction starts remain strong as growth patterns stabilize.
-
SFR CMBS activity in 2024 rose nearly 200% compared to the prior year.
-
Annual SFR rent growth stabilized near 4.4%.
Table of Contents
State of the Market
The U.S. single-family rental (SFR) market shows strong signs of fundamental health, with the sector once again in growth mode.
Structural barriers to affordable homeownership remain high. Mortgage rates have held near 7% as tight inventory levels squeeze prices to all-time highs. As a result, SFR has attracted more households who want the amenities typically available in suburban homes but have found homeownership to be less attainable given current market dynamics.
SFR entered 2025 on solid footing after a strong performance last year. Structured capital markets rebounded significantly in 2024, rent growth settled back in line with pre-pandemic trends, and loan distress was negligible.
Altogether, signs point to the beginning of a period of normalcy. Marginally lower occupancy rates and an influx of new inventory have resulted in less aggressive development patterns. The SFR sector has matured, and its structural strengths remain front and center. Even amid ongoing economic volatility, SFR continues to be a well-positioned asset class that is expected to follow stable growth patterns.
Performance Metrics
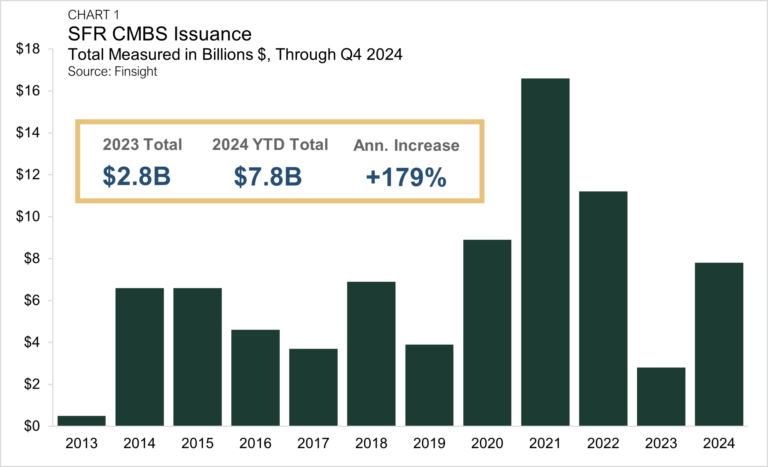
Structured SFR capital markets saw a marked uptick in activity last year. SFR CMBS issuance totaled $7.8 billion in 2024, a nearly three-fold increase over the 2023 total output (Chart 1). Two factors influenced last year’s SFR CMBS improvement: the structural strength of the SFR sector and higher levels of liquidity across the CMBS ecosystem. A recent Trepp analysis noted that investors and lenders have adjusted to the market reality of higher interest rates, allowing greater confidence and tighter spreads. While the 2024 year-end total did not reach the same level as highs recorded in 2021 or 2022, it did represent a welcome normalization. Last year was the fourth most active year ever for SFR CMBS issuance.
Occupancy and Retention
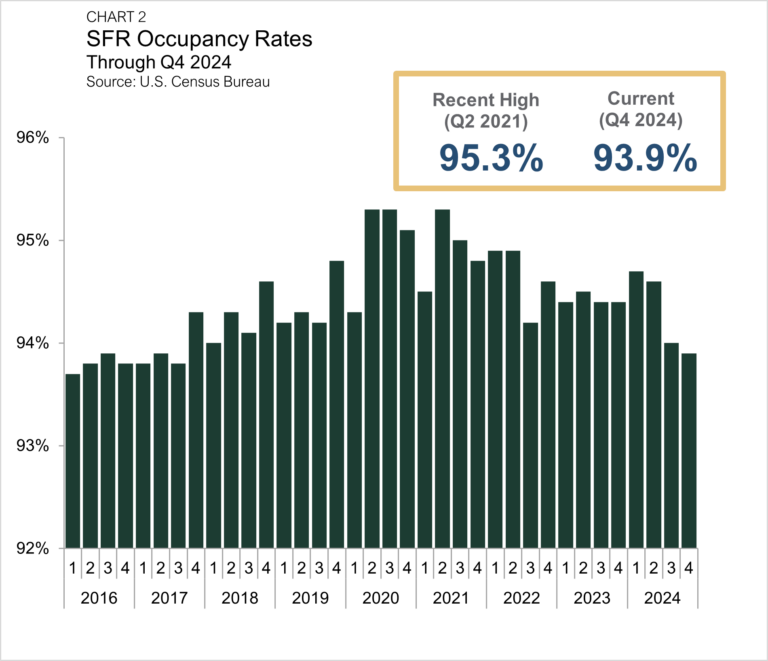
According to the U.S. Census Bureau, occupancy rates across all SFR property types averaged 93.9% in the fourth quarter of 2024 (Chart 2), which was 10 bps lower than in the third quarter, marking a third consecutive quarter of declines. Since mid-2021, SFR occupancy rates have dropped by a cumulative 140 bps. The recent pattern of falling SFR occupancy rates mirrors the rest of the rental housing sector’s trend line, which has seen a comparable 130 bps swing.
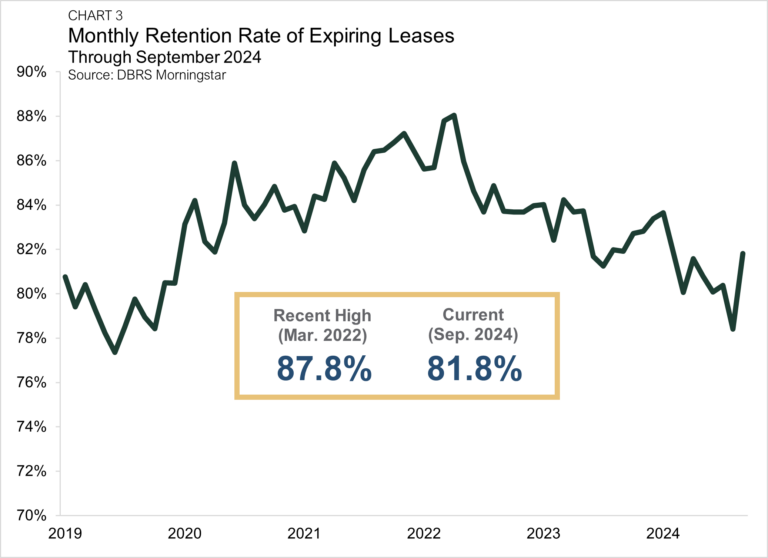
Data from DBRS Morningstar shows that retention rates for expiring leases dipped significantly over the past two-plus years. In the Spring of 2022, 88.7% of tracked SFR units with expiring leases re-signed for another year (Chart 3). Over the past six months, this share has dropped to the 78%-82% range, with the last available monthly reading at 81.8%. As fewer tenants re-sign leases, increased unit turnovers have placed downward pressure on occupancy rates.
Rent Growth: National
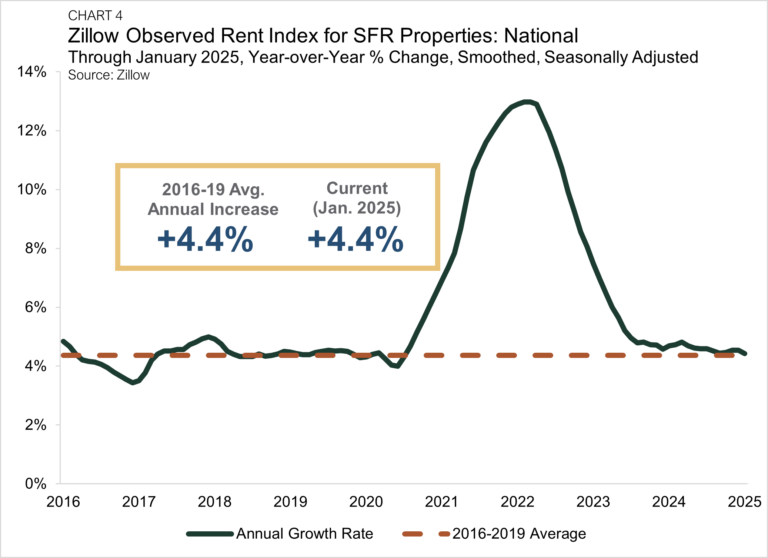
Nationally, SFR rent growth continued to increase at a healthy pace. According to Zillow’s Observed Rent Index, rents in the sector were up 4.4% from a year earlier through January 2025 (Chart 4). While rent growth has retreated from the double-digit growth rates of 2021 and 2022, its most recent pace remains in line with the sector’s pre-pandemic track record. Between 2016 and 2019, SFR rents grew at an average annual pace of 4.4%, identical to the current growth rate. Moreover, recent measurements indicate SFR growth has stabilized nationally. Over the past nine months, the annual SFR growth rate held in a tight window between 4.4% and 4.6%.
Rent Growth: Metros
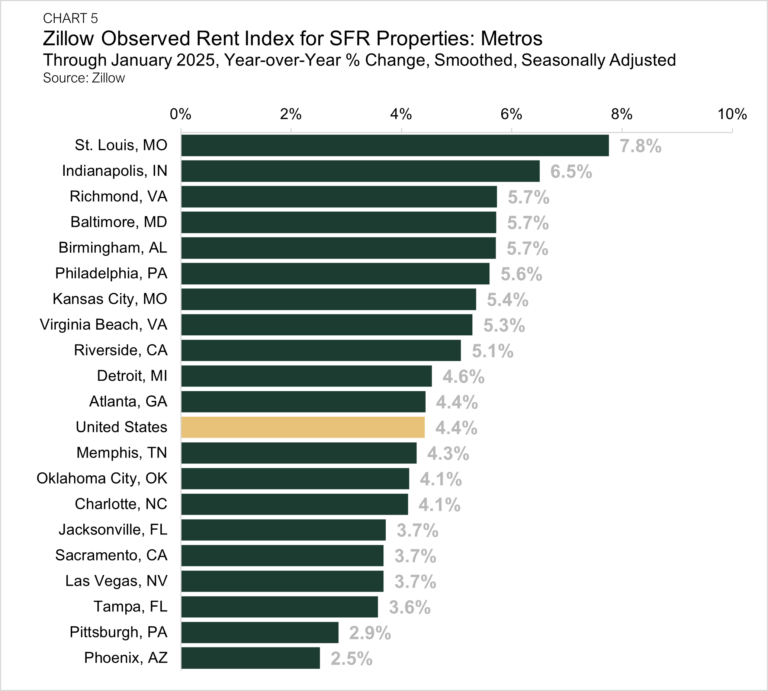
Among the top 20 hotspot markets — those with the highest SFR share of rentals across the top 50 metros by population — St. Louis, MO, continued to see the most robust levels of annual rent growth, with prices rising 7.8% from a year earlier through January 2025 (Chart 5). Indianapolis, IN (+6.5%) and Richmond, VA (+5.7%) ranked second and third, respectively, while Phoenix, AZ (+2.5%), Pittsburgh, PA (+2.9%), and Tampa, FL (+3.6%) finished at the bottom of the pack. Except for a few notable exceptions, many markets that accelerated the most during the post-pandemic boom are the areas where rent growth has been more sluggish during the past 12 months. Conversely, Midwest, Northeast, and Mid-Atlantic metros have recently outperformed markets in other regions.
Cap Rates
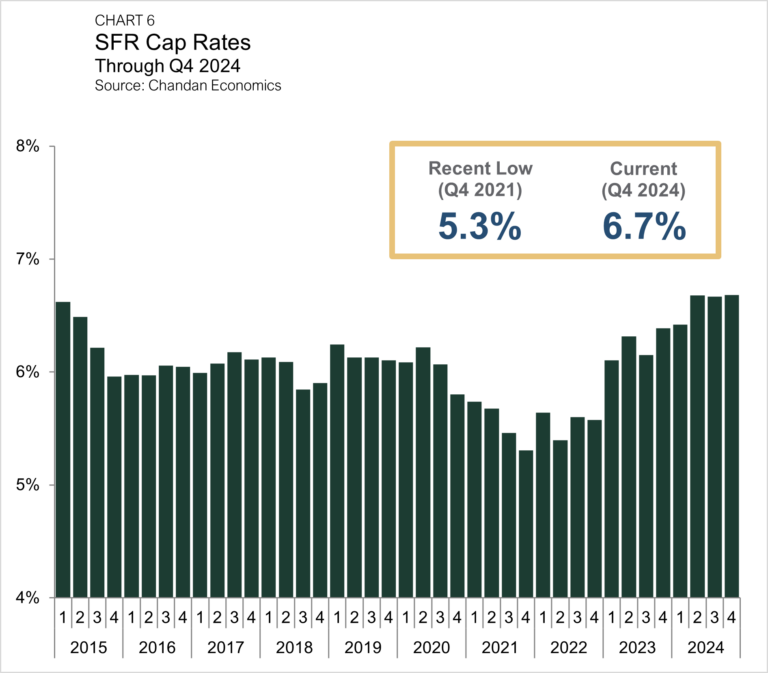
SFR cap rates remained unchanged in the fourth quarter of 2024, holding at 6.7% (Chart 6). Cap rates have now held steady at the 6.7% benchmark for three consecutive quarters. Before a period of stabilization settled in, cap rates jumped by a cumulative 137 bps between late 2021 and mid-2024, reflecting the impact of a higher interest rate environment.
1 Unless otherwise noted, the Chandan Economics data covering single-family rental cap rates and debt yields are based on model estimates and a sample pool of loans. Data are meant to represent conditions at the point of origination.
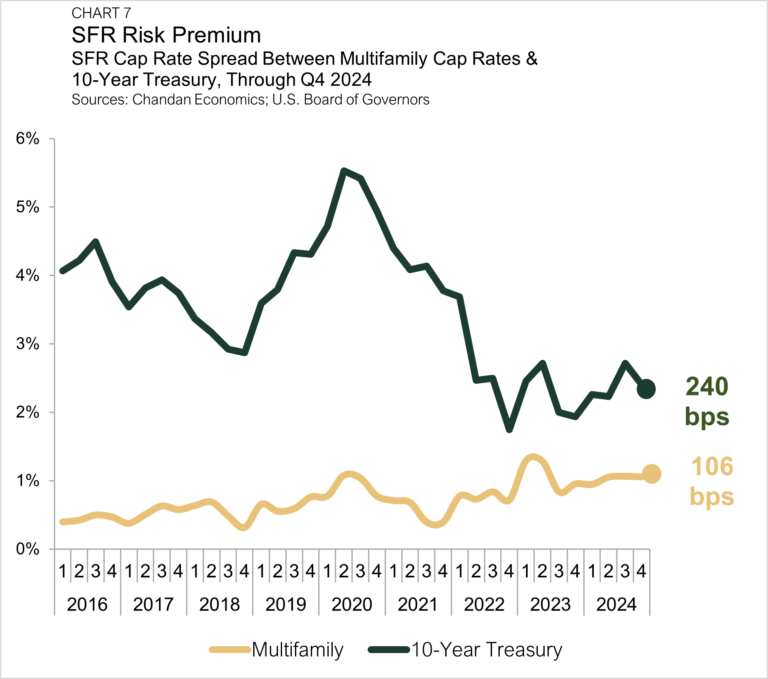
The spread between SFR cap rates and 10-year Treasury yields approximates the SFR risk premium. In the fourth quarter of 2024, 10-year Treasury notes carried an average yield of 4.3%, rising from 4.0% in the third quarter. With average Treasury yields rising and SFR cap rates flatlining, the SFR/Treasury risk premium compressed by 32 bps, settling at 240 bps in the fourth quarter (Chart 7). The spread between single-family rentals and multifamily properties remained unchanged from the previous quarter, averaging 106 bps.
Pricing
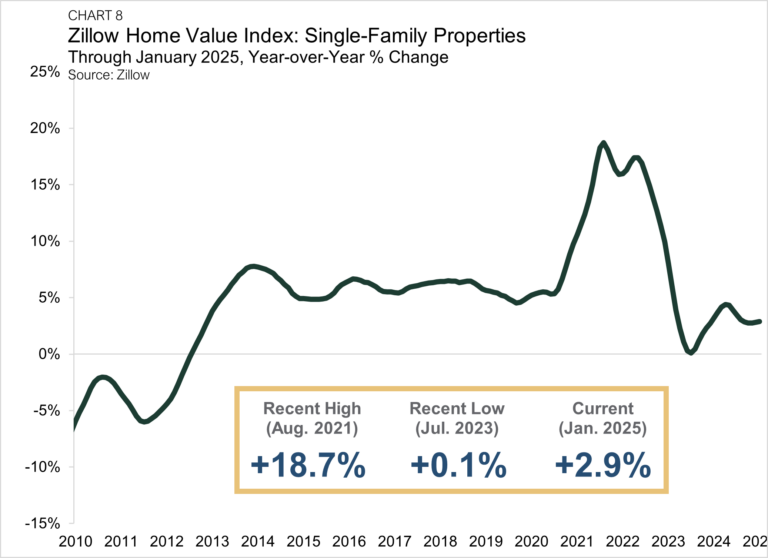
Single-family home valuations continued to rise through January 2025, according to Zillow’s Home Value Index. The average valuation for a single-family property in the U.S. increased to $356,002 — up 2.9% from a year earlier (Chart 8). Single-family home prices soared at double-digit growth rates in 2021 and 2022 as low mortgage rates and pandemic-era migration trends caused a record increase in buyer demand. More recently, home appreciation has been moderating, although with mortgage rates near 7%, even marginal appreciation levels are noteworthy.
Debt Yields
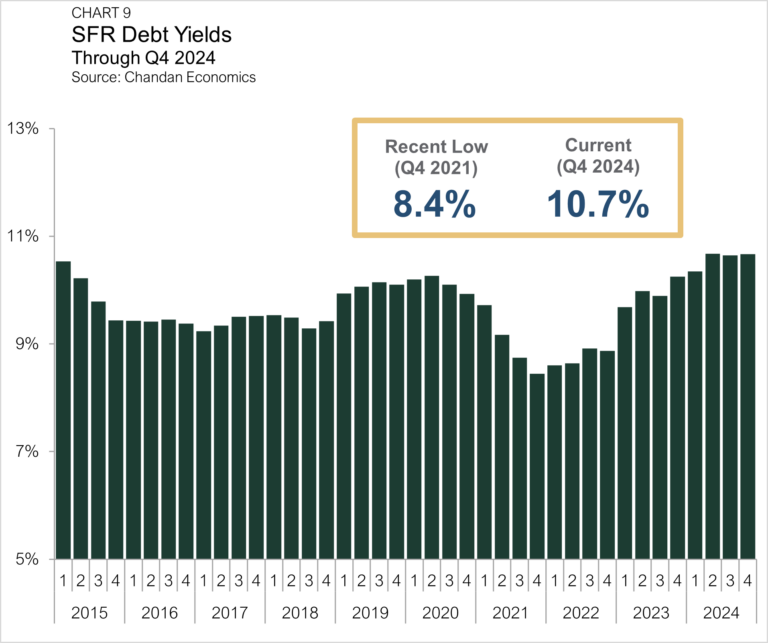
Debt yields, a key measure of credit risk, rose marginally during the fourth quarter of 2024, increasing two bps to finish at 10.7% (Chart 9). Compared to a low of 8.4% in the fourth quarter of 2021, debt yields are now 222 bps higher. The rise in debt yields in recent quarters means SFR investors are securing less debt capital for every $1.00 of property-level net operating income (NOI). Through the fourth quarter of 2024, SFR investors secured an average of $9.38 of debt for every $1.00 of NOI — down $2.47 from a 2021 peak and $0.38 lower than the same time last year.
Residential Distress
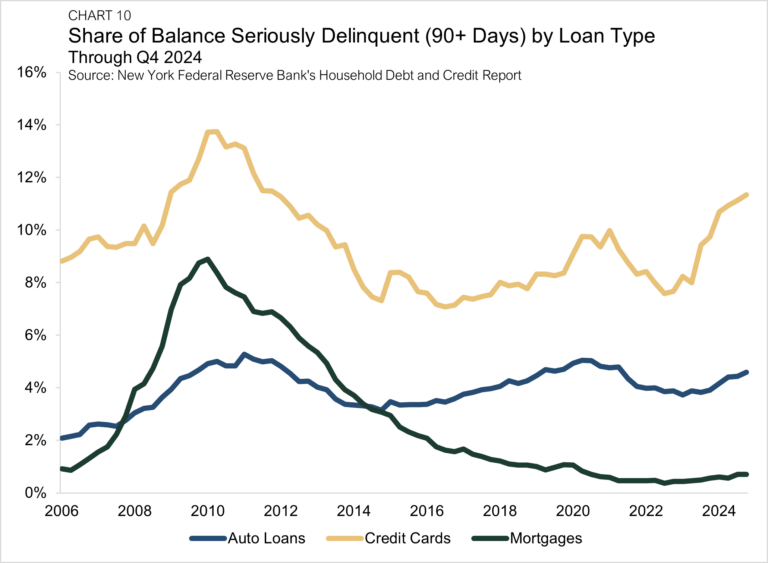
Even with elevated mortgage interest rates, there has been little to no distress across the U.S. housing market. The Federal Reserve Bank of New York’s Q4 2024 Quarterly Report on Household Debt and Credit indicated that only 0.7% of household mortgages were more than 90 days delinquent through the fourth quarter of 2024 — a 0.4 percentage point decrease from the start of the pandemic (Chart 10).
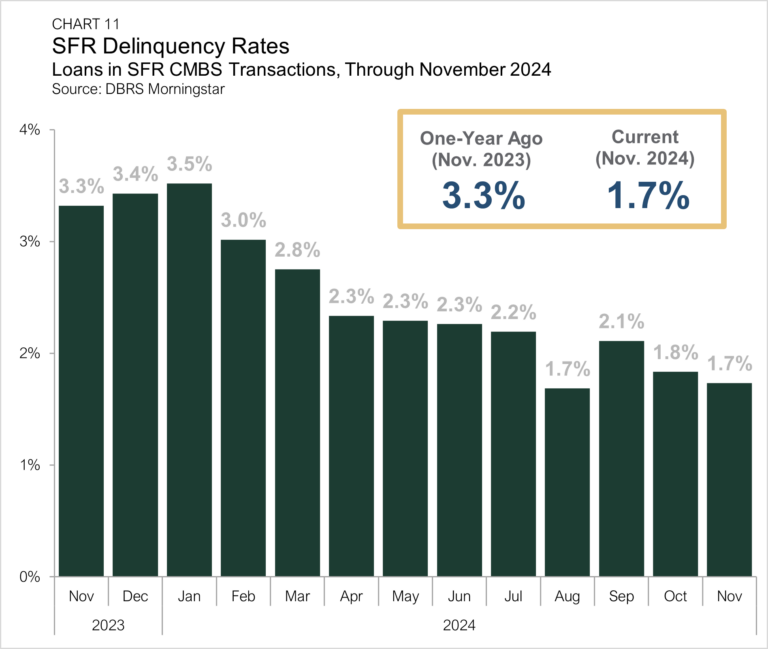
Within the SFR sector, data indicates that distress patterns have mirrored trends in the broader single-family ecosystem, with delinquency rates remaining low. According to DBRS Morningstar, 1.7% of loans within rated SFR CMBS transactions were delinquent in November 2024 — nearly half the delinquency rate recorded a year earlier (Chart 11).
Supply & Demand Conditions
Build-to-Rent (BTR)
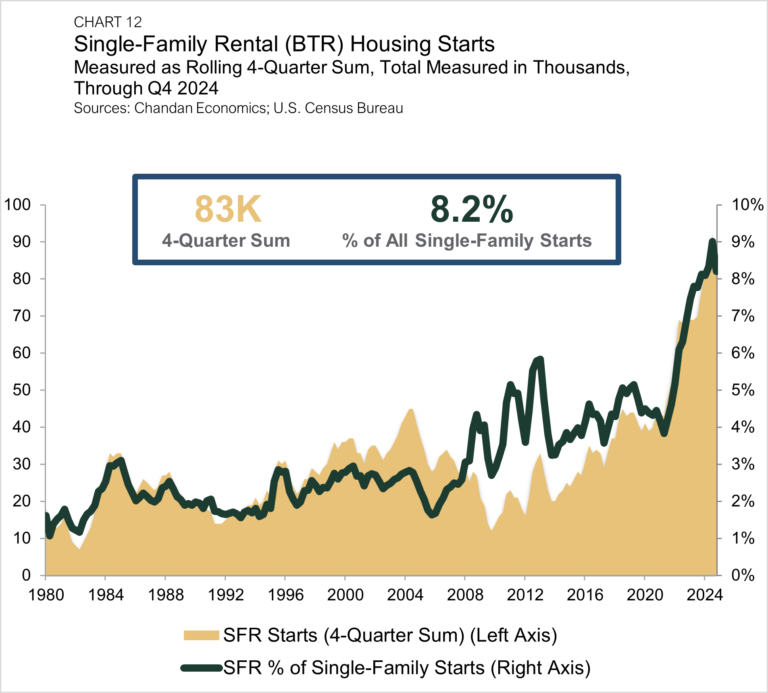
Build-to-rent (BTR) has cemented its place as a driving force of SFR growth. The construction of purpose-built communities is popular with both renters and investors. Through the fourth quarter of 2024, the BTR development pipeline remained robust, with 83,000 units started during the previous 12 months.
Over the past 12 months, BTR accounted for 8.2% of all single-family construction starts, down from a record high of 9.0% in the third quarter (Chart 12). BTR’s share of single-family development now stands approximately where it was one year ago, as construction activity showed signs of returning to more moderate patterns.
BTR construction over the 12 months ending in the fourth quarter of 2024 was down from the record high of 92,000 units posted in the third quarter. However, the rolling annual sum remains up by 7.8% compared to a year ago. Following over a decade of increased BTR development activity, year-end data indicates construction patterns have stabilized.
Outlook
With Fannie Mae having forecasted mortgage interest rates will remain at or above 6.5% through 2026, it is improbable that homeownership will become much more affordable in the near term. As households of all generations weigh their housing options, single-family rental homes in suburban settings are a viable option for many would-be buyers. While SFR communities continue to attract new renters, the quality rental units with amenities have also boosted tenant retention. New research from Point2Homes suggests that the average length of tenancy in SFR households has grown.
Factors like these and many others give strength to SFR’s demand profile. Although BTR development slowed in the fourth quarter, the decline may signal the beginning of a maturation of the sector as a record number of new units have been absorbed. While challenges remain in a volatile economic environment, SFR has emerged as a crucial piece of the U.S. housing ecosystem that is well-positioned for short- and long-term growth.
For more single-family rental research and insights, visit arbor.com/research
Disclaimer
This report is intended for general guidance and information purposes only. This report is under no circumstances intended to be used or considered as financial or investment advice, a recommendation or an offer to sell, or a solicitation of any offer to buy any securities or other form of financial asset. Please note that this is not an offer document. The report is not to be considered as investment research or an objective or independent explanation of the matters contained herein and is not prepared in accordance with the regulation regarding investment analysis. The material in the report is obtained from various sources per dating of the report. We have taken reasonable care to ensure that, and to the best of our knowledge, material information contained herein is in accordance with the facts and contains no omission likely to affect its understanding. That said, all content is provided herein “as is” and neither Arbor Realty Trust, Inc. or Chandan Economics, LLC (“the Companies”) nor their affiliated or related entities, nor any person involved in the creation, production and distribution of the content make any warranties, express or implied. The Companies do not make any representations or warranties, express or implied, as to the reliability, usefulness, completeness, accuracy, currency nor represent that use of any information provided herein would not infringe on other third-party rights. The Companies shall not be liable for any direct, indirect or consequential damages to the reader or a third party arising from the use of the information contained herein. There may have been changes in matters which affect the content contained herein and/or the Companies subsequent to the date of this report. Neither the issue nor delivery of this report shall under any circumstance create any implication that the information contained herein is correct as of any time subsequent to the date hereof or that the affairs of the Companies have not since changed. The Companies do not intend, and do not assume any obligation to update or correct the information included in this report. The contents of this report are not to be construed as legal, business, investment or tax advice. Each recipient should consult with its legal, business, investment and tax advisors as to legal, business, investment and tax advice. The information contained herein may be subject to changes without prior notice. This report is only intended for the recipients, and should not be copied or otherwise distributed, in whole or in part, to any other person.


