With homebuying out of reach for many, more tenants are staying in the rental market longer than in previous cycles. This dynamic offers multifamily investors a strategic opportunity to focus on tenant retention, according to Dr. Sam Chandan, one of the commercial real estate industry’s leading scholars, who recently shared his expert insights on the 2026 Housing Outlook webinar with RentRedi.
Single-Family Rental Investment Trends Report Q2 2022
Rent Growth and New Construction Trend Higher as Cap Rates Edge Lower
Key Findings
- Vacant-to-occupied rent growth surges again, reaching 14.8% year-over-year.
- Cap rates slide back to 5.3%, just above all-time lows.
- Build-to-rent construction starts totaled 57,000 over the past year, a new record high.
Table of Contents
State of the Market
At a time when economic growth is slowing, the single-family rental (SFR) market is flourishing.
The cost of homeownership rose again in the second quarter, with 30-year fixed mortgage rates averaging 5.3% — their highest quarterly average since 2008. Even as there are reports of new homebuyer momentum cooling, prices remain near record highs. The combination of record prices and high borrowing costs is now leading would-be homeowners to seek alternatives, supporting the demand for SFR.
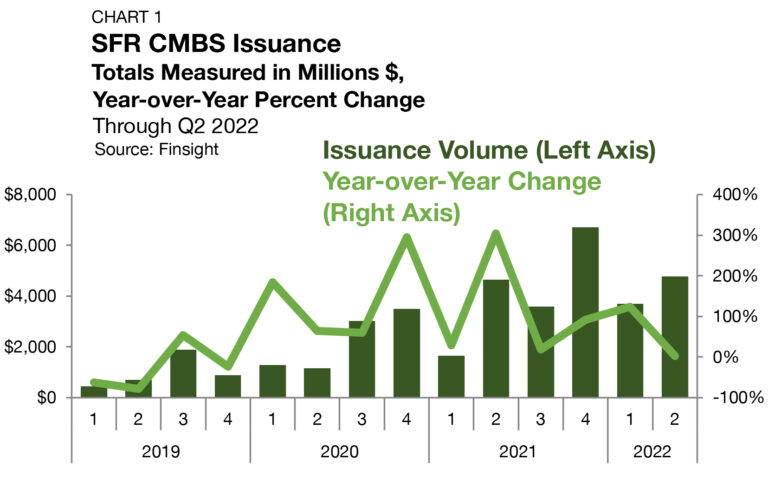
In the CMBS market, SFR issuance reached a record $16.6 billion in 2021 — nearly doubling 2020’s total of $8.9 billion, according to Finsight. Through the second quarter of 2022, issuance soared 34% above the mark set at 2021’s midpoint (Chart 1) to reach $8.5 billion. Further, SFR’s market cap reached $4.4 trillion.
The growing success of the SFR sector has not gone unnoticed, including on Capitol Hill. In late June, the U.S. House Committee on Financial Services convened a hearing to explore the role single-family investors have played in declining affordability. According to the testimony of Brookings Metro Senior Fellow Jenny Schuetz, the growth of the institutional SFR sector has been a symptom, not a cause, of tight housing markets. Her testimony is in line with recent research from Freddie Mac that identifies record-low mortgage rates and limited new homebuilding as the primary culprits for declining home affordability. Further, according to a recent Arbor-Chandan analysis, the overall share of rentals in the housing market has remained balanced in recent years, even with the growing wave of institutional participation.
On balance, the specter of potential market-limiting legislation cannot be ignored. At the same time, the sector is well-positioned to see continued growth in the second half of 2022. SFRs are uniquely capable of offsetting the effects of inflation through annual rent renewals, and the sector remains insulated from a potential impending recession as would-be homebuyers are re-engaging with the rental market in larger numbers.
Performance Metrics
Originations
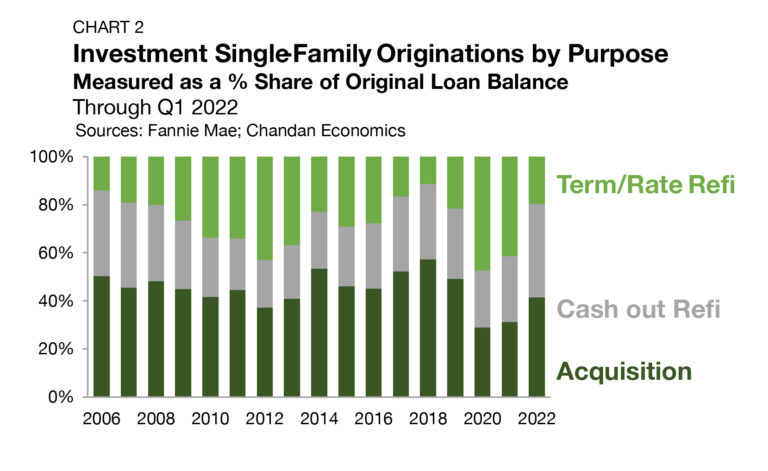
According to a Chandan Economics analysis of Fannie Mae data, a lending source for mostly non-institutional borrowers, refinancing, instead of acquiring, has accounted for the majority of recent originations to single-family investors. However, as the Federal Reserve has kicked off its monetary tightening cycle and market interest rates have risen in 2022, the splits between acquisitions and refinancings have started to look more balanced. In 2020, refinancing activity accounted for 71.0% of tracked originations (Chart 2). In 2021, the refinancing share remained elevated at 68.8%. Through the first quarter of 2022, the refinancing share dropped all the way down to 58.5% of originations. The decline was driven by a significant decrease in term/rate refinancings. Term/rate refinancings accounted for 47.3% and 41.3% of SFR originations in 2020 and 2021, respectively. So far in 2022, they have only accounted for 19.5% of originations.
Occupancy
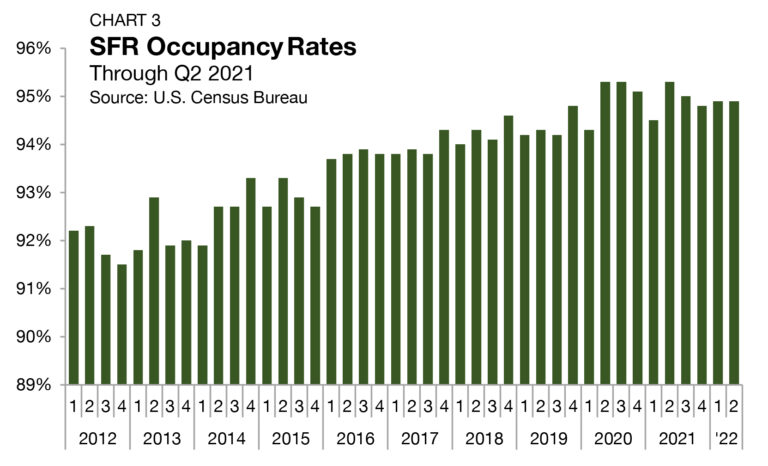
As measured by the U.S. Census Bureau, occupancy rates across all SFRs averaged 94.9% in the second quarter of 2022, holding steady from the first quarter of the year (Chart 3). The second-quarter reading keeps the SFR occupancy rate within 40 basis points (bps) of its generational high — indicating that the sector is operating at or near full potential occupancy.
Rent Growth
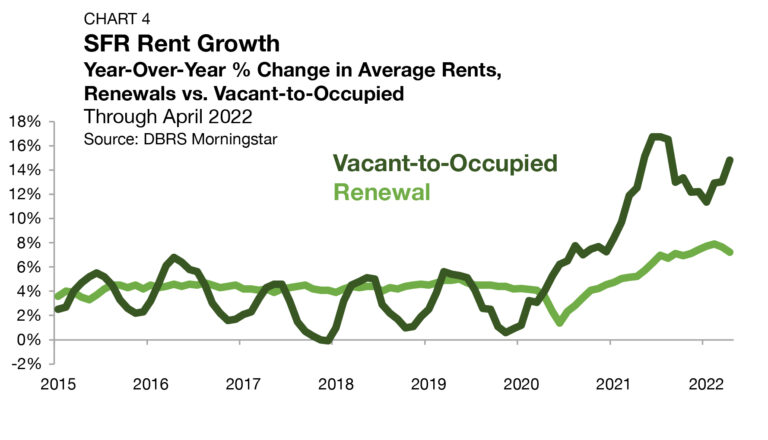
According to DBRS Morningstar, vacant-to-occupied (V2O) annual rent growth accelerated to an unprecedented high of 16.7% in July 2021 (Chart 4). Thereafter, rent growth on new leases slowed, lessening in four of the next six months. V2O rent growth totaled 11.4% year-over-year in January 2022, and while it remained high by historical standards, the pattern was clearly that of falling momentum. Then, surprisingly, V2O re-inflected in February and posted higher totals in three consecutive months through May. By the end of May 2022, rents on new leases were up 14.8% from a year earlier.
The ‘twin peaks’ of extraordinarily robust SFR rent growth over the last two years can be attributed to two independent forces. A wave of new single-family housing demand during the COVID-19 pandemic and an increase in hybrid work adoption led to what can be best described as a recalibration of market pricing. The more recent surge in rent growth is attributable to high levels of inflation, which operators consider when resetting rents.
For lease renewals, annual rent growth slid to 7.2% in April, the most recent reading. This was down from the all-time high of 7.9% in February, although remained well above baseline levels of growth. Between 2015 and 2019, SFR renewal rent growth consistently ranged between 3.3% and 5.0%.
Analyzing rent growth at the market level, unsurprisingly, the Sun Belt has maintained its dominance. According to CoreLogic’s Single-Family Rent Index, annual rent growth across the top 20 U.S. metros through May was highest in Miami (39.5%), Orlando, (24.8%), and Las Vegas (16.7%). All of the tracked Sun Belt metros saw rent growth totals above 9.7% in the year ending May 2022.
Cap Rates
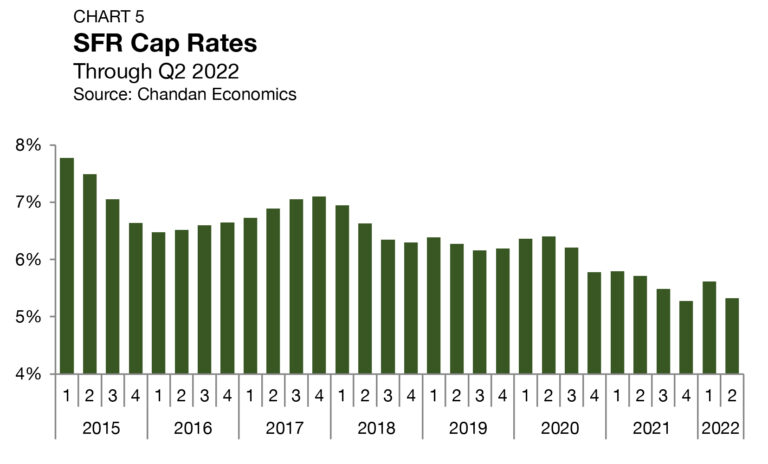
Property-level yields for SFR assets ticked down in the second quarter of 2022, falling by 29 bps to settle at 5.6% (Chart 5).1 The second-quarter observation brings SFR cap rates within 5 bps over their all-time low in the fourth quarter of 2021. According to the S&P/Case-Shiller National Home Price Index, U.S. home prices were up 19.8% from a year ago through May 2022. With single-family annual home price growth reaching record highs over the past year, it has created downward pressure on SFR cap rates. However, home price growth is losing momentum throughout the country. If home price appreciation recedes from its record high levels and SFR rent growth maintains its pace, SFR cap rates are likely to see some upward influence through the second half of 2022. Historically,
rent inflation trends lag behind the overall inflation rate, making the above scenario more likely.
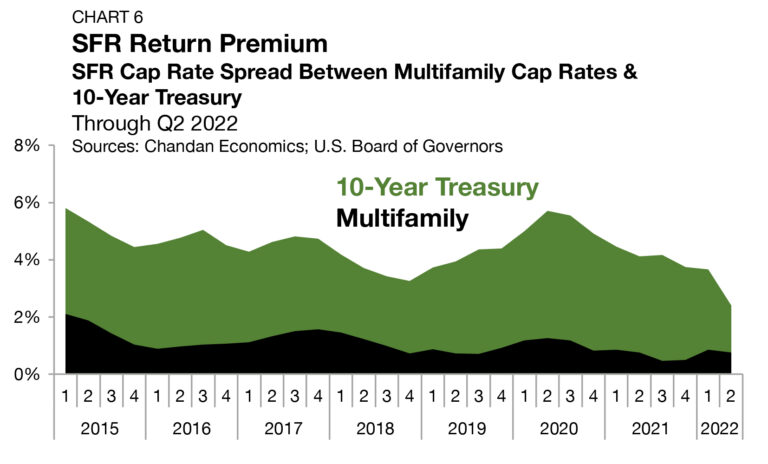
Compressing SFR yields in the second quarter of 2022 matched with growing Treasury yields causing the risk spread to narrow by a weighty 127 bps. In total, the risk premium sits at just 239 bps — its lowest rate on record by a sizeable 87 bps (Chart 6).
The cap rate spread between SFR assets and multifamily properties also narrowed, albeit by a more marginal 10 bps, settling at 76 bps. Over the past decade, SFR-multifamily cap rate spreads have narrowed from a high of 496 bps in 2012 to the sub-100 bps levels observed today. Increased liquidity and tech adoption have allowed the SFR sector to operate more efficiently over the past decade, generating a bid-down of its risk premium. Over the long term, some positive yield differential between SFR and multifamily assets remains likely — accounting for the co-location efficiencies and shared physical inputs.
Pricing
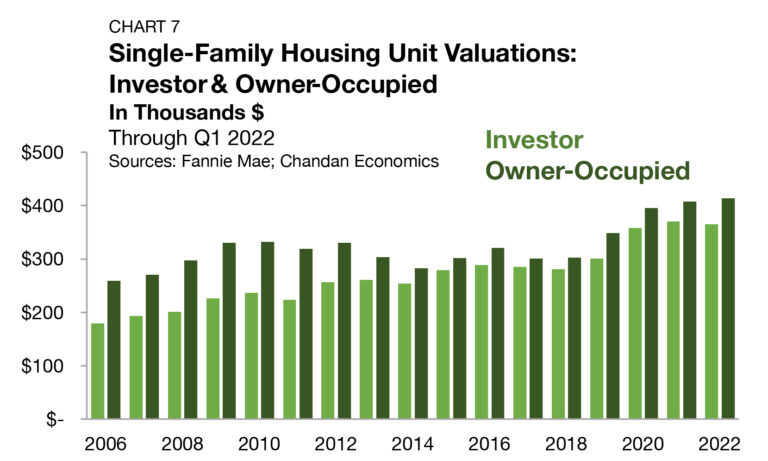
According to a Chandan Economics analysis of Fannie Mae securitized mortgages, there are material differences between the average assessed property values on mortgages originated to single-family owner-occupants versus single-family investors. The average underwritten value of a single-family investment property in 2022 has averaged $365,313 compared to $413,988 for owner-occupied units (Chart 7).
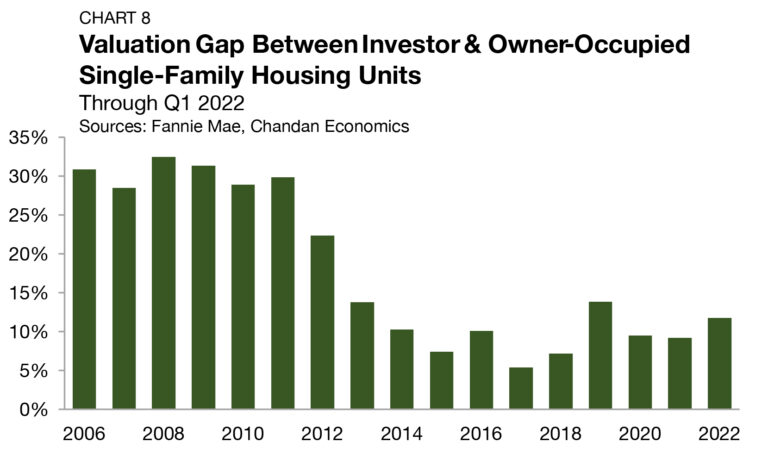
Through the first quarter of 2022, there is an average valuation gap of 11.8% on units purchased for investment vs. for an owner-occupant — an increase of 258 bps from the 2021 average. Several factors are likely to contribute to this valuation gap, one being that many investors are targeting value-add assets rather than paying top dollar for value that already exists. Additionally, investor-owned SFR properties have vacancy, turnover, and management-related expenses that owner-occupied units do not have to account for, contributing to lower values for these types of rental units. Nevertheless, the gap has narrowed dramatically over the past decade.
Between 2004 and 2011, the valuation gap sat in a consistent range of 27.2% to 32.5% (Chart 8). As more investors and capital entered the SFR space, discounted investment units became harder to find and competition for inventory ramped up, sending the valuation gap to an all-time low of 5.4% in 2017. With demand for single-family housing reaching a fever pitch leading up to and through the pandemic, the valuation gap has rebounded in recent years.
Debt Yields
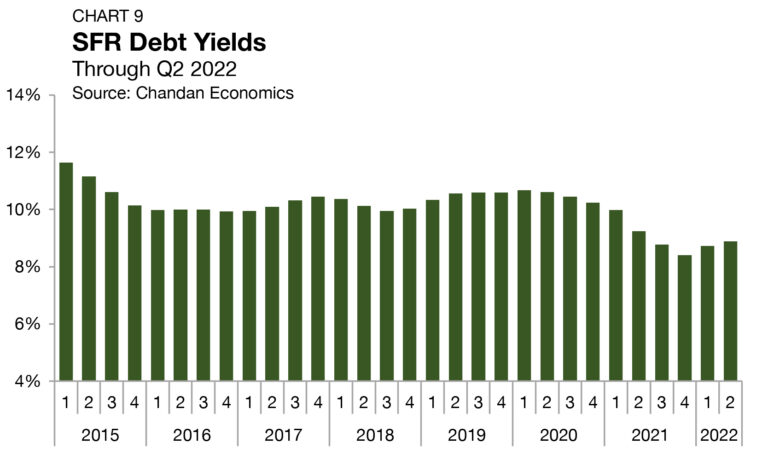
Debt yields, a key measure of credit risk, rose by 15 bps during the second quarter of 2022, settling at 8.9% (Chart 9). The increase marked the second consecutive quarterly increase after nearly two years of uninterrupted declines.
Supply & Demand Conditions
Residential Default Rates
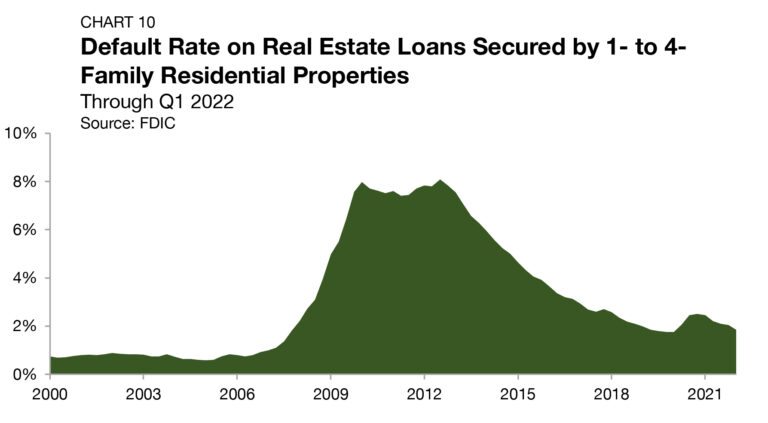
During the 2008 housing crisis, investors with available financing took advantage of the market dislocation, acquiring large portfolios of single-family assets at steep discounts. Residential mortgage
default rates peaked at 8.1% in 2012, leading to an abundance of distressed sales and accelerated institutional growth in the SFR sector (Chart 10).
Build-to-Rent
Purpose-built SFR properties, known as build-to-rent (BTR) communities, continue to become a defining feature of the SFR sector, especially within the institutional slice of the market.
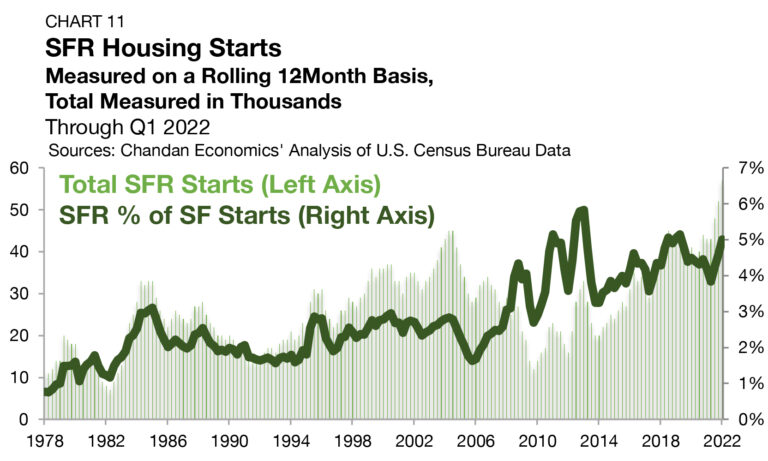
Based on an analysis of Census Bureau data, between 1975 and the start of the prior recession in 2007, BTRs accounted for a little less than 2.0% of all single-family construction starts (Chart 11). In 2013, BTR’s percentage share of construction starts reached an all-time high of 5.8%, and through the first quarter of 2022, the share remained elevated at 5.0%. Moreover, the BTR share of single-family home construction has increased for three consecutive quarters.
Tracking Demand
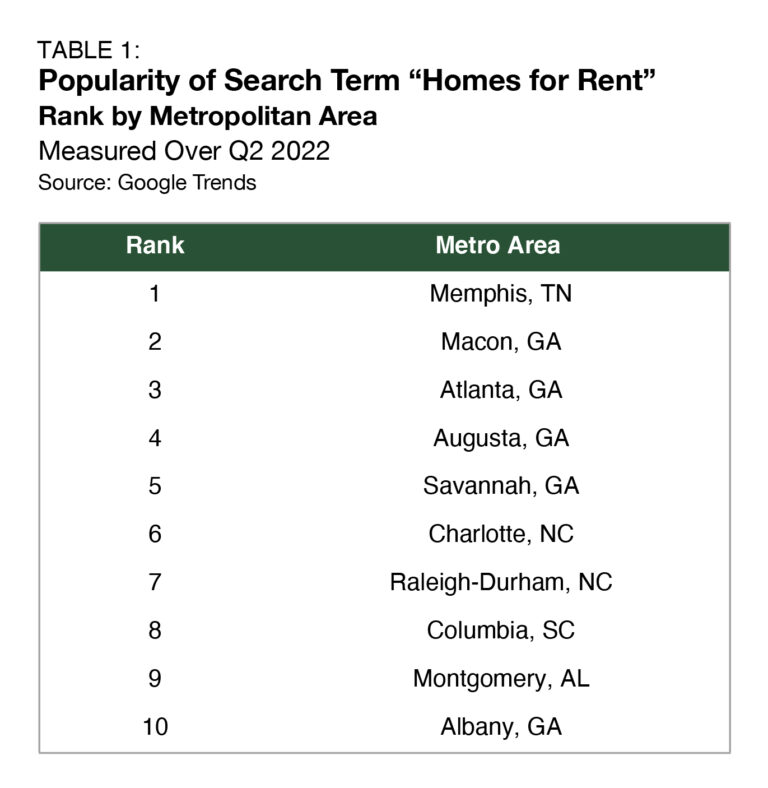
Utilizing Google Trends, the popularity of the search term “homes for rent” can shed light on the hotspots of SFR demand in different markets across the country. Memphis, TN, was the area where this term was searched most during the second quarter of 2022, dethroning Savannah, GA, which had seen the highest search frequency in the previous quarter (Table 1).
The Sun Belt continues to be the region driving the most SFR demand, with the southeast corner of the country being its tightly packed epicenter. All of the metros in the top 10 are located in just five states: Georgia, Tennessee, South Carolina, Alabama, and North Carolina. Affordability, lower taxes, and warmer weather are among the leading reasons why these states top the list.
Outlook
For more single-family rental research and insights, visit arbor.com/articles


