Articles
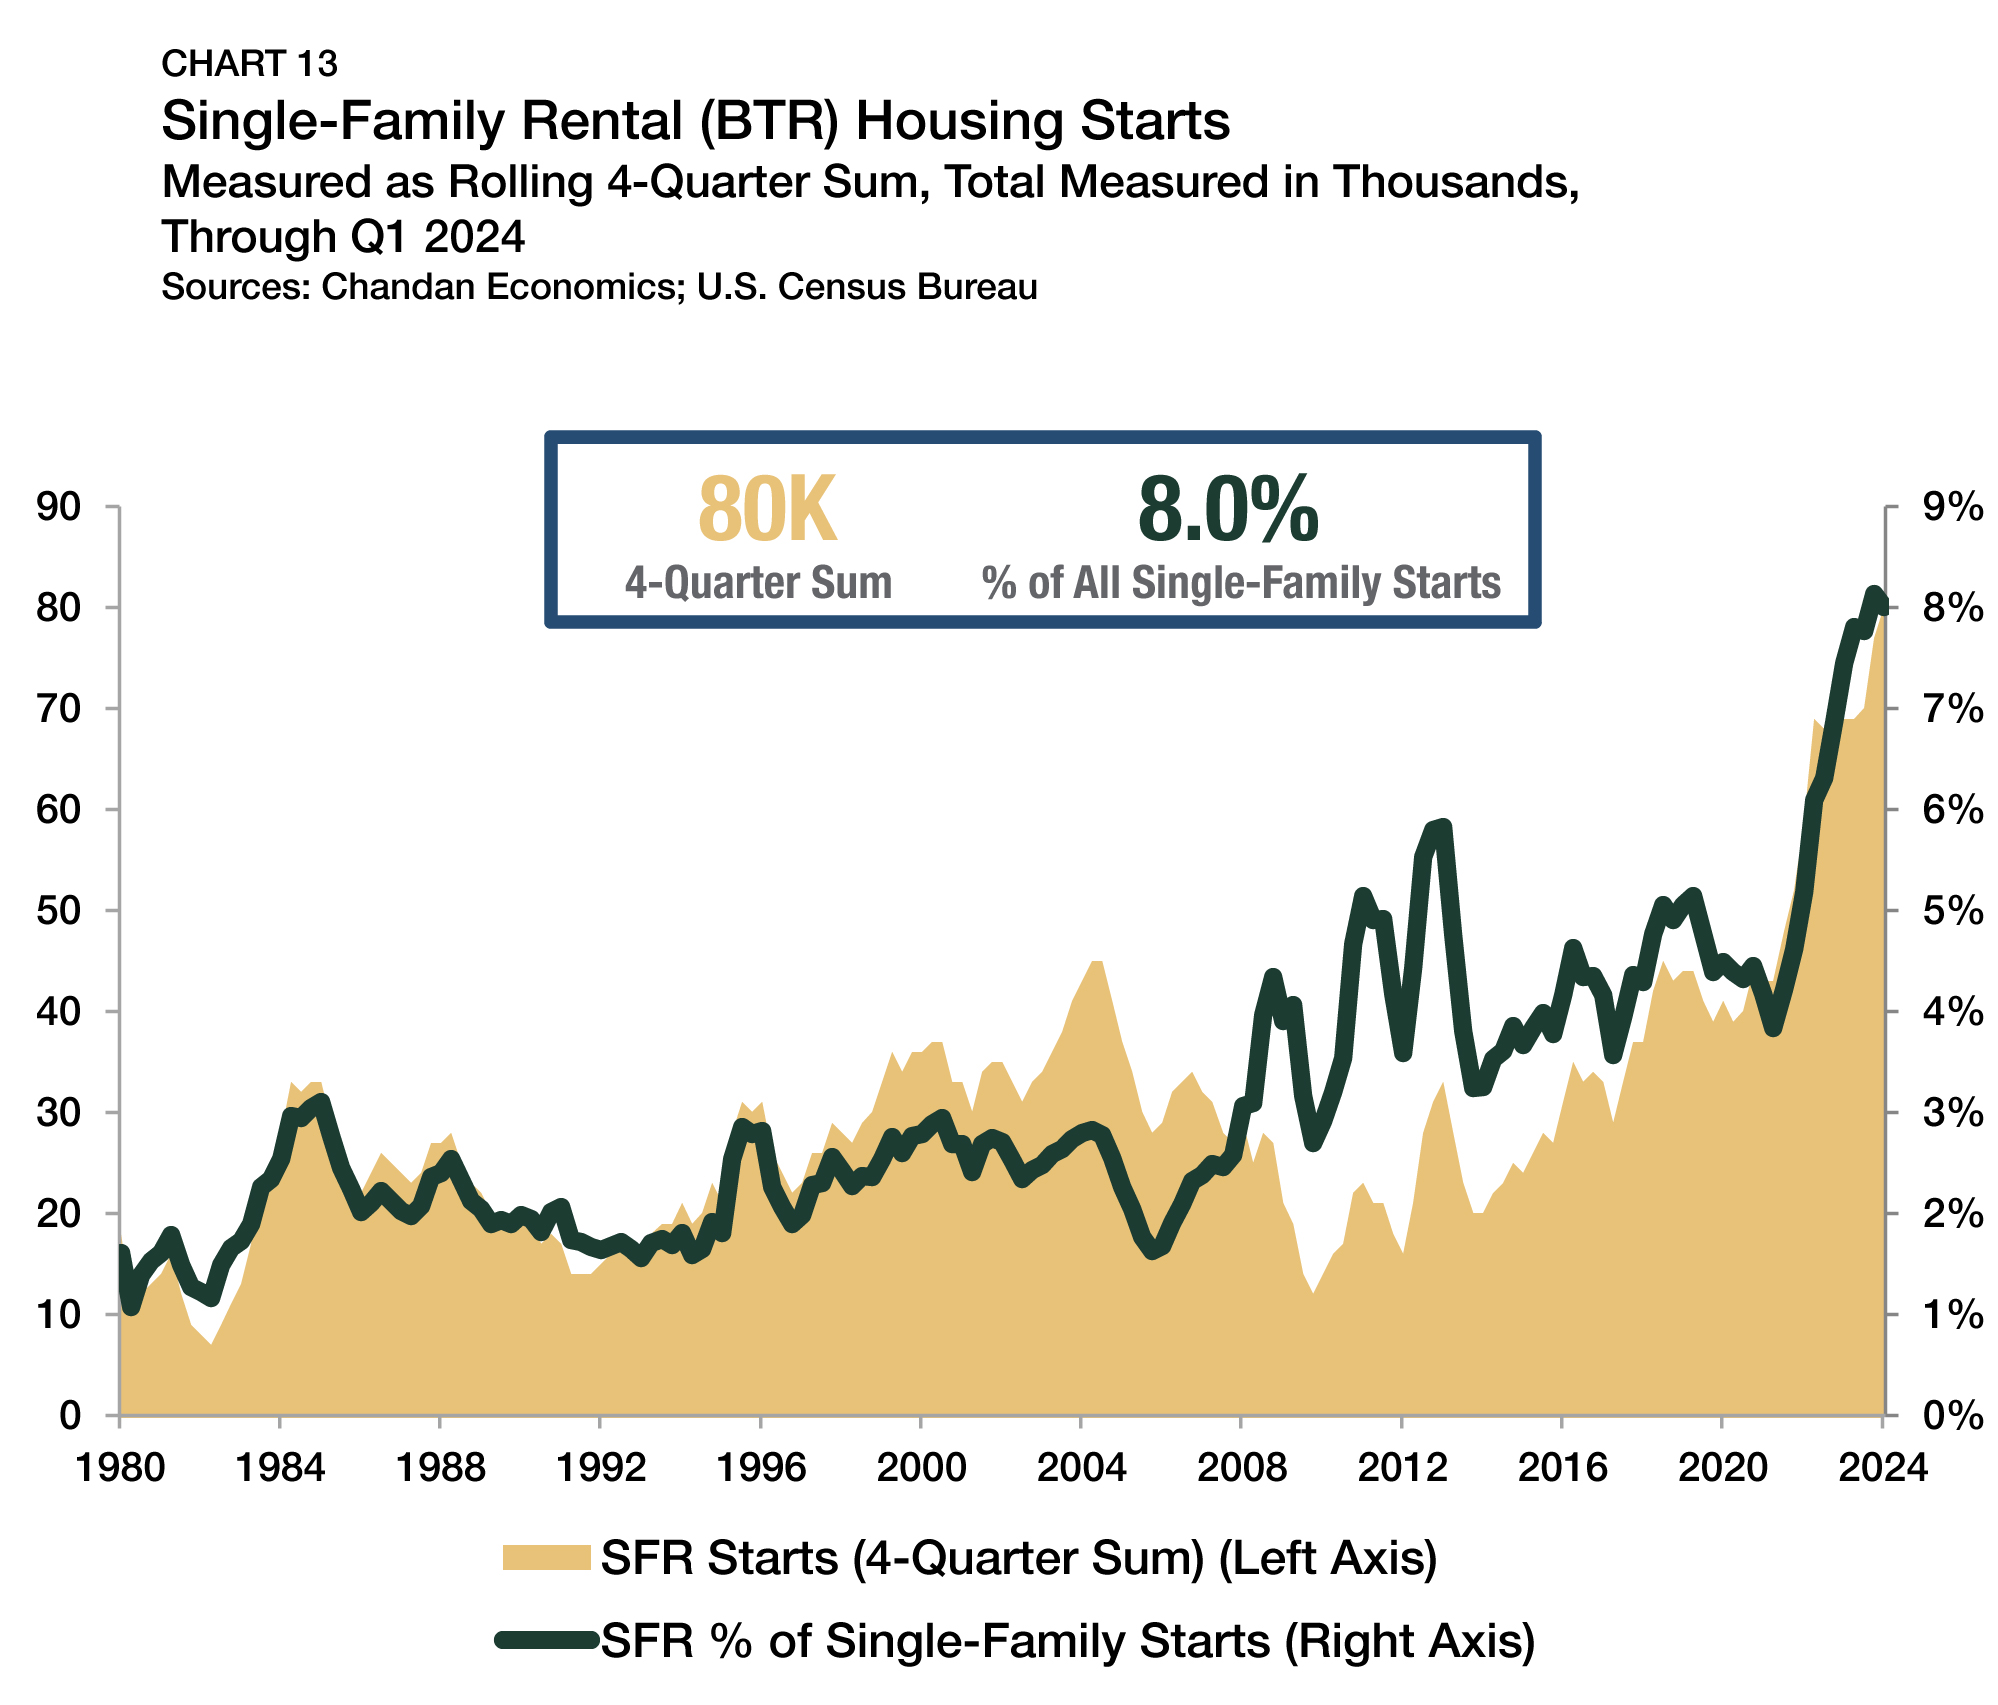
Build-to-rent (BTR), a compelling solution to the U.S. housing market’s evolving needs, is experiencing record growth. BTR accounted for 8% of all single-family rental (SFR) construction starts in the 12 months that ended in the first quarter of 2024, according to Arbor’s Single-Family Rental Investment Trends Report Q2 2024. As the need for quality rental units remains high, borrowers have much to gain from partnering with an experienced lender who specializes in build-to-rent financing.
Articles
Out of the 75 largest U.S. metropolitan areas, occupancy rates for all types of rental properties, including multifamily and single-family rentals (SFR), remained exceptionally high in 2025.
Articles
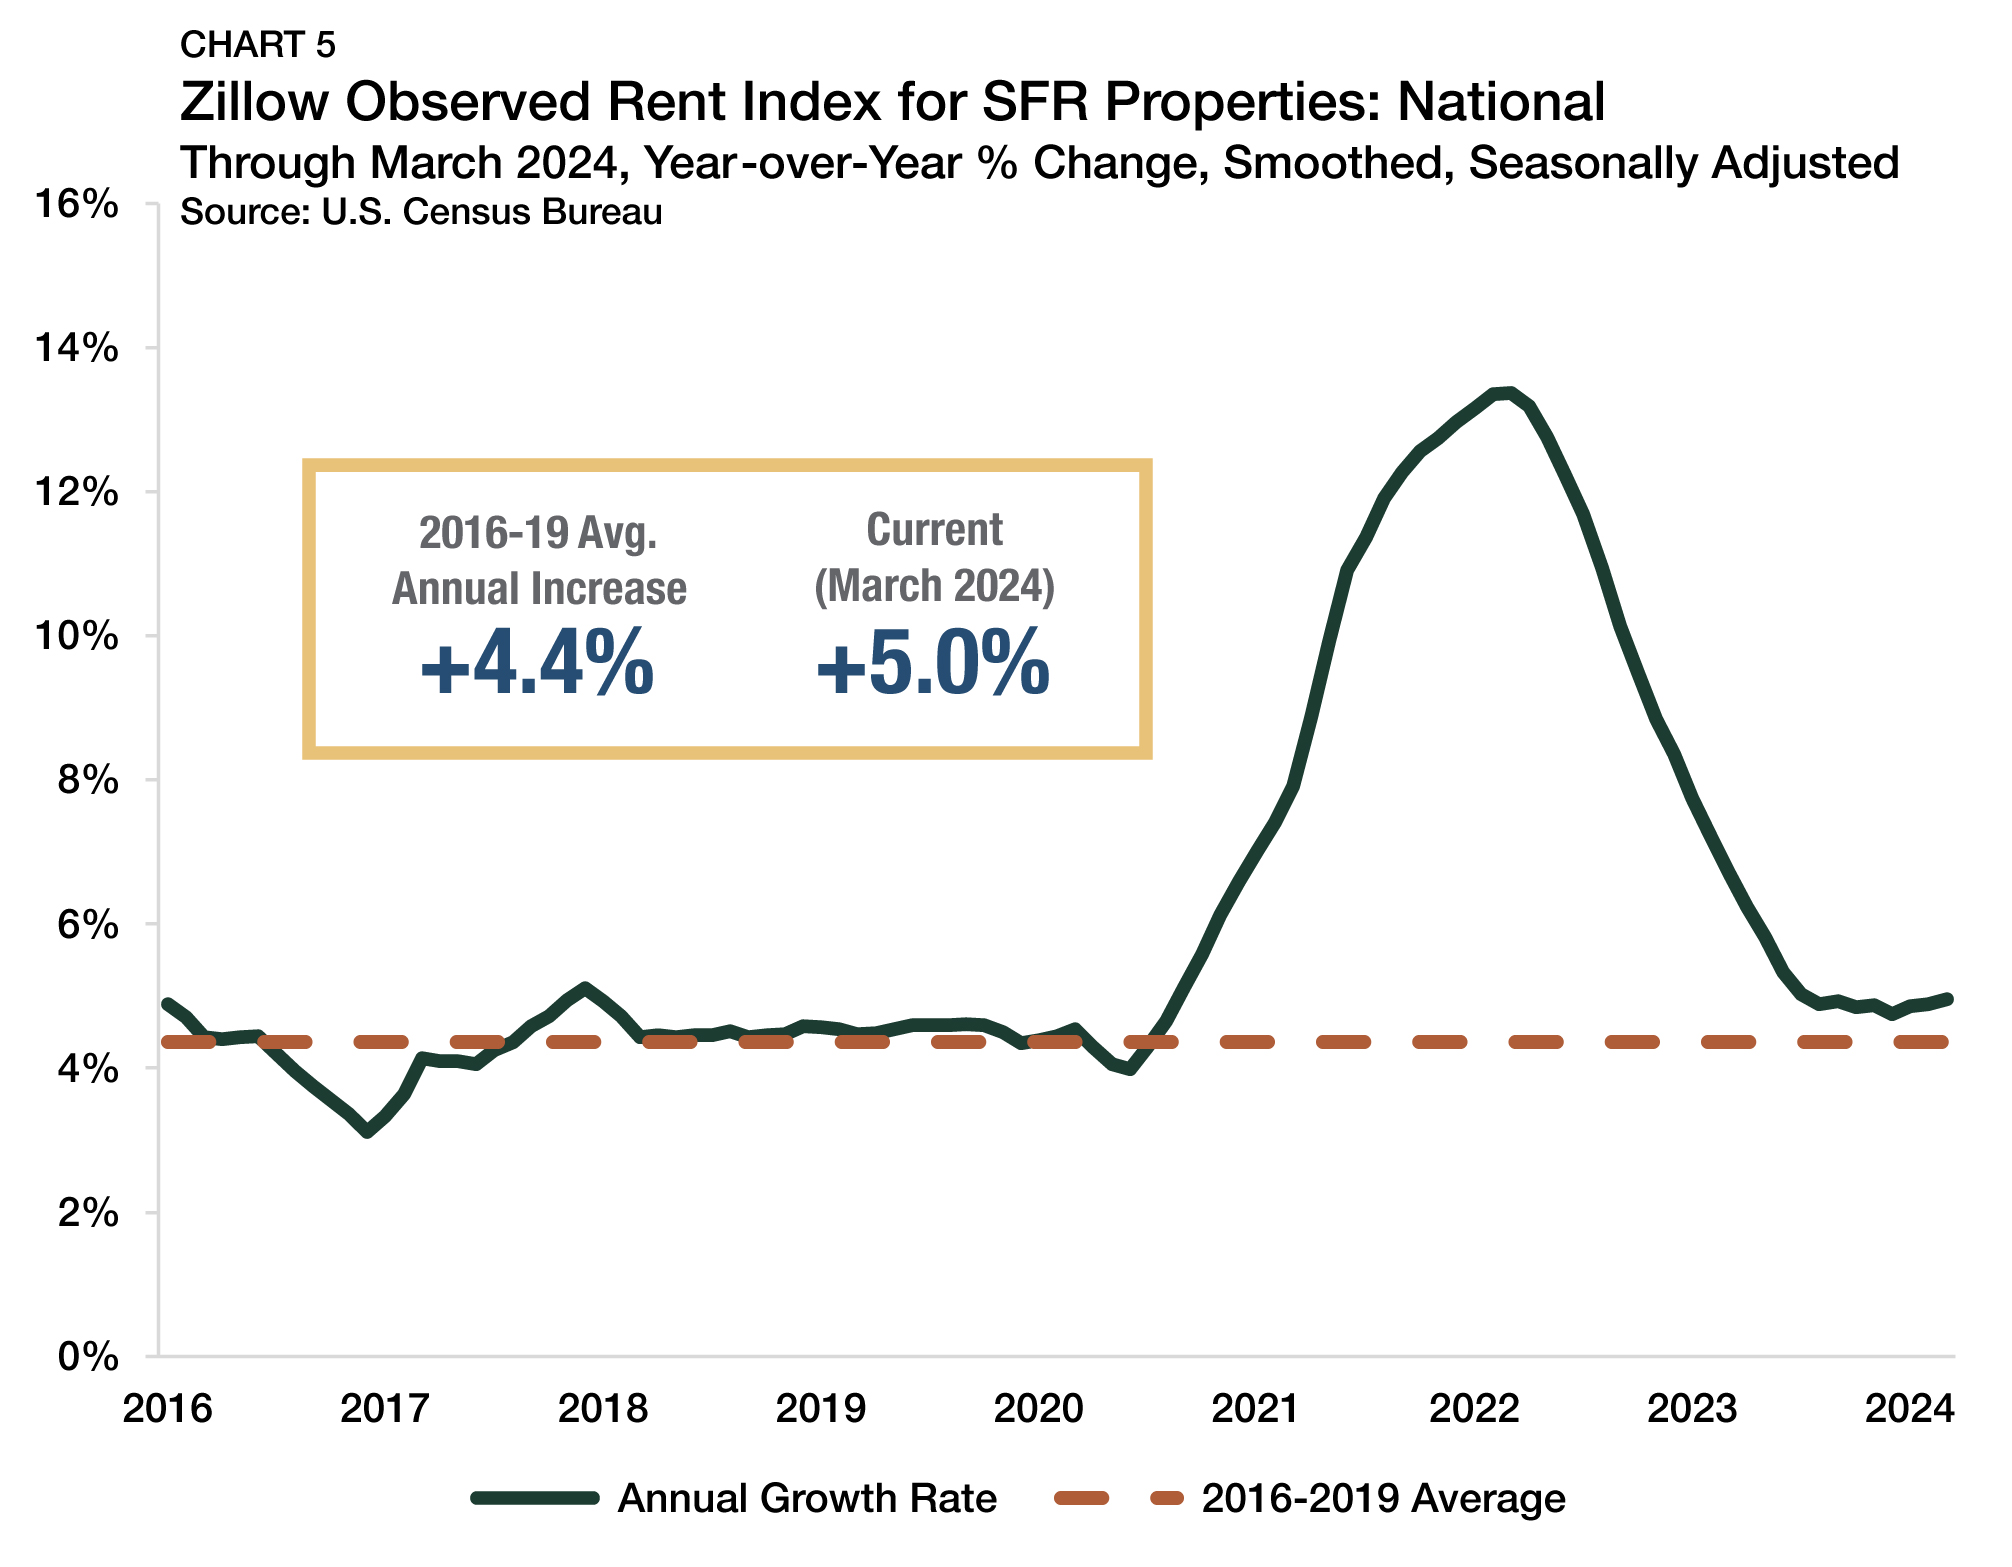
National rent growth in the single-family rental (SFR) sector remained strong and consistent in 2025 as market-level pricing momentum was broad-based and robust, according to an analysis of newly released data from the Zillow Observed Rent Index. Year-end annual rent gains averaged 2.9%, down from 4.1% in 2024, marking the most modest increase since 2015. But even as the intensity of SFR rent growth abated last year, its reach was extensive, with 98 of the 100 largest markets posting year-over-year gains.
Current Reports
Arbor Realty Trust’s Small Multifamily Investment Trends Report Q1 2026, developed in partnership with Chandan Economics, shows that lending activity in the sector increased for the second consecutive year amid a sharp increase in refinancings. Even with persistently high interest rates and rigorous underwriting standards, small multifamily entered the first quarter on steady footing.
Analysis
Over the past 12 months, the leading rent growth markets spanned multiple regions, each exhibiting distinct strengths and characteristics.
Articles
Multifamily cap rates remain stable nationally, even as regional pricing diverged through the end of last year. While some regions saw compression and others late-stage repricing, regional cap rates show less variation as affordability-driven migration and capital reallocation compressed yield gaps.
Analysis
The U.S. multifamily market finished 2025 with growing optimism and resilience. Investment volume accelerated to a three-year high, bolstered by greater interest rate clarity and the tightest cap rates across major real estate sectors.
Articles
The number of households renting single-family homes rose 1.7% in 2025, reaching a seven-year high, according to a new Arbor Realty Trust and Chandan Economics forecast, based on an analysis of newly released U.S. Census Bureau data. Since the pandemic, the single-family rental (SFR) sector has stabilized, reversing recent household losses and regaining momentum.