Take advantage of Arbor’s Fannie Mae and Freddie Mac workforce housing financing products with flexible loan terms and competitive pricing. Arbor’s Fannie Mae and Freddie Mac workforce housing programs offer competitive pricing, underwriting flexibility, and preservation incentives for the development of affordable housing solutions. Partner with a Freddie Mac Top Lender of Workforce Housing Rent Preservation financing to grow your portfolio to discover value-add workforce housing opportunities.
Single-Family Rental Investment Trends Report Q2 2025
Starts Stabilize as Operators Prioritize Tenant Retention
Key Findings
-
Rent growth continues to outpace inflation while operators turn their attention towards retention.
-
SFR/BTR construction remains robust.
-
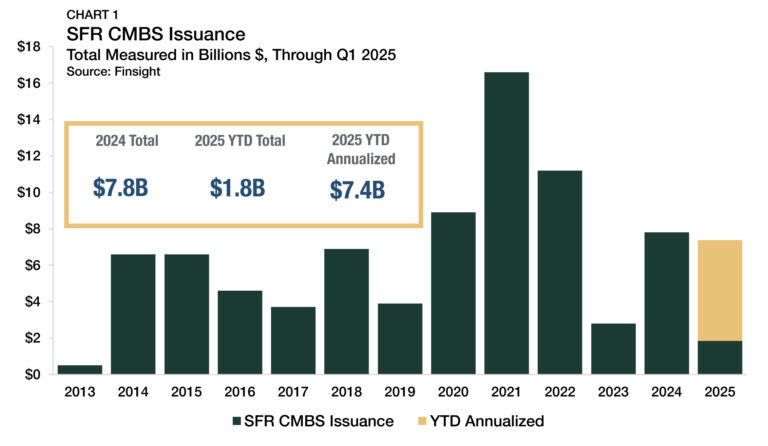
SFR CMBS issuance totaled $7.8B in 2024, nearly double the prior year.
Table of Contents
State of the Market
The single-family rental (SFR) sector continued showing strength in several key areas in the second quarter of 2025, even as residential housing market growth moderated.
Build-to-rent (BTR) construction remained robust as demand for apartments in purpose-built communities climbed. SFR homes, which provide affordable access points to high-quality suburban neighborhoods, continued to attract households of all generations amid a challenging residential housing market. According to the Federal Reserve Bank of Atlanta, the median U.S. household would have to spend 46% of its total income on housing to buy a home in today’s market. As a result, two in three renters now consider leasing to be a long-term housing solution.
As for-sale inventory swelled and home price gains softened, SFR rent growth fell below its pre-pandemic averages last quarter, although it still comfortably outpaced inflation. With capital markets continuing to adjust to higher interest rates, SFR construction starts have begun stabilizing following a period of rapid expansion.
The SFR sector appears settled into a cycle of robust activity, following its long run of skyrocketing growth.
Performance Metrics
CMBS Issuance
After a marked uptick in activity last year, structured SFR capital markets maintained their momentum in early 2025. SFR CMBS issuance totaled $7.8 billion in 2024, surging 179% from the prior year (Chart 1). Through the first quarter of 2025, issuance reached $1.8 billion, putting it on pace to reach $7.4 billion this year.
Historically, first-quarter activity in structured capital markets stagnates as investors reposition assets and pipelines remain thin following the year-end holiday slowdown. Despite seasonal trends, SFR CMBS issuance nearly doubled (+84%) in the first quarter compared to the final quarter of 2024, demonstrating building momentum.
Occupancy and Retention
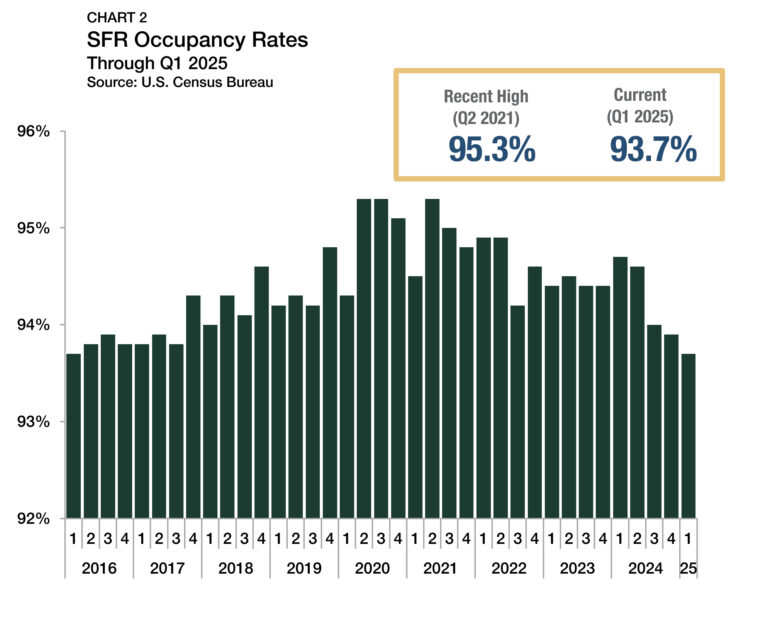
According to the U.S. Census Bureau, occupancy rates across all SFR property types averaged 93.7% in the first quarter of 2025 (Chart 2), 20 basis points lower than in the fourth quarter and marked the fourth consecutive quarterly decline. Since mid-2021, SFR occupancy rates have fallen by a cumulative 160 basis points, mirroring a broader trend across the rental sector. Despite recent declines, SFR properties continue to post the highest average occupancy rates among the different types of rental housing.
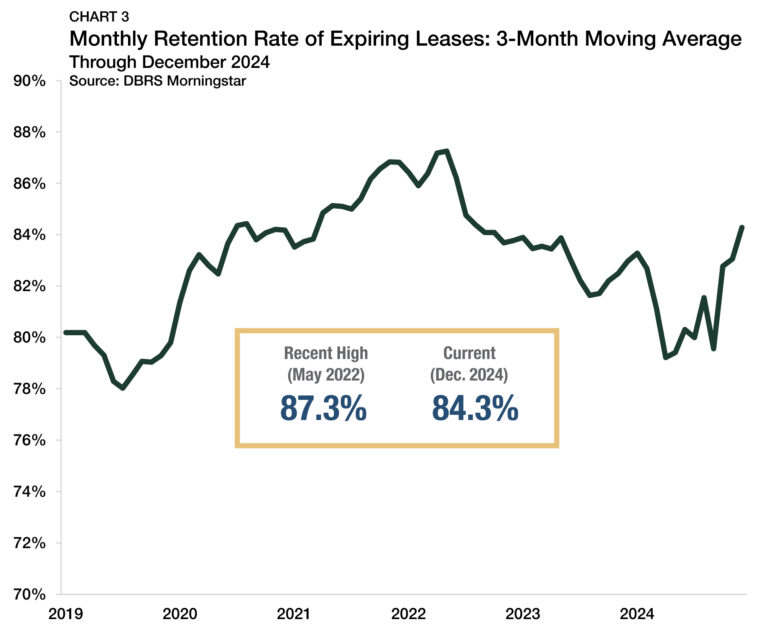
The softening of SFR occupancy rates over the past few years coincided with falling shares of residents choosing to re-sign leases after expiration. According to data from DBRS Morningstar, retention rates for expiring leases dipped significantly between 2022 and mid-2024. In May 2022, the share of tracked SFR units with expiring leases that re-signed for another year had a three-month moving average of 87.3% (Chart 3). By April 2024, the share dropped to 79.2%. However, a recovery in retention rates is already underway. As of December 2024, the three-month moving average climbed to 84.3%.
Rent Growth: National
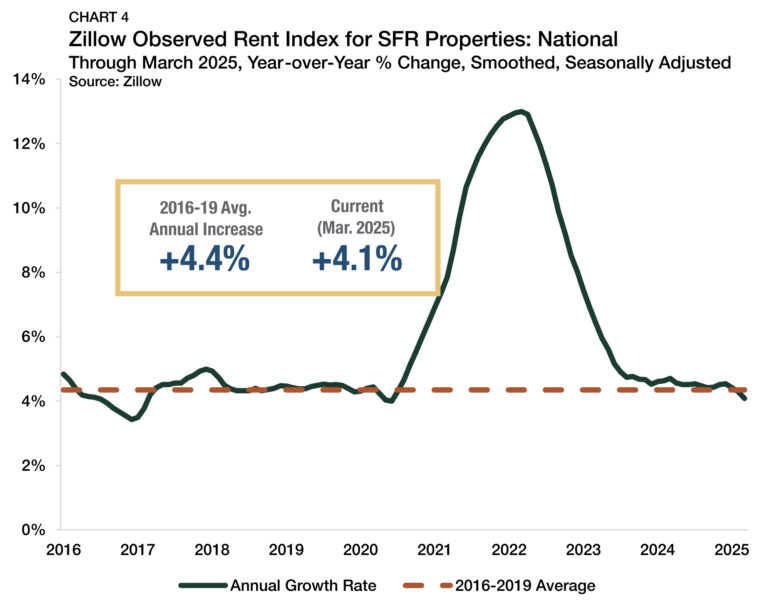
Nationally, SFR rents continued to grow, albeit at a slower pace. According to Zillow’s Observed Rent Index, the overall average rent for the sector was up 4.1% year-over-year through March 2025 (Chart 4). After annual rent growth ticked up to 4.5% in December 2024, the pace of gains slowed in each of the first three months of 2025 and now sits at its lowest rate since mid-2020. The current pace of rent growth is just 27 basis points below the 2016-2019 average (4.4%), underscoring that prices are still rising steadily. Rent escalation in SFR properties slowed as occupancy rates declined, Zillow data shows.
Rent Growth: Metros
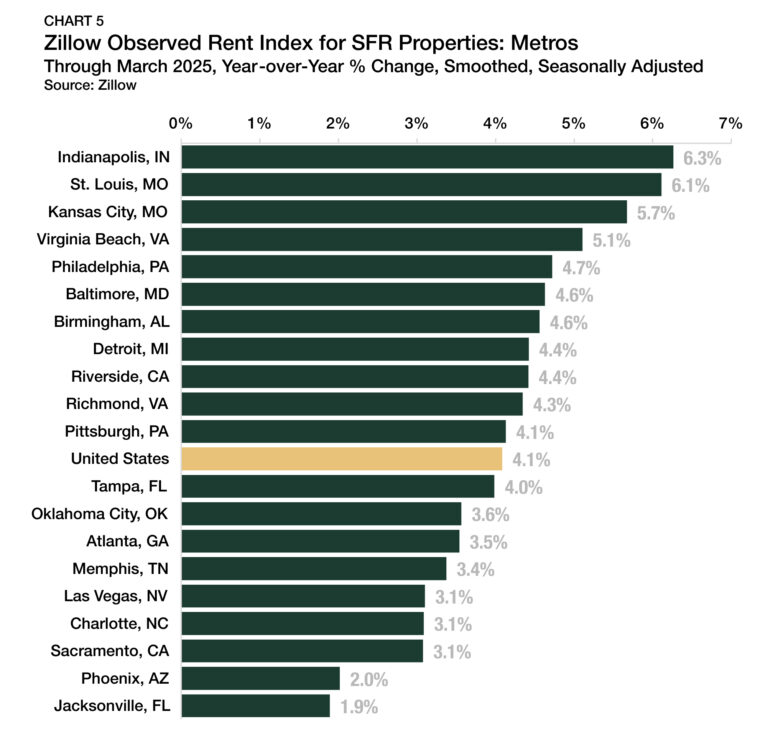
Among the 20 top markets with the highest SFR share of rentals among the 50 largest U.S. metros, Indianapolis, IN, continued to post the strongest annual rent growth, with prices up 6.3% year-over-year through March 2025 (Chart 5).
St. Louis, MO (+6.1%) and Kansas City, MO (+5.7%) ranked second and third, respectively, while Jacksonville, FL (+1.9%), Phoenix, AZ (+2.0%), and Sacramento, CA (+3.0%) landed at the bottom of the pack.
Regionally, the Midwest and Mid-Atlantic continued to see the most robust rent growth patterns through early 2025. Many markets that surged during the post-pandemic boom have absorbed an influx of new inventory, resulting in more muted rent price gains, although the active development cycle appears to have peaked as new permits and starts have both begun to show declines.
Cap Rates
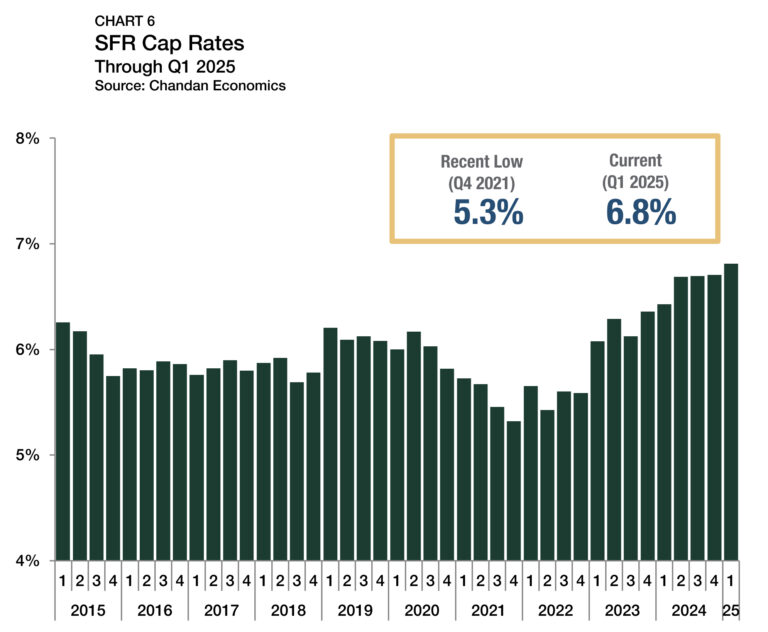
SFR cap rates edged higher in the first quarter of 2025, reaching 6.8% (Chart 6).1 The early 2025 increase breaks a three-quarter streak of SFR cap rates holding steady at 6.7%. In the 13 quarters since hitting an all-time low of 5.3% shortly before the Federal Reserve began tightening interest rates, SFR cap rates have risen by a cumulative 149 bps.
1 Unless otherwise noted, the Chandan Economics data covering single-family rental cap rates and debt yields are based on model estimates and a sample pool of loans. Data are meant to represent conditions at the point of origination.
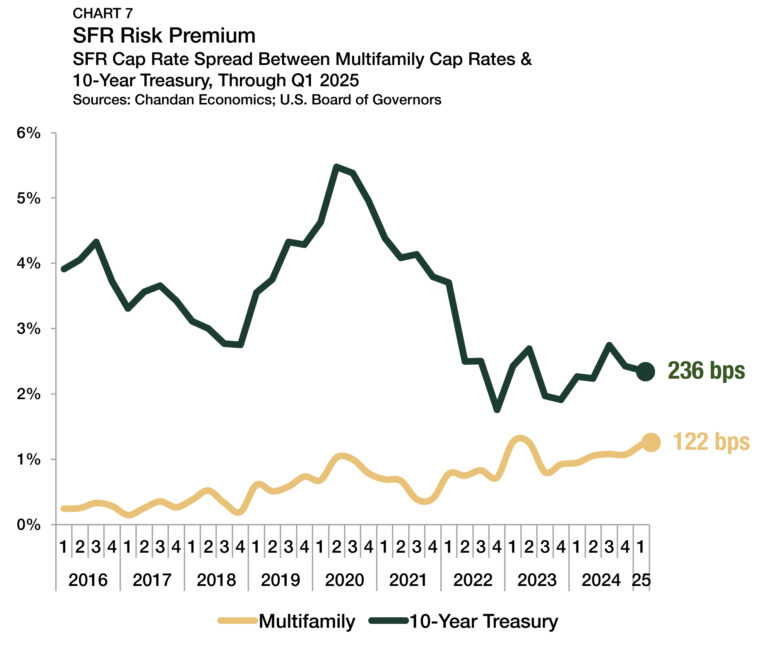
The spread between SFR cap rates and 10-year Treasury yields approximates the SFR risk premium. In the first quarter of 2025, 10-year Treasury notes carried an average yield of 4.5%, up 0.2% from the fourth quarter. While SFR cap rates moved similarly, Treasury yields rose more. As a result, the SFR/Treasury risk premium compressed by six bps, settling at 236 bps in the first quarter (Chart 7). Conversely, the spread between single-family rentals and multifamily properties widened slightly (+15 bps) to reach 122 bps.
Pricing
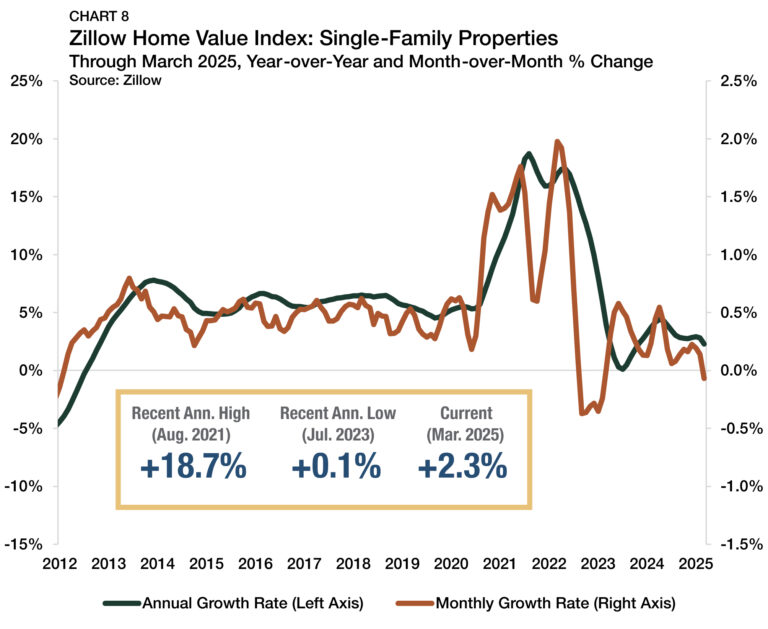
Measured year-over-year, single-family home valuations continued rising through March 2025. According to Zillow’s Home Value Index, the average valuation for a single-family property in the U.S. increased to $362,922, up 2.3% from the same time last year (Chart 8). While even modest annual appreciation is noteworthy in the current interest rate environment, further deceleration is possible. On a monthly basis, single-family home values rose for 24 consecutive months through February before declining 0.1% in March. Looking ahead, Zillow forecasts that U.S. home prices will fall by 1.7% over the year ending in March 2026.
Debt Yields
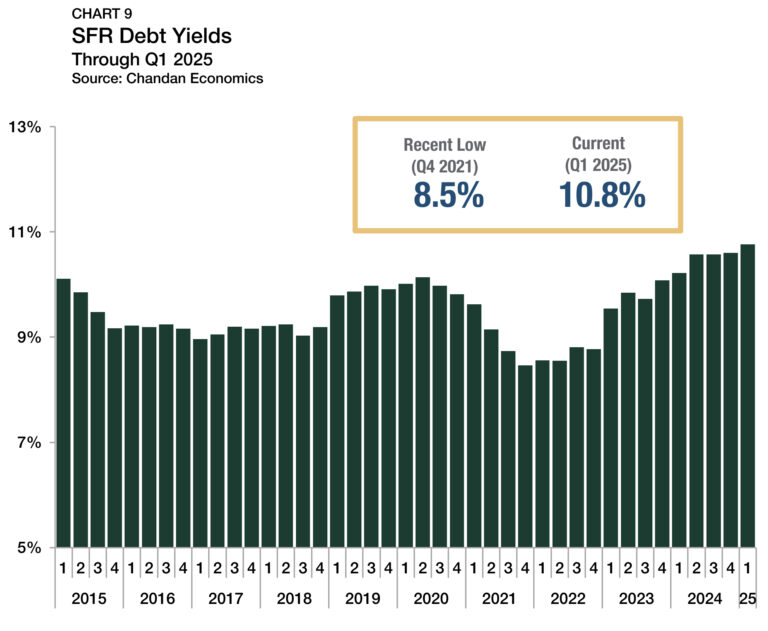
Debt yields, a key measure of credit risk, rose during the first quarter of 2025, increasing 16 bps to finish at 10.8% (Chart 9). Compared to a low of 8.5% in the fourth quarter of 2021, debt yields are now 230 bps higher. The rise in debt yields in recent quarters means SFR investors are securing less debt capital for every $1.00 of property-level net operating income (NOI). Through the first quarter of 2025, SFR investors secured an average of $9.29 of debt for every $1.00 of NOI — down $2.53 from a 2021 peak and $0.49 lower than the same time last year.
Residential Distress
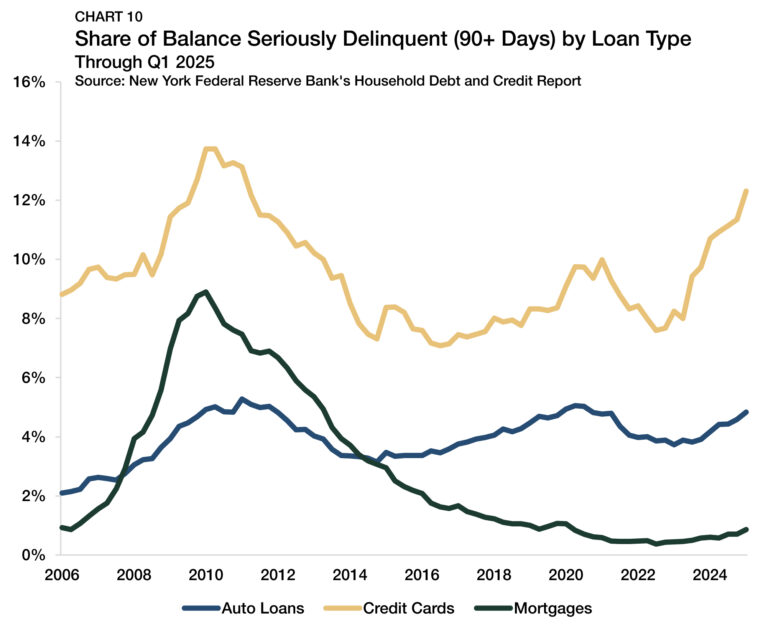
Despite elevated mortgage interest rates, distress across the U.S. housing market remains minimal. The Federal Reserve Bank of New York’s latest Quarterly Report on Household Debt and Credit indicated that only 0.9% of household mortgages were more than 90 days delinquent through the first quarter of 2025. While serious delinquency rates have ticked up marginally in the past year (+26 bps), they remain 20 bps below where they were prior to the onset of the pandemic (Chart 10).
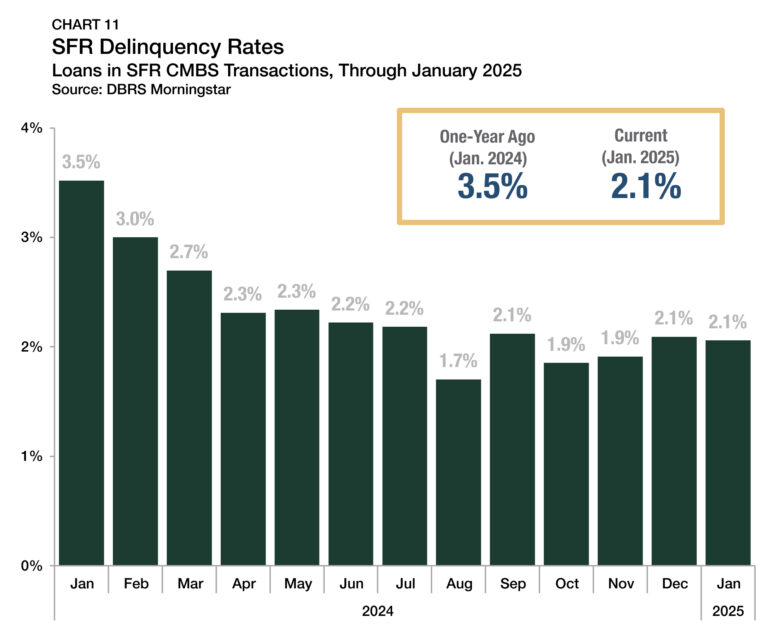
Distress patterns in the SFR sector have mirrored trends in the broader single-family ecosystem, with delinquency rates remaining low. According to DBRS Morningstar, 2.1% of loans within rated SFR CMBS transactions were delinquent in January 2025, down 146 bps from a year earlier (Chart 11).
Supply & Demand Conditions
Build-to-Rent (BTR)
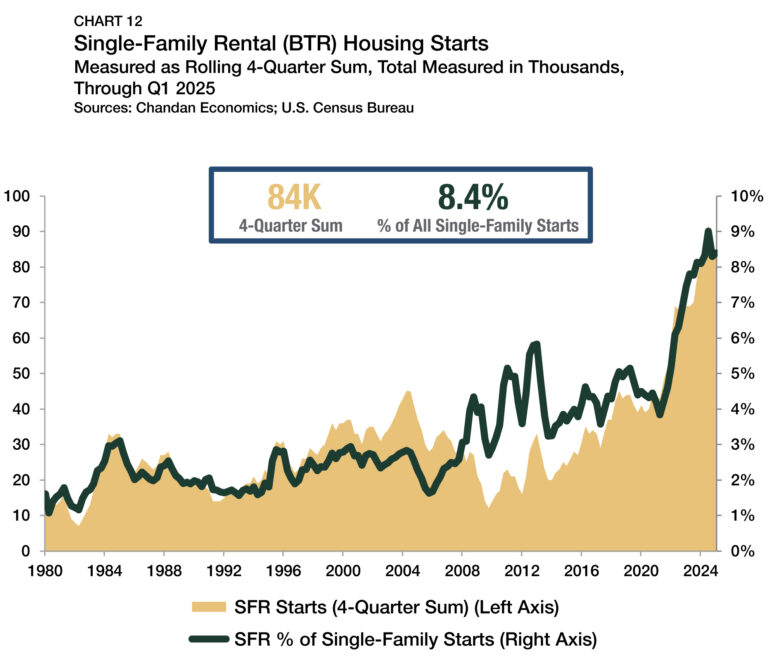
Build-to-rent (BTR) is a driving force behind the growth of the SFR sector. Purpose-built communities are increasingly popular with both renters and investors. Through the first quarter of 2025, the BTR development pipeline was robust, with 84,000 units started during the previous 12 months. Over the past 12 months, BTR accounted for 8.4% of all single-family construction starts, up from 8.3% the previous quarter, yet down slightly from a record high of 9.0% in mid-2024 (Chart 12).
After BTR’s market share of single-family construction rose consistently throughout the 2010s and early 2020s, equilibrium has settled in. BTR’s construction market share remained in a tight range between 8.1% and 8.4% in five of the past six quarters. Measured by volume, BTR construction over the 12 months ending in the first quarter of 2025 held steady at 84,000 units, matching the prior quarter’s pace. The rolling annual sum remains up by a moderate 3.7% compared to a year ago, another sign that SFR construction patterns have stabilized.
Outlook
With Fannie Mae forecasting mortgage rates will remain above 6% through at least 2026, it is unlikely the affordability ceiling for potential homebuyers will shift meaningfully in the near term. As a result, the structural tailwinds behind SFR demand will have steady support. While economic volatility and localized oversupply in some metros could pose short-term risks, the long-term outlook for the sector remains positive.
As occupancy rates slide in all rental housing types, SFR owners are prioritizing retaining quality tenants with best-in-class housing. While the macroeconomy remains uncertain, the SFR sector boasts healthy fundamentals and long-term upside, positioning it as a stable and resilient segment of the U.S. housing landscape.
For more single-family rental research and insights, visit arbor.com/research
Disclaimer
This report is intended for general guidance and information purposes only. This report is under no circumstances intended to be used or considered as financial or investment advice, a recommendation or an offer to sell, or a solicitation of any offer to buy any securities or other form of financial asset. Please note that this is not an offer document. The report is not to be considered as investment research or an objective or independent explanation of the matters contained herein and is not prepared in accordance with the regulation regarding investment analysis. The material in the report is obtained from various sources per dating of the report. We have taken reasonable care to ensure that, and to the best of our knowledge, material information contained herein is in accordance with the facts and contains no omission likely to affect its understanding. That said, all content is provided herein “as is” and neither Arbor Realty Trust, Inc. or Chandan Economics, LLC (“the Companies”) nor their affiliated or related entities, nor any person involved in the creation, production and distribution of the content make any warranties, express or implied. The Companies do not make any representations or warranties, express or implied, as to the reliability, usefulness, completeness, accuracy, currency nor represent that use of any information provided herein would not infringe on other third-party rights. The Companies shall not be liable for any direct, indirect or consequential damages to the reader or a third party arising from the use of the information contained herein. There may have been changes in matters which affect the content contained herein and/or the Companies subsequent to the date of this report. Neither the issue nor delivery of this report shall under any circumstance create any implication that the information contained herein is correct as of any time subsequent to the date hereof or that the affairs of the Companies have not since changed. The Companies do not intend, and do not assume any obligation to update or correct the information included in this report. The contents of this report are not to be construed as legal, business, investment or tax advice. Each recipient should consult with its legal, business, investment and tax advisors as to legal, business, investment and tax advice. The information contained herein may be subject to changes without prior notice. This report is only intended for the recipients, and should not be copied or otherwise distributed, in whole or in part, to any other person.


