The single-family rental (SFR) sector continued showing strength in several key areas in the second quarter of 2025, even as residential housing market growth moderated.
Single-Family Rental Investment Trends Report Q4 2023
SFR Construction Starts Reach New Peak as Cap Rates Slide
Key Findings
-
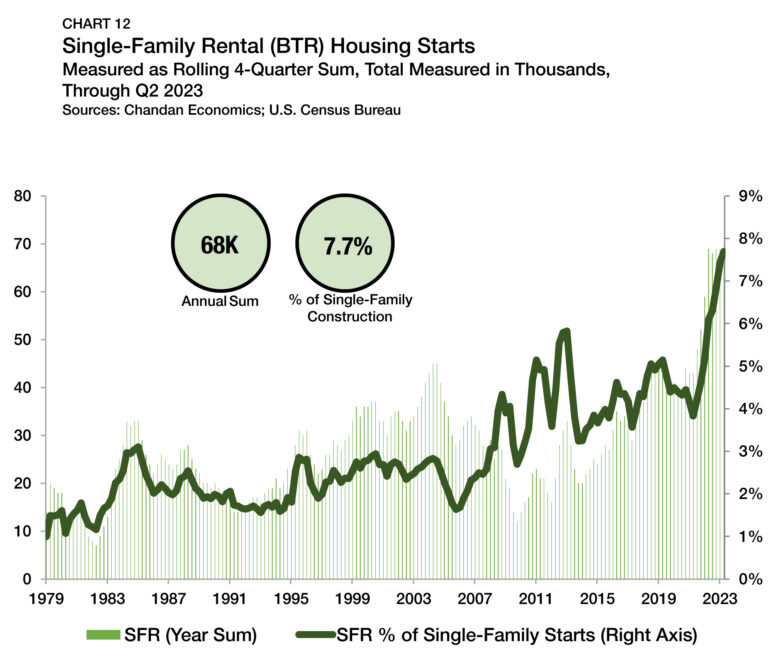
SFR/BTR construction starts reached a new record high in the second quarter of 2023, accounting for 7.7% of all single-family starts.
-
Rent growth for lease renewals continued to outpace historical averages.
-
Cap rates slid to 6.1% in the third quarter amid rising home prices.
Table of Contents
State of the Market
While elevated interest rates have impeded commercial real estate growth, the single-family rental (SFR) sector has exhibited strength and resiliency due to its favorable balance of structural tailwinds.
New construction has continued to be one of SFR’s brightest spots. With mortgage rates at a multi-decade high, many priced-out homebuyers have been choosing to live in build-to-rent (BTR) communities. As demand for SFR units grows nationally, the market share of new BTR construction has set new milestones in 2023.
However, the interest rate environment in the fourth quarter of 2023 still presents challenges in capital markets. CMBS activity, which attracted large amounts of capital into the SFR sector in recent years, has been quiet. At the same time, SFR’s fundamental strengths are undeniable. On-time rent payments remained robust as cap rates slid in the third quarter of 2023, demonstrating the health of this sector amid ongoing economic dislocation.
Performance Metrics
CMBS Issuance
In the CMBS market, SFR issuance has shown signs of modest improvement. According to Finsight, SFR CMBS issuance totaled $1.0 billion in the third quarter of 2023 — more than doubling the $416 million from the prior quarter and nearly matching the $1.1 billion issuance total from all of the first half of 2023 (Chart 1).
Nevertheless, even as SFR CMBS has started to show signs of new life, this year is likely to go on record as the most subdued for issuance in recent memory. SFR CMBS issuance is on pace to clear just over $2.8 billion this year, which, if this pattern holds, would be the lowest total since 2013. For comparison, $11.7 billion was closed in 2022.
Originations by Purpose
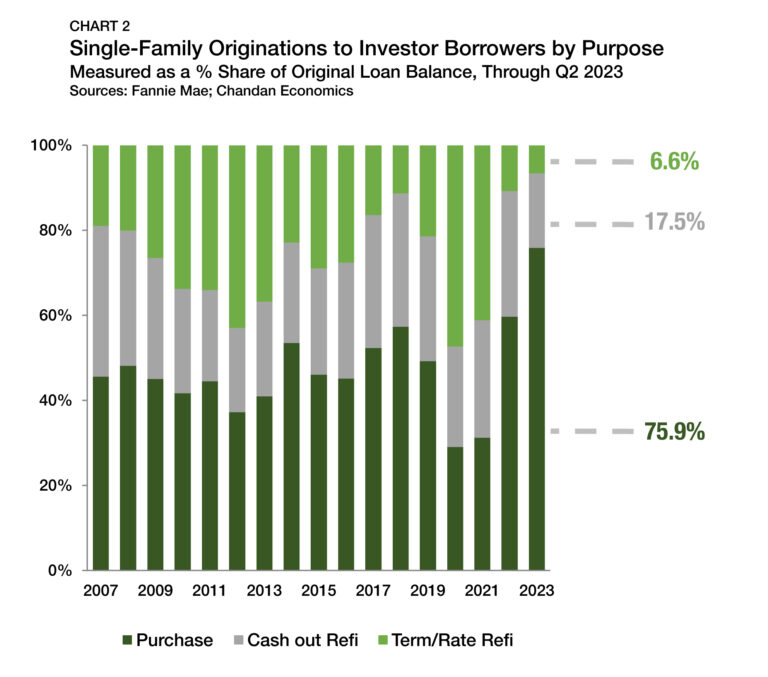
New acquisition loans have recently emerged as the predominant purpose type for SFR originations, driven primarily by the interest rate environment. According to Fannie Mae, in 2022, new SFR loans intended for purchasing accounted for 59.7% of originations to single-family investors, constituting a majority for the first time since 2018 (Chart 2). This trend has continued into 2023. With mortgage interest rates continuing to climb, existing asset owners have yet to see much incentive to strategically refinance. Through the first six months of 2023, loans for acquisitions accounted for 75.9% of single-family investor originations — a record high by 12.7 percentage points. Meanwhile, rate-and-term refinancing loans, which accounted for 47.3% of originations as recently as 2020, have accounted for just 6.6% of lending activity this year.
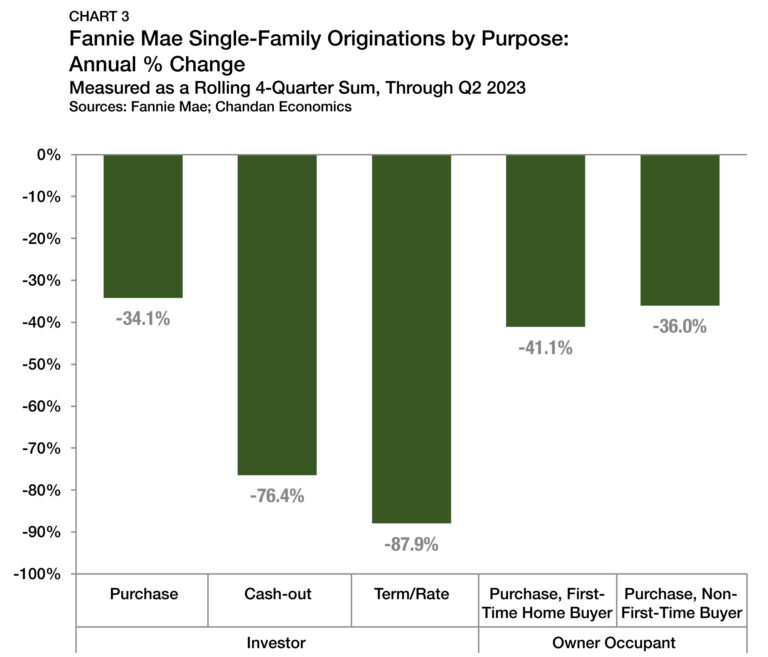
An analysis of Fannie Mae data shows that the dollar volume of rate-and-term refinancings fell by 87.9% during the 12 months ending in June 2023 compared to the prior 12 months.1 Cash-out refinancings also dropped off by 76.4% (Chart 3). While both of these declines are dramatic, the slight difference in severity between rate-and-term and cash-out refinances likely reflects the fact that many smaller-scale investors use accrued equity as capital to make a down payment on a new acquisition.
Single-family purchases by investors, while still down, fell at a milder pace of 34.1%. Meanwhile, single-family home purchases by first-time and non-first-time homebuyers fell by 41.1% and 36.0%, respectively. These trends underscore the strength of investor confidence in the single-family rental sector. While SFR purchasing activity has felt the impact of higher interest rates and turbulence in the capital markets, its pullback has proven to be less pronounced than that of other categories of single-family lending.
Occupancy
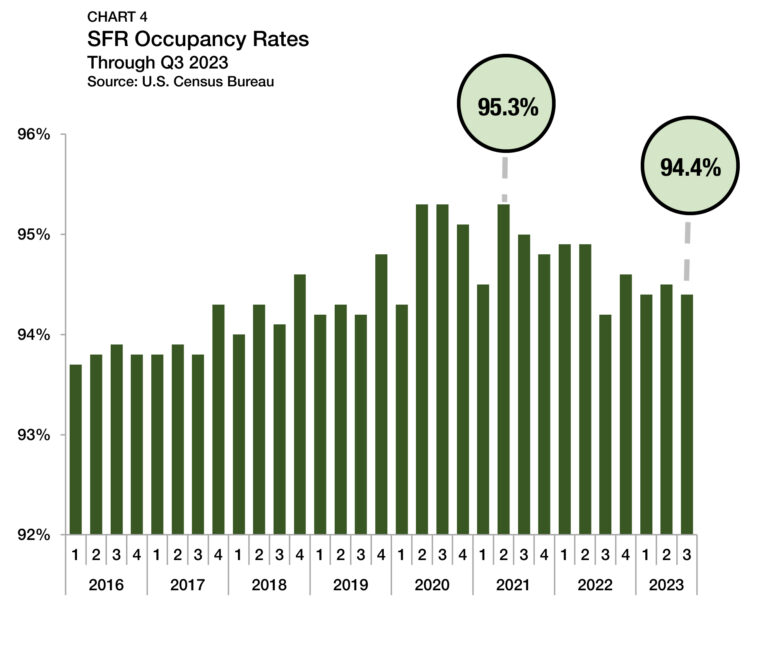
Occupancy rates across all SFR property types averaged 94.4% in the third quarter of 2023, decreasing by 10 bps from the previous quarter, according to U.S. Census Bureau data (Chart 4). DBRS Morningstar, which actively tracks the performance of about 130,000 SFR properties, also reported a similar vacancy rate of 93.5% in the sector in August 2023.
Rent Growth
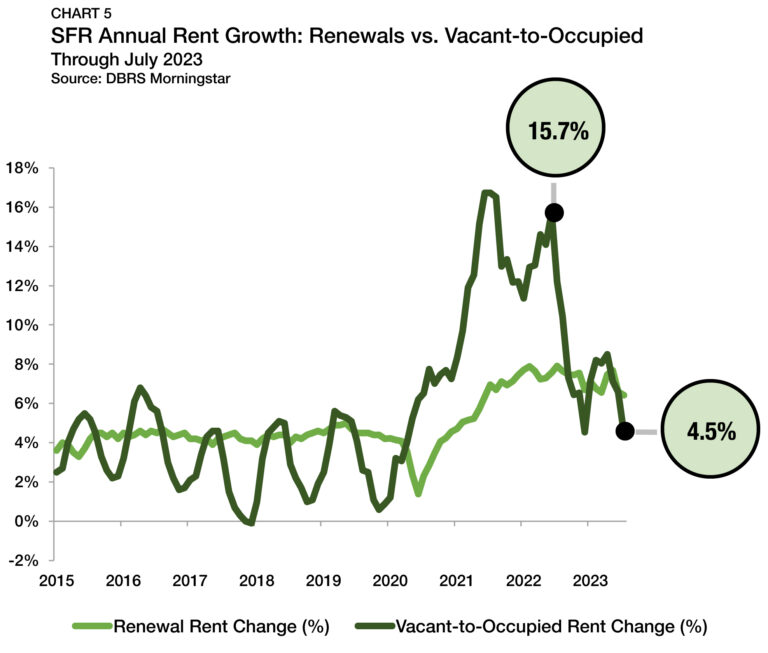
According to DBRS Morningstar, vacant-to-occupied (V2O) annual rent growth has continued to be very volatile. Through July 2023, V2O rents are up 4.5% from a year earlier, which is the slowest annual growth rate since April 2020 (Chart 5). However, while this monthly measurement was subdued compared to the double-digit growth rates seen in recent years, the recent pace remains a full percentage point above the 2015-19 average of 3.5%. It appears V2O rent growth may be resuming seasonal patterns that were commonplace before the pandemic when price pressures peaked in the early summer and reached a bottom in the early winter.
The annual rent growth of SFR lease renewals has retreated gradually from its record highs. Renewal rent growth hit a record high of 7.9% in July 2022. Since then, the pace of increase has slowed in eight of the last 12 months, although it remained elevated through July 2023, landing at 6.4%. However, despite the recent slowdown, the current pace of growth is closer to the record high than the 2015-19 average of 4.3%. Prior to 2020, the SFR renewal rent growth rate had never eclipsed 5.0%. Through July 2023, it has been higher than 5.0% for 30 straight months, marking an unrivaled period of sustained gains.
Rent Collections
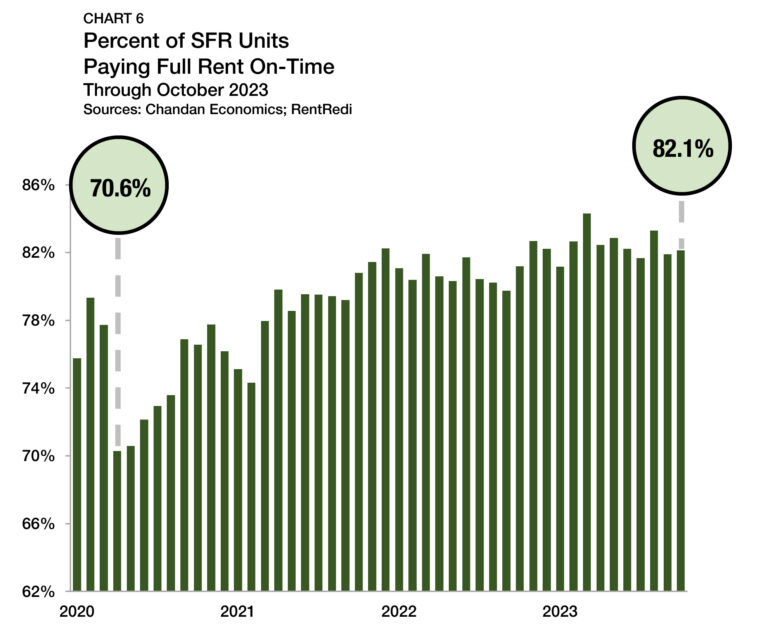
On-time rent payments in SFR properties remained at healthy levels as the sector entered the final stages of 2023. In October, an estimated 82.1% of units paid their full rent on time, according to the Independent Landlord Rental Performance Report (Chart 6). SFR’s forecasted full-payment rate, which includes on-time payments, late payments, and expected late payments based on historical trends, was 92.6% during the same period.
SFR full-payment rates have sat in a tight range between 92.6% and 93.0% for each of the past six months, marking a favorable string of consistent high performance. The overarching trend of improving collection rates in recent months can be attributed to two primary factors. The first is the labor market, which has been robust, outperforming even the most optimistic forecasts from earlier this year. The second is that high mortgage rates have caused many households with strong balance sheets to delay homeownership.
Cap Rates
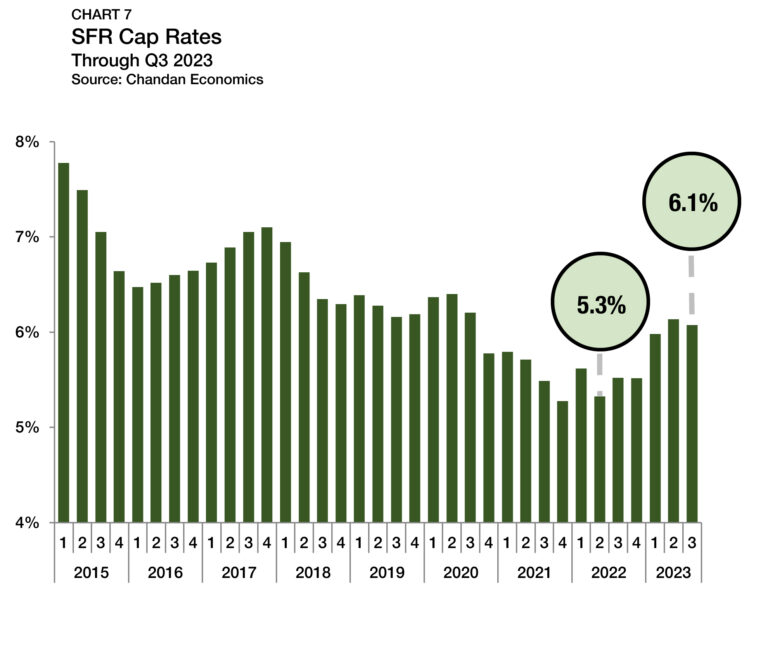
Previously rising SFR cap rates hit the pause button in the third quarter of 2023, dropping only slightly to 6.1% (Chart 7).2 The third-quarter movement is a departure from the recent trend line, which saw SFR cap rates rise or hold flat in four consecutive quarters through mid-2023. The third-quarter cap rate compression is unique among commercial property types — including other forms of rental housing.
With interest rates high, investors are broadly adjusting their yield requirements higher. However, the SFR sector’s third quarter statistical outlier is that valuations in the housing market have already started to pick back up, with recent gains seen in both the S&P Case-Shiller Home Price Index and HUD’s tracking of the median sales price of houses sold.
The spread between SFR cap rates and 10-year Treasury yields approximates the SFR risk premium. With SFR declining in the third quarter as Treasury yields jumped, the SFR risk premium slid to 193 bps — a decrease of 61 bps from the previous period (Chart 8). At the same time, the spread between SFR and multifamily properties also narrowed (-26 bps), averaging 85 bps in the third quarter of 2023.
Pricing
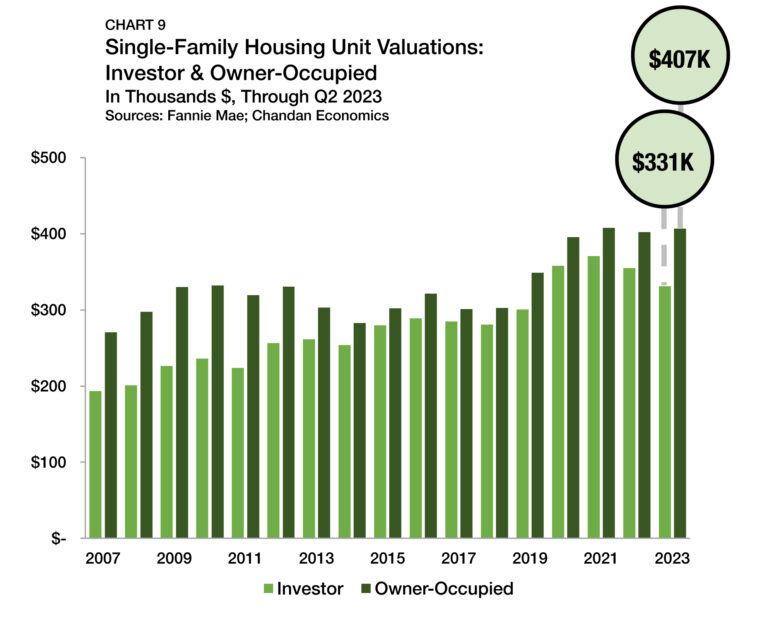
There are consistent differences between the average assessed property values on mortgages originated to single-family owner-occupants when compared to those originated to single-family investors. Underwriters consider factors such as vacancies, turnover, and management-related expenses that owner-occupied units do not have, contributing to lower assessed values for rental units. Additionally, investors are incentivized to target value-add assets rather than paying top dollar for existing value.
Through the second quarter of 2023, the average valuation of a single-family rental that received a Fannie Mae mortgage this year was $330,972 — down 6.7% from the 2022 average (Chart 9). Meanwhile, for owner-occupied units, the average valuations were up by a marginal 1.2% through the second quarter of 2023, rising to $407,046. Subsequently, the average underwritten valuation gap between the two groups of properties has increased to 18.7% through the first half of 2023 — its widest point since 2012.
The sizeable drop-off in SFR valuations on Fannie Mae mortgages is the likely result of investors becoming more selective. Investors want to have a high degree of confidence that their asset will appreciate over the short term to justify making a purchase. In a housing market with fewer transactions, many investors require higher yields and lower prices to execute an acquisition.
Debt Yields
Debt yields, a key measure of credit risk, remained virtually unchanged during the third quarter of 2023, rising by 3 bps and remaining at 10.0% (Chart 10). While the increase was minuscule, it still marked the sixth increase in the past seven quarters, highlighting that lenders have remained cautious. The rise in debt yields in recent quarters translates to SFR investors securing less debt capital for every dollar of property-level net operating income (NOI). Through the third quarter of 2023, SFR debt declined to $9.98 for every dollar of NOI, a decrease of $0.03 from the previous quarter and a drop of $1.00 from the same time last year.
Supply & Demand Conditions
Residential Default Rates
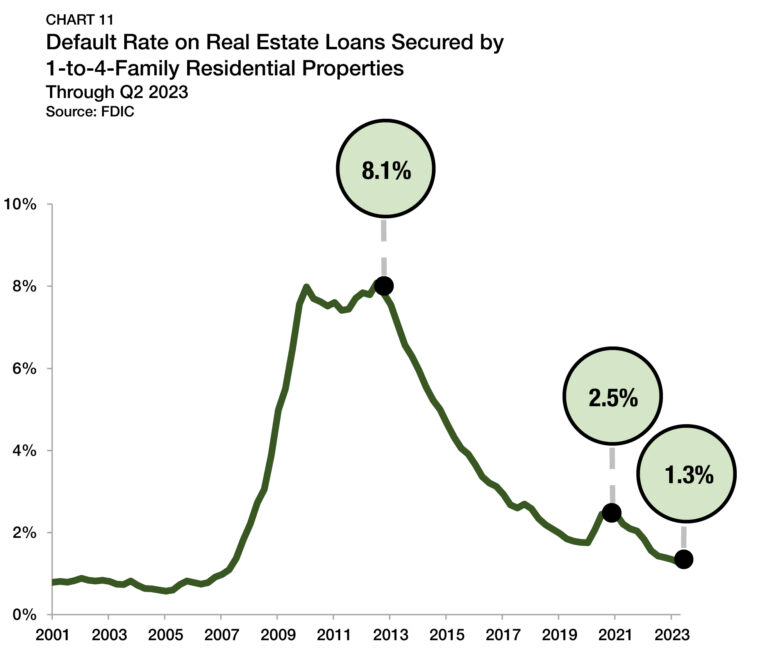
After a record runup in prices through 2021 and the first half of 2022, many investors believed that a housing market correction was inevitable, which would create a unique buying opportunity. To date, existing home sales have cratered, though valuations have not. The combination of a strong labor market and many homeowners having low-interest rate mortgages has resulted in an exceedingly low rate of mortgage defaults. According to the Federal Deposit Insurance Corporation (FDIC), mortgage default rates improved to a new post-financial crisis low of 1.3% in the second quarter of 2023, down from 1.9% one year ago (Chart 11).
Build-to-Rent
Purpose-built SFR properties, known as BTR communities, have become a defining feature of the SFR sector, especially among institutional investors. Through the second quarter of 2023, BTR production remained elevated despite slowing construction throughout the single-family rental sector. Over the past year, BTR accounted for 7.7% of all single-family construction starts — marking a record high for the product type (Chart 12).
For comparison, before the SFR sector’s emergence in the aftermath of the 2007-2009 recession, the BTR share of single-family construction did not eclipse 3.1%. By unit count, there were 68,000 BTR construction starts in the year ending in the second quarter of 2023. Notably, the rolling annual sum for BTR construction starts has held between 68,000 and 69,000 for each of the past five quarters, underscoring an impressive consistency.
Tracking Demand
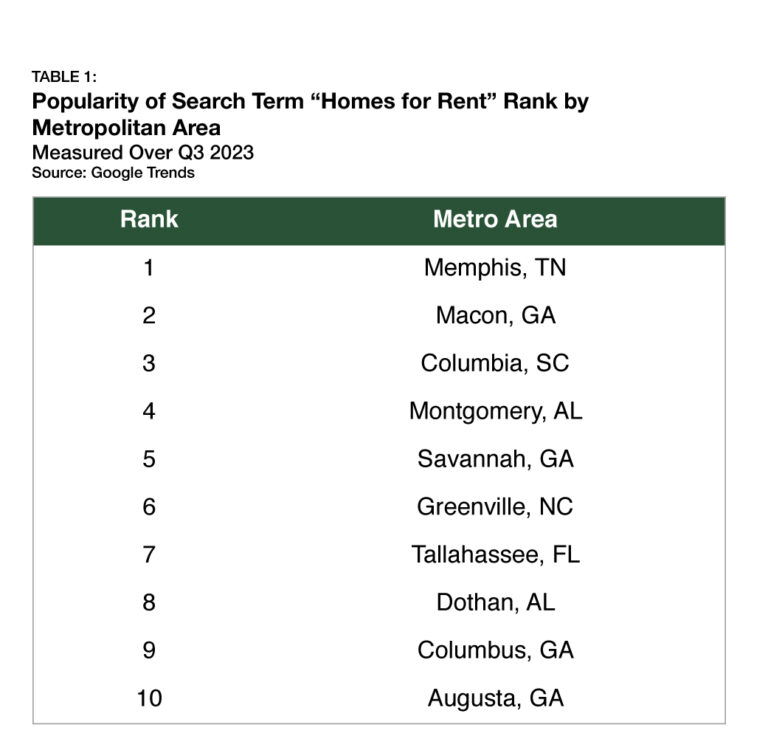
Google Trends can help to identify potential markets for high SFR demand by tracking the popularity of the search term “homes for rent.” In the third quarter of 2023, Memphis, TN, was the area where the term “homes for rent” was searched the most (Table 1). All the top 10 metros where this term received the highest number of searches in Google are in six southeastern Sun Belt states (Tennessee, Georgia, South Carolina, Alabama, North Carolina, and Florida). While SFR communities have found success nationwide, the Southeast remains SFR’s strongest region due to favorable population growth trends and relatively affordable costs of living.
Outlook
Even as the investment community is betting that the Federal Reserve has likely reached the end of its monetary policy tightening cycle, more restrictive conditions remain a possibility via a yield curve normalization that could send long-term Treasury rates and market interest rates higher. For the SFR sector, continued pressure on long-term interest rates serves both as a tailwind and a headwind through different channels. On the one hand, rising mortgage rates could translate into downward pressure on home prices across the board, which would cause cap rates to climb. At the same time, would-be homeowners are bolstering demand for single-family rentals, sustaining rent pressures, and firming collection performance trends. On balance, the SFR sector is well-positioned to limit distress through the challenges of the current moment while advancing its standing within the single-family housing market for the long term.
1 Findings are based on Fannie Mae’s historical loan credit performance data accessible through its Data Dynamics portal.
2 Unless otherwise noted, the Chandan Economics data covering single-family rental cap rates and debt yields are based on model estimates and a sample pool of loans. Data are meant to represent conditions at the point of origination.
For more single-family rental research and insights, visit arbor.com/research


