Articles

Build-to-Rent Construction Continues Its Record-Breaking Ascent

Increasingly, single-family rental (SFR) operators have been relying on build-to-rent (BTR) development to bridge the housing gap, accelerating the momentum of SFR construction through 2024’s halfway point. Both total SFR/BTR housing starts and BTR’s share of all single-family housing starts reached new record highs in the second quarter, setting the stage for another banner year.

Current Reports

Small Multifamily Investment Trends Report Q3 2024

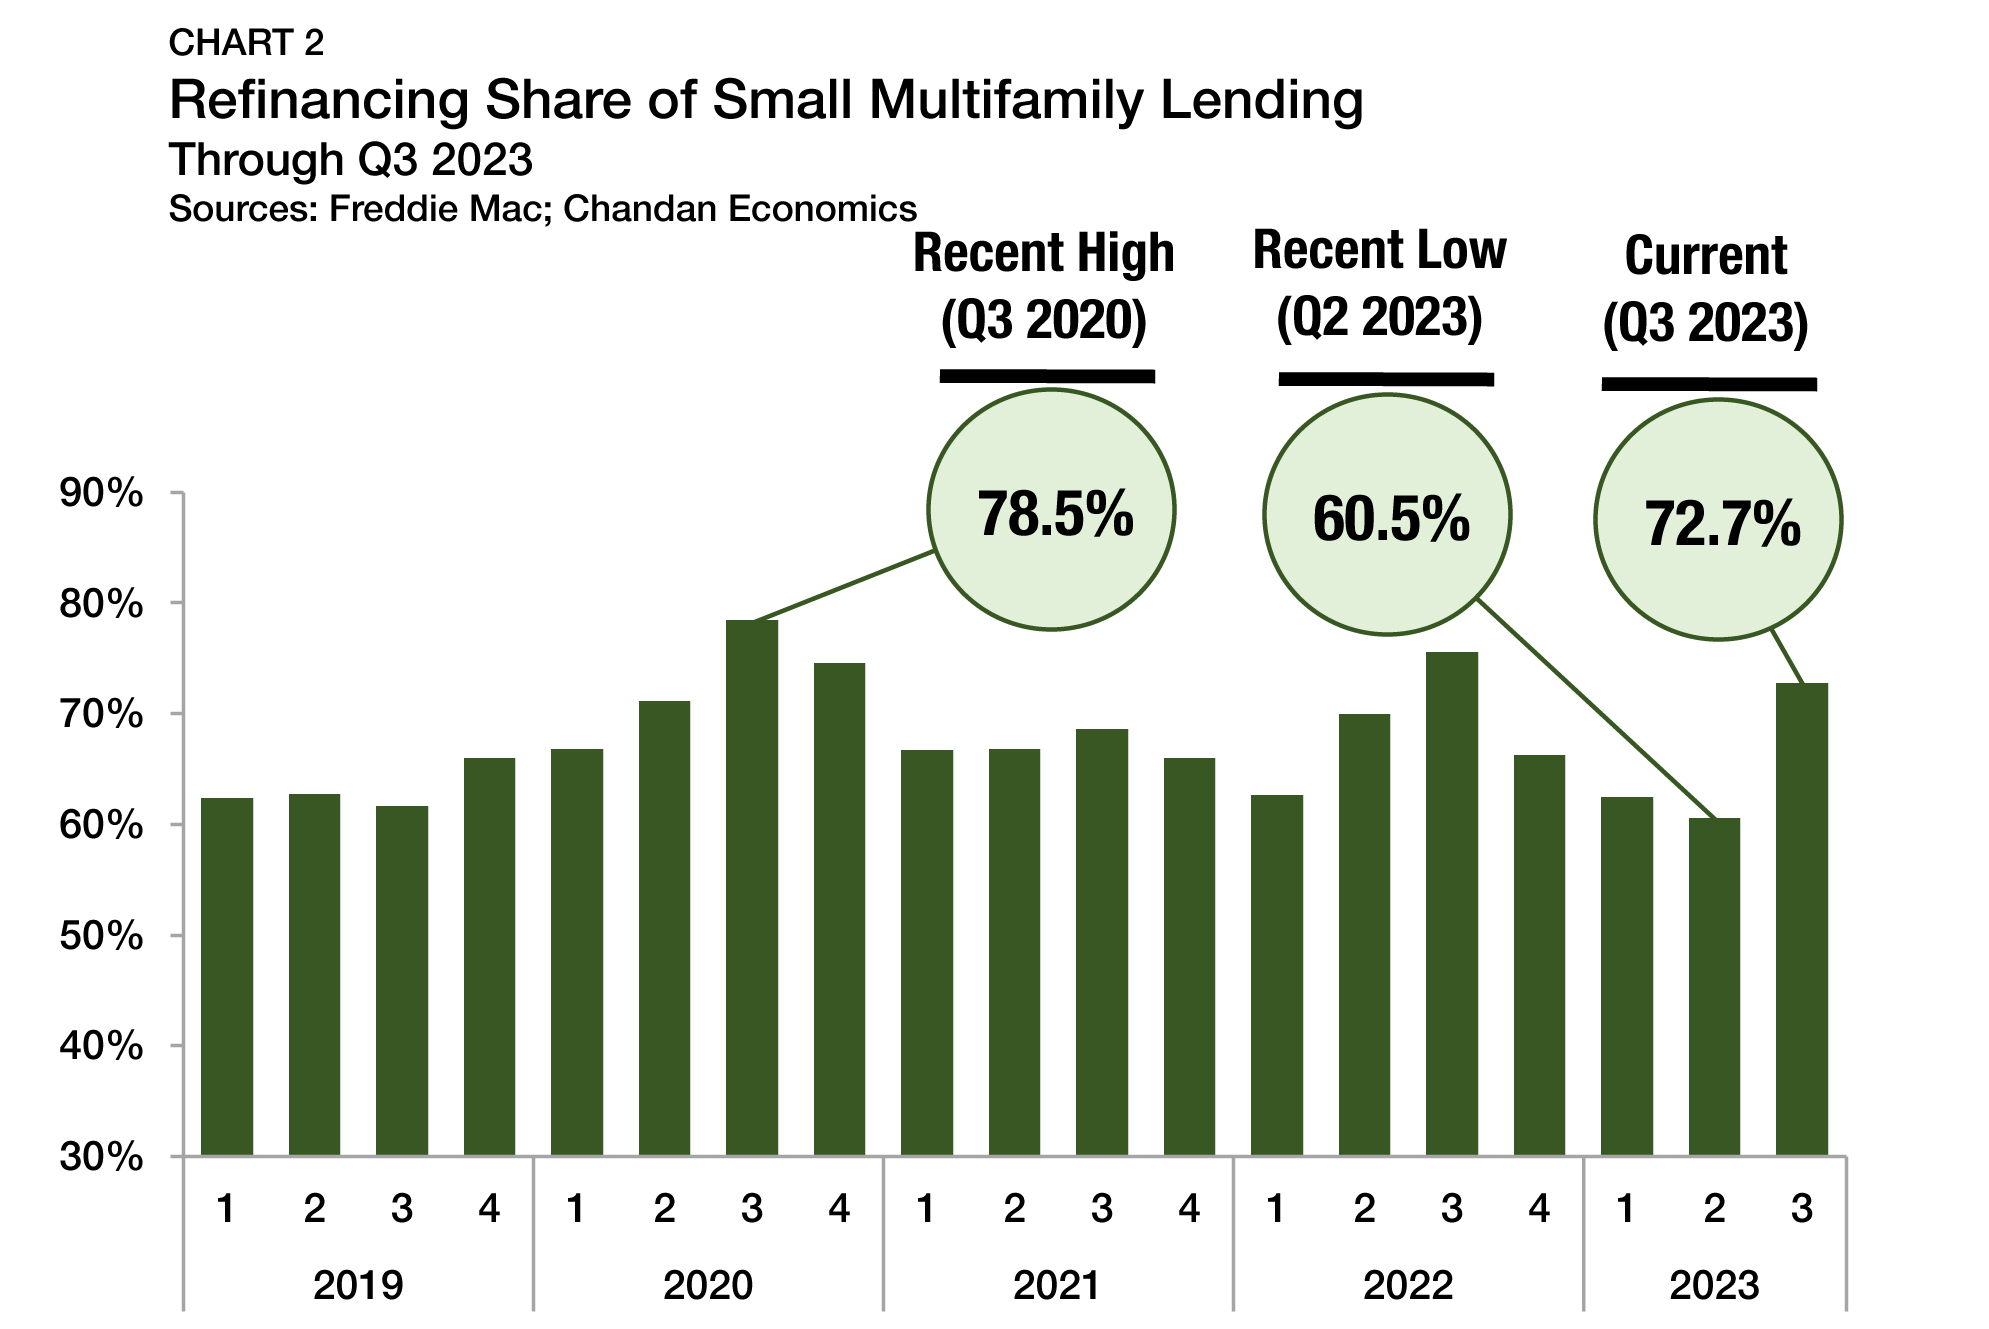
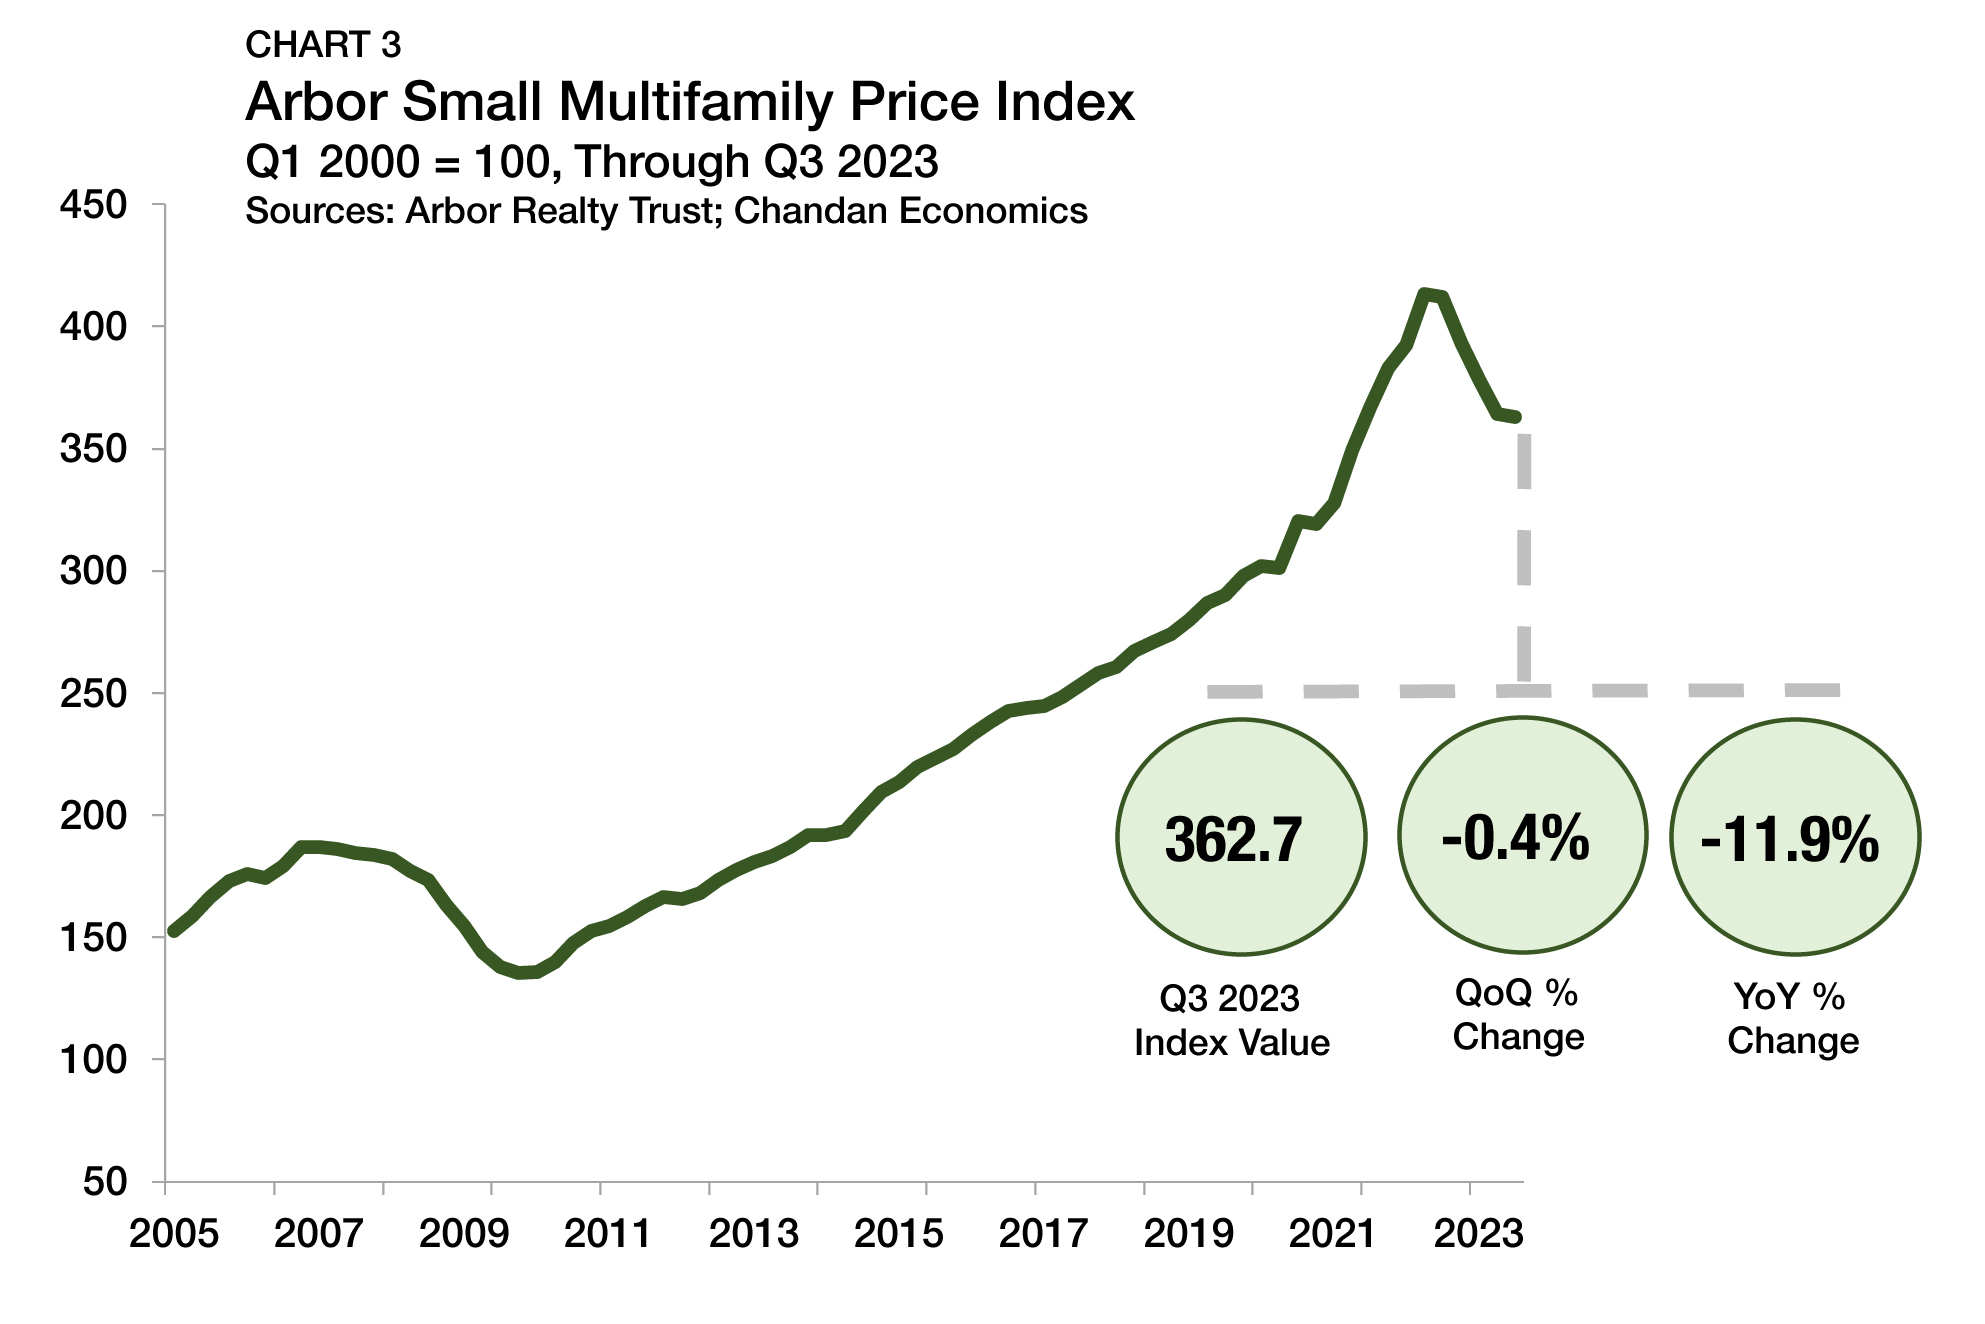
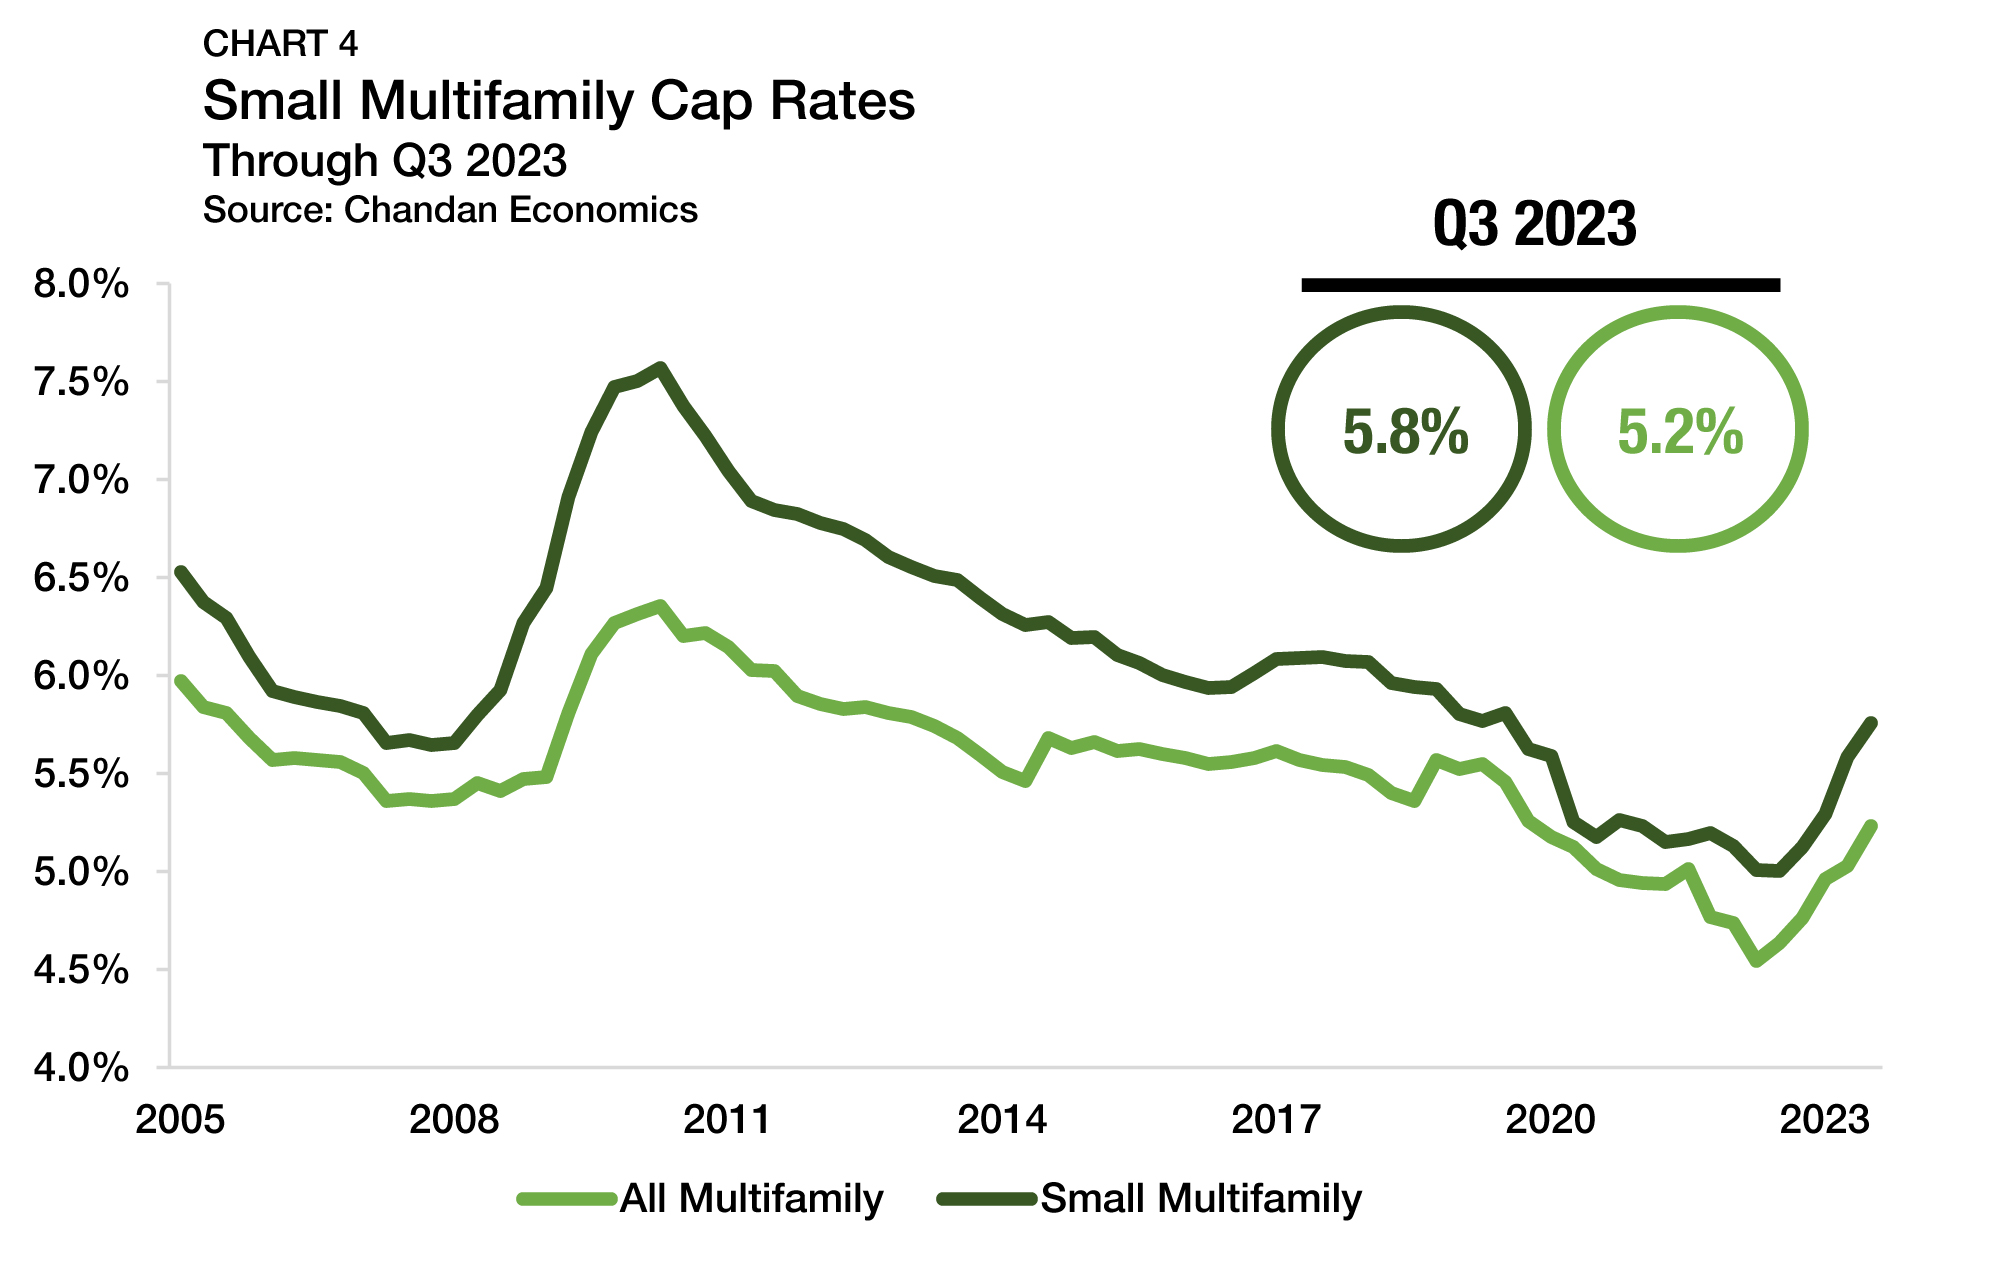
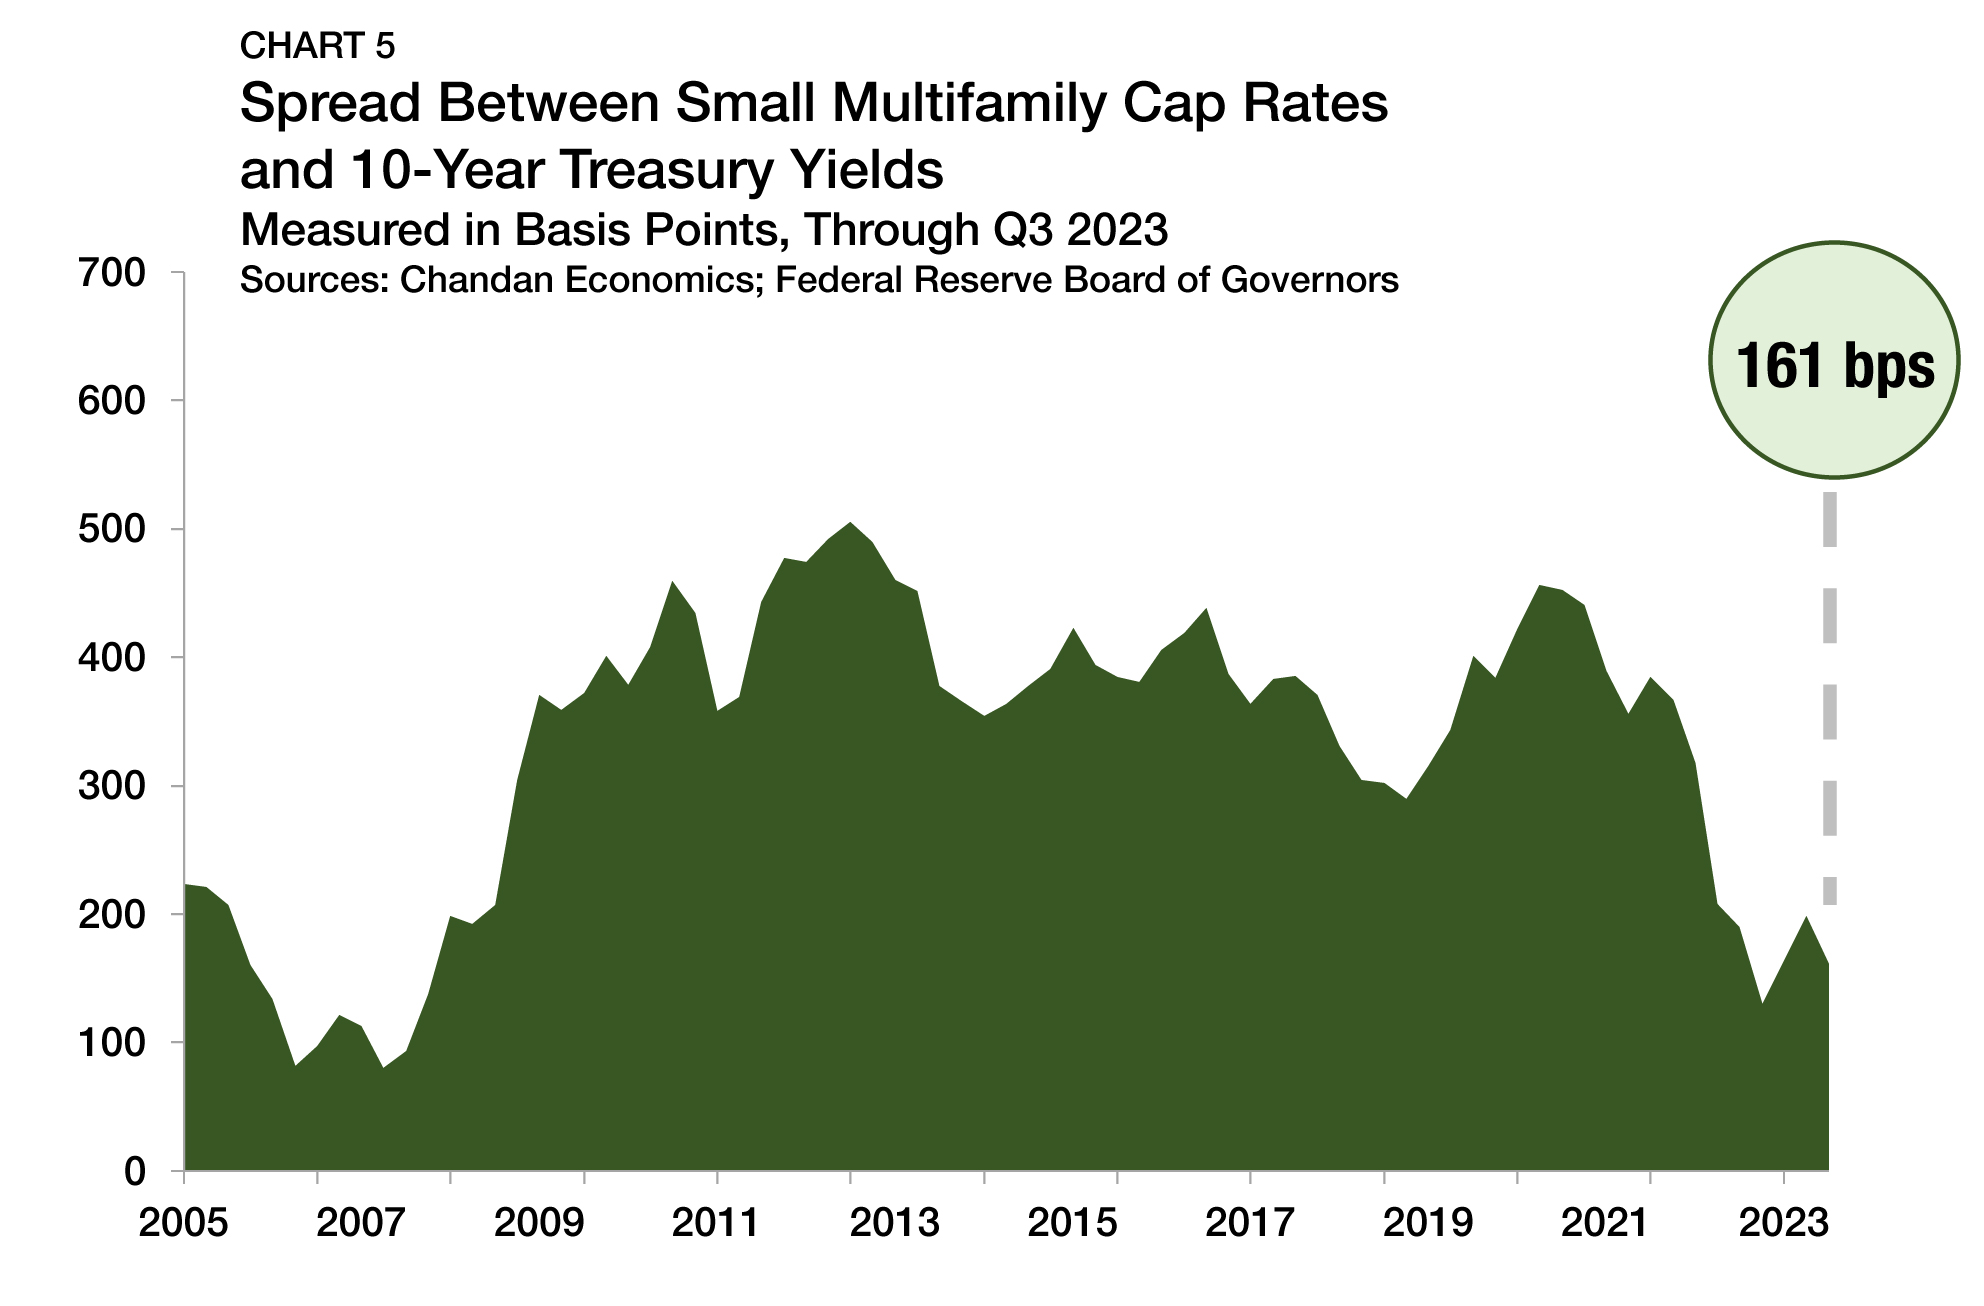
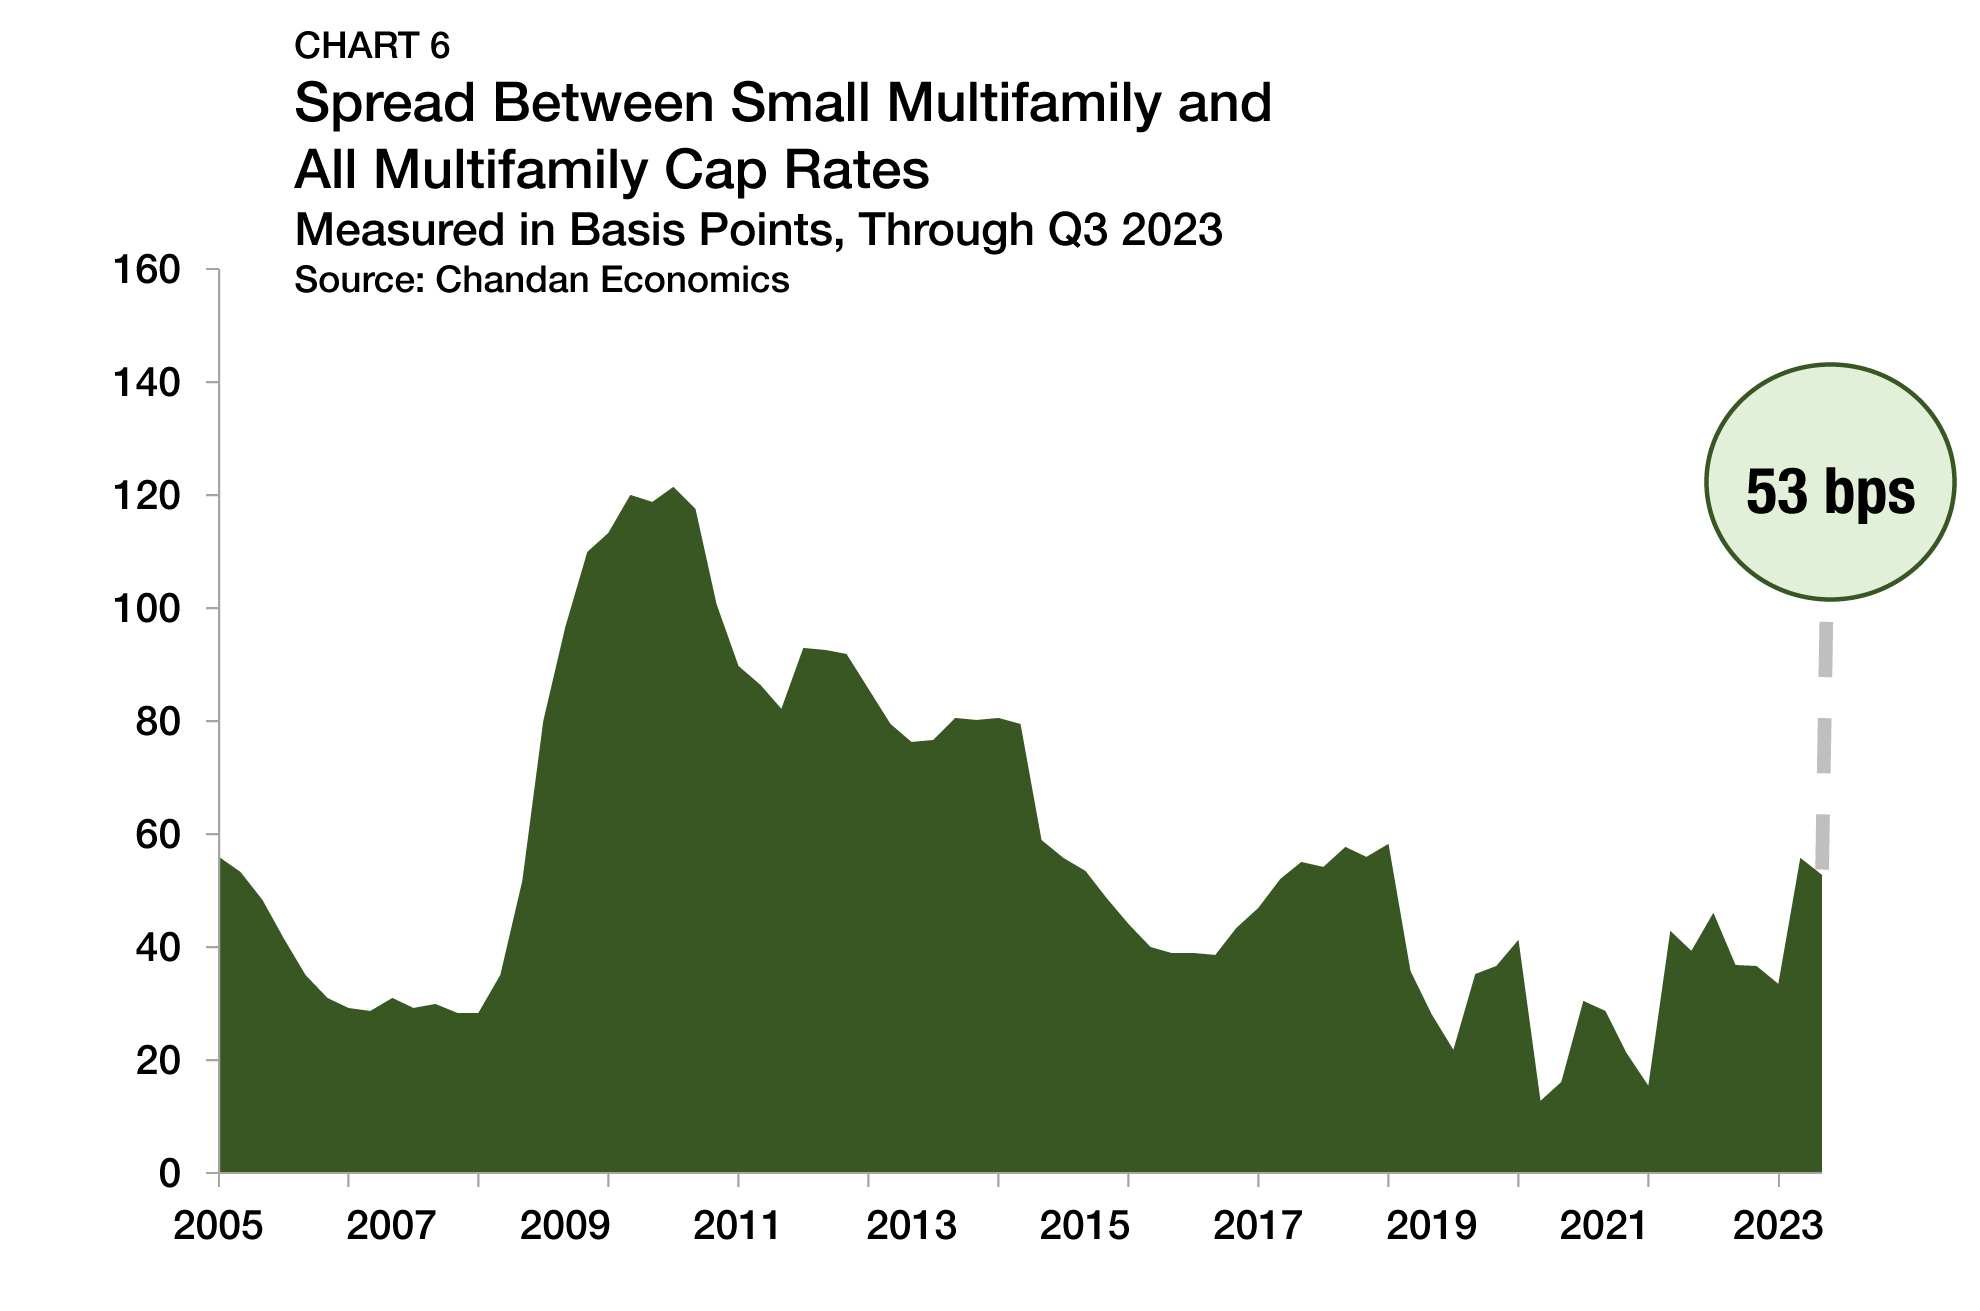
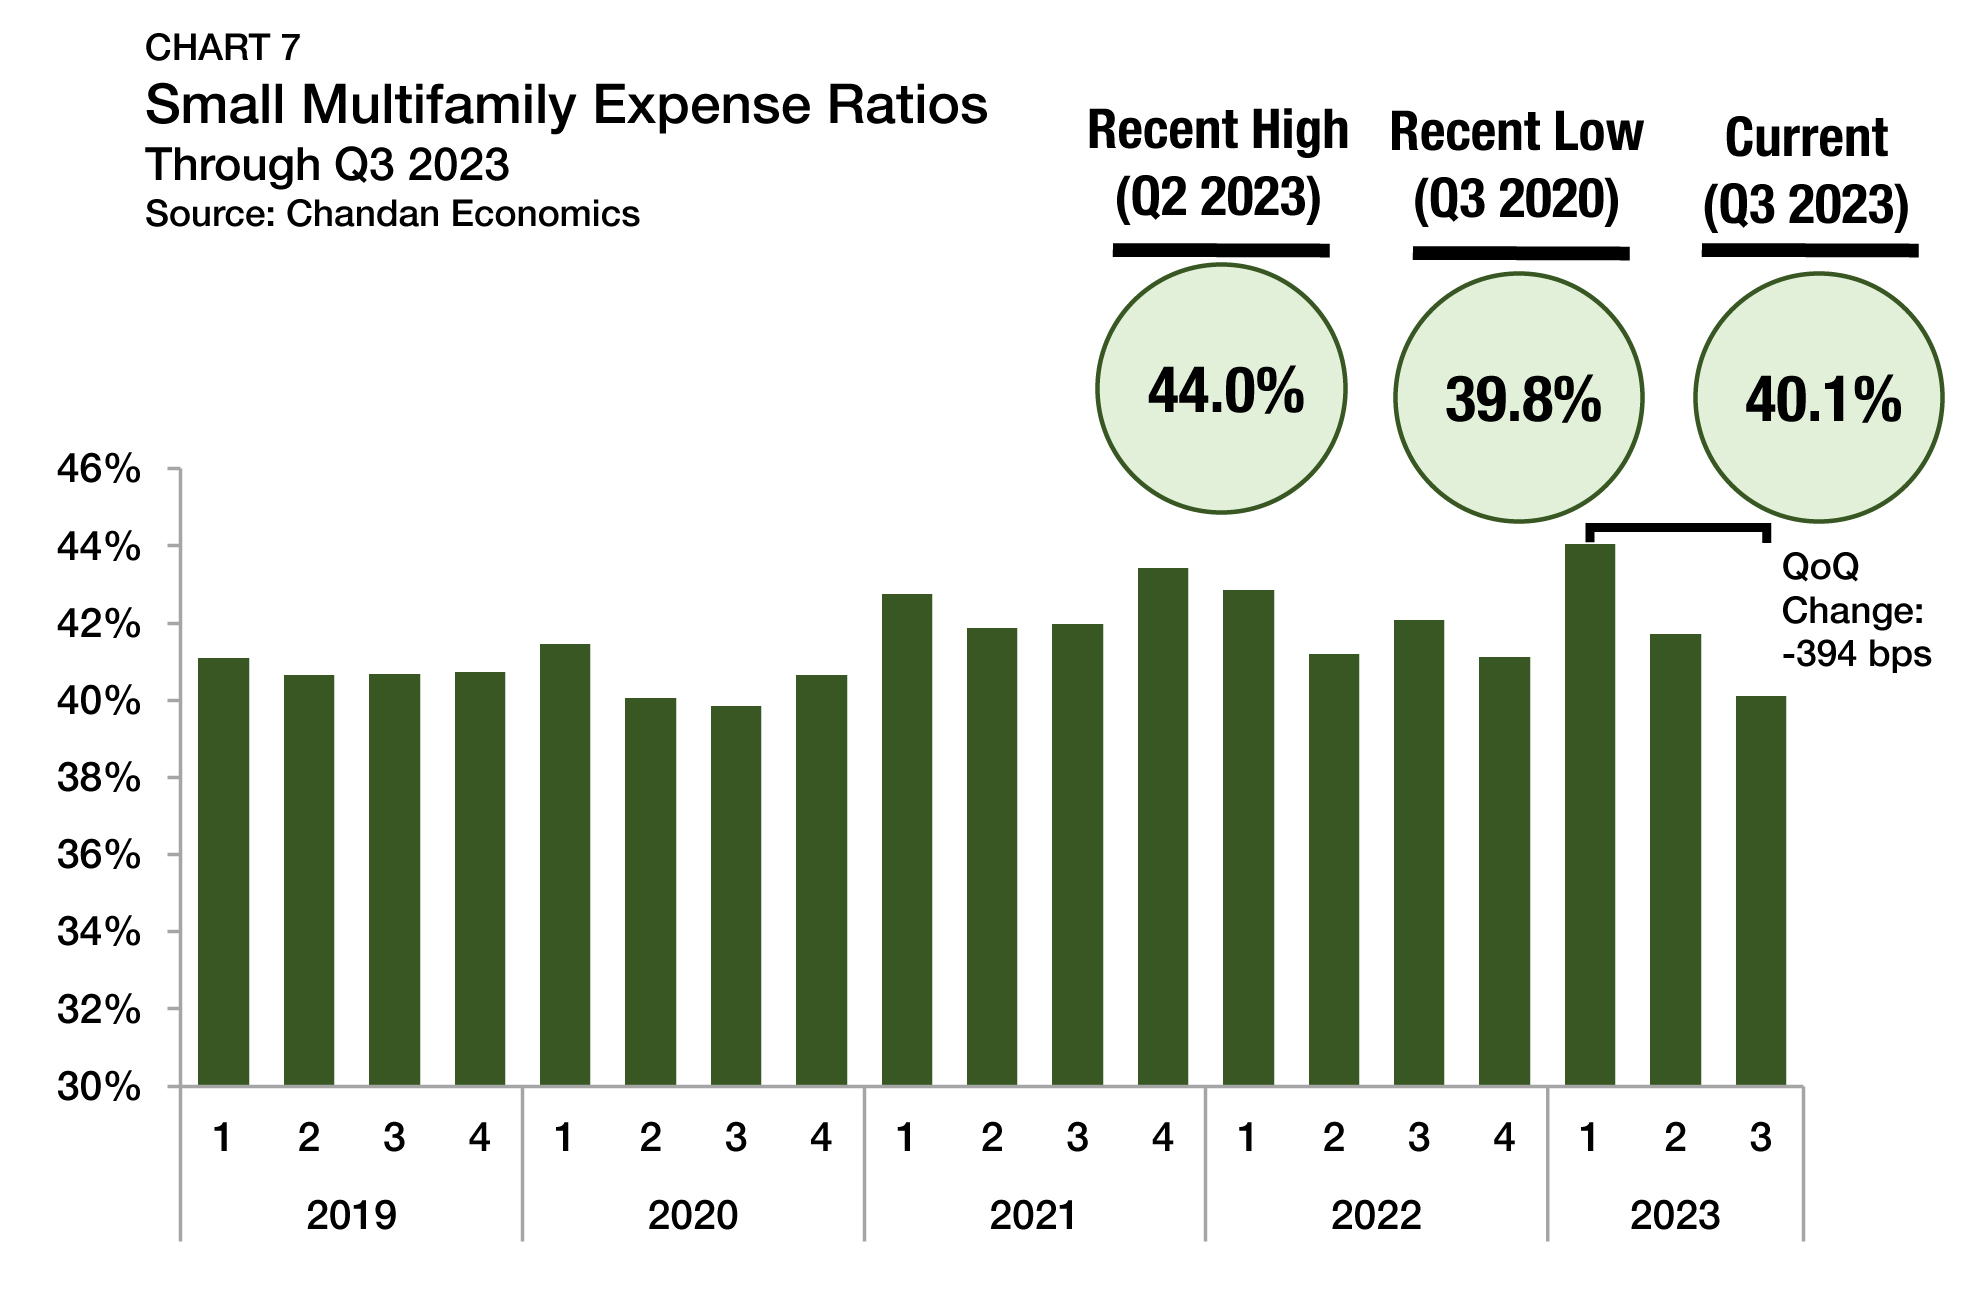
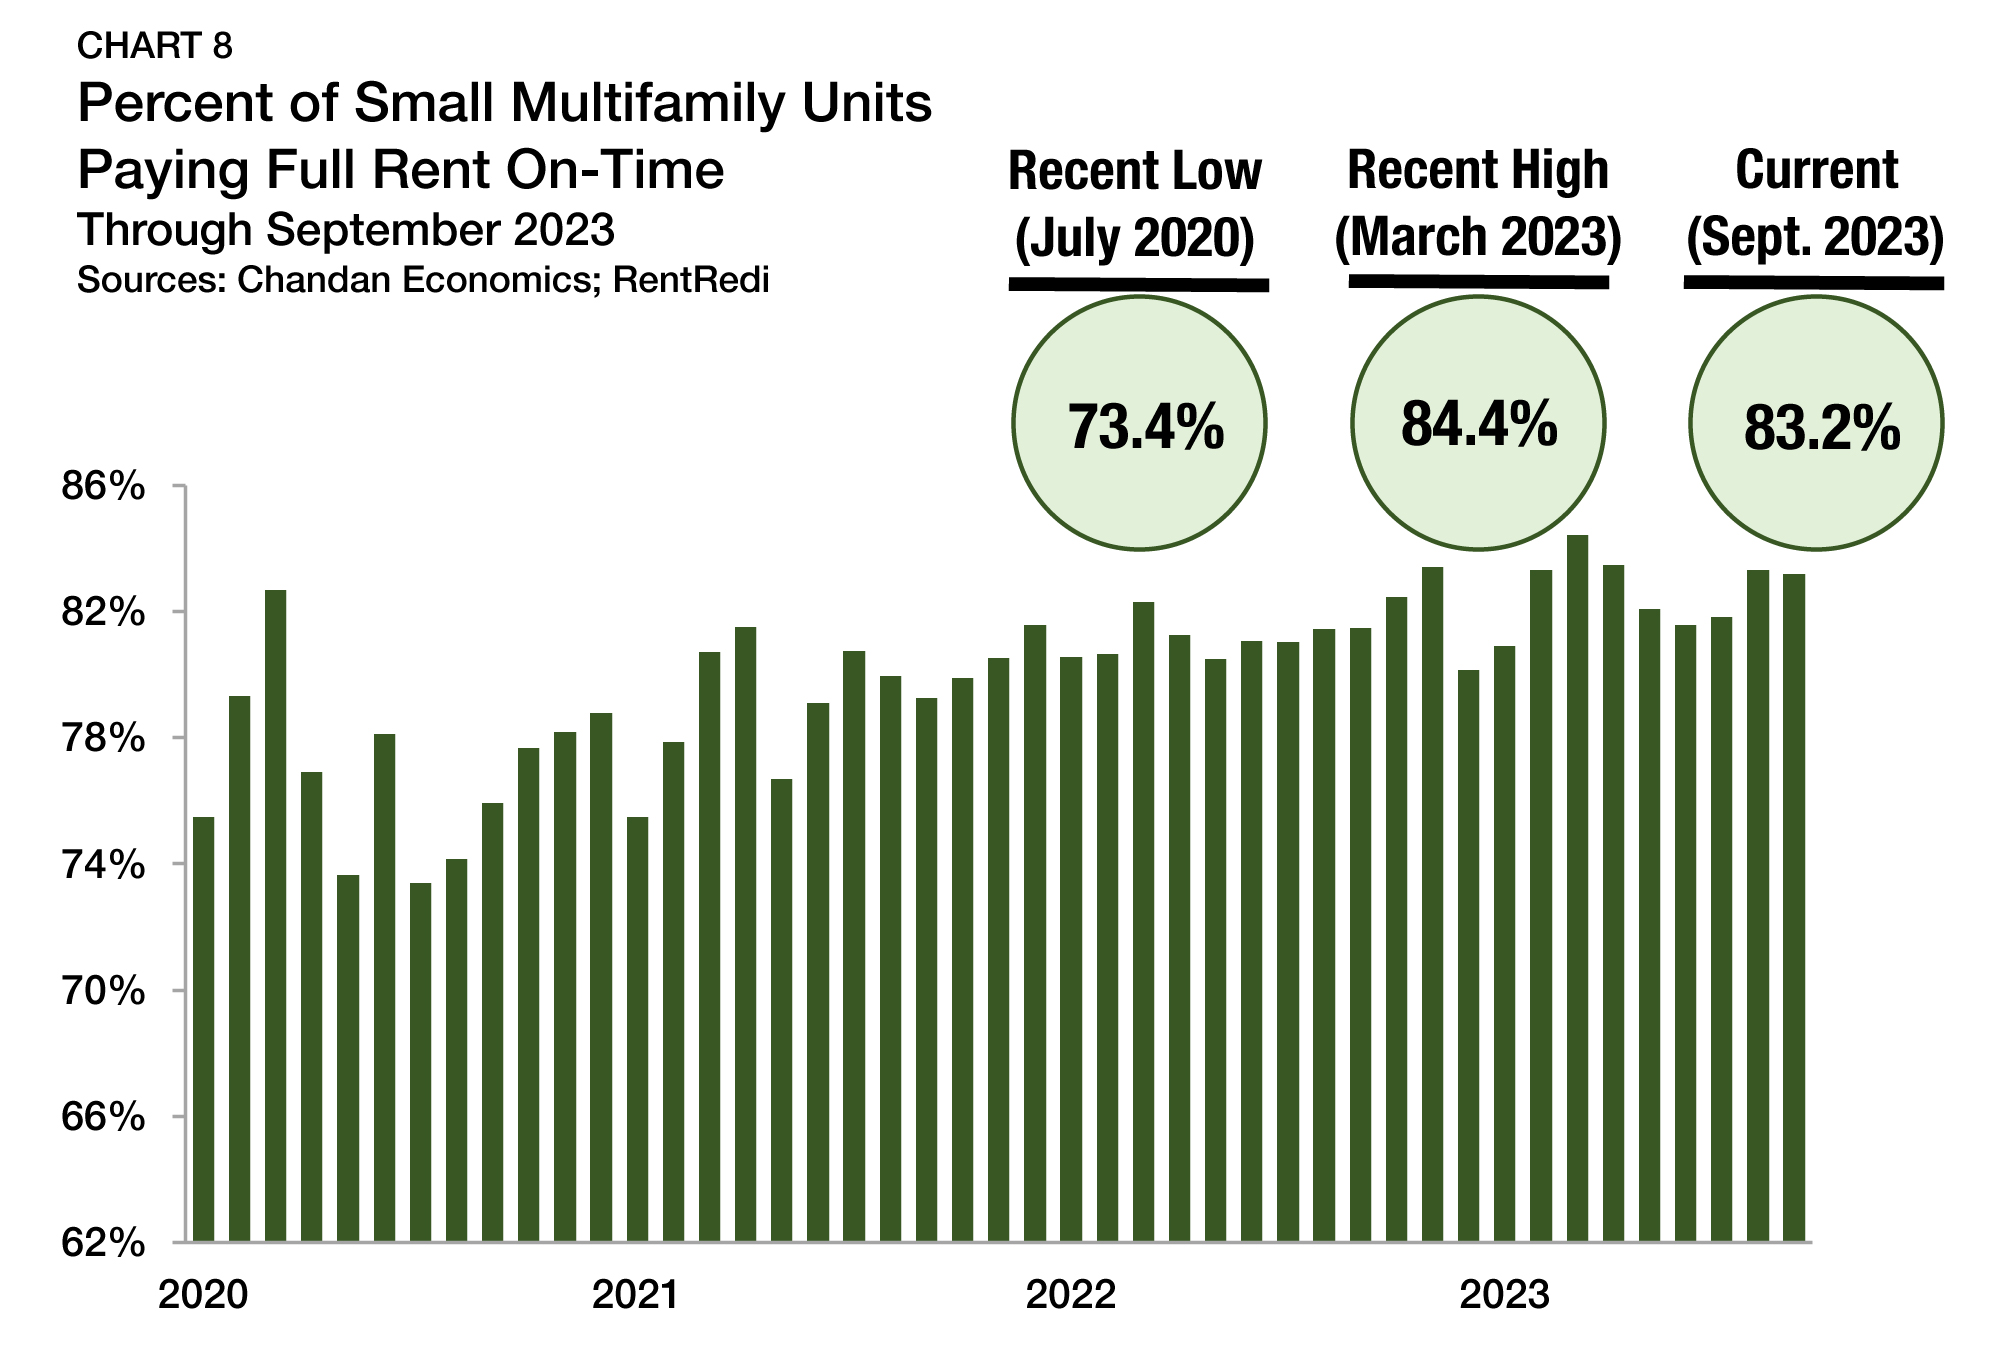
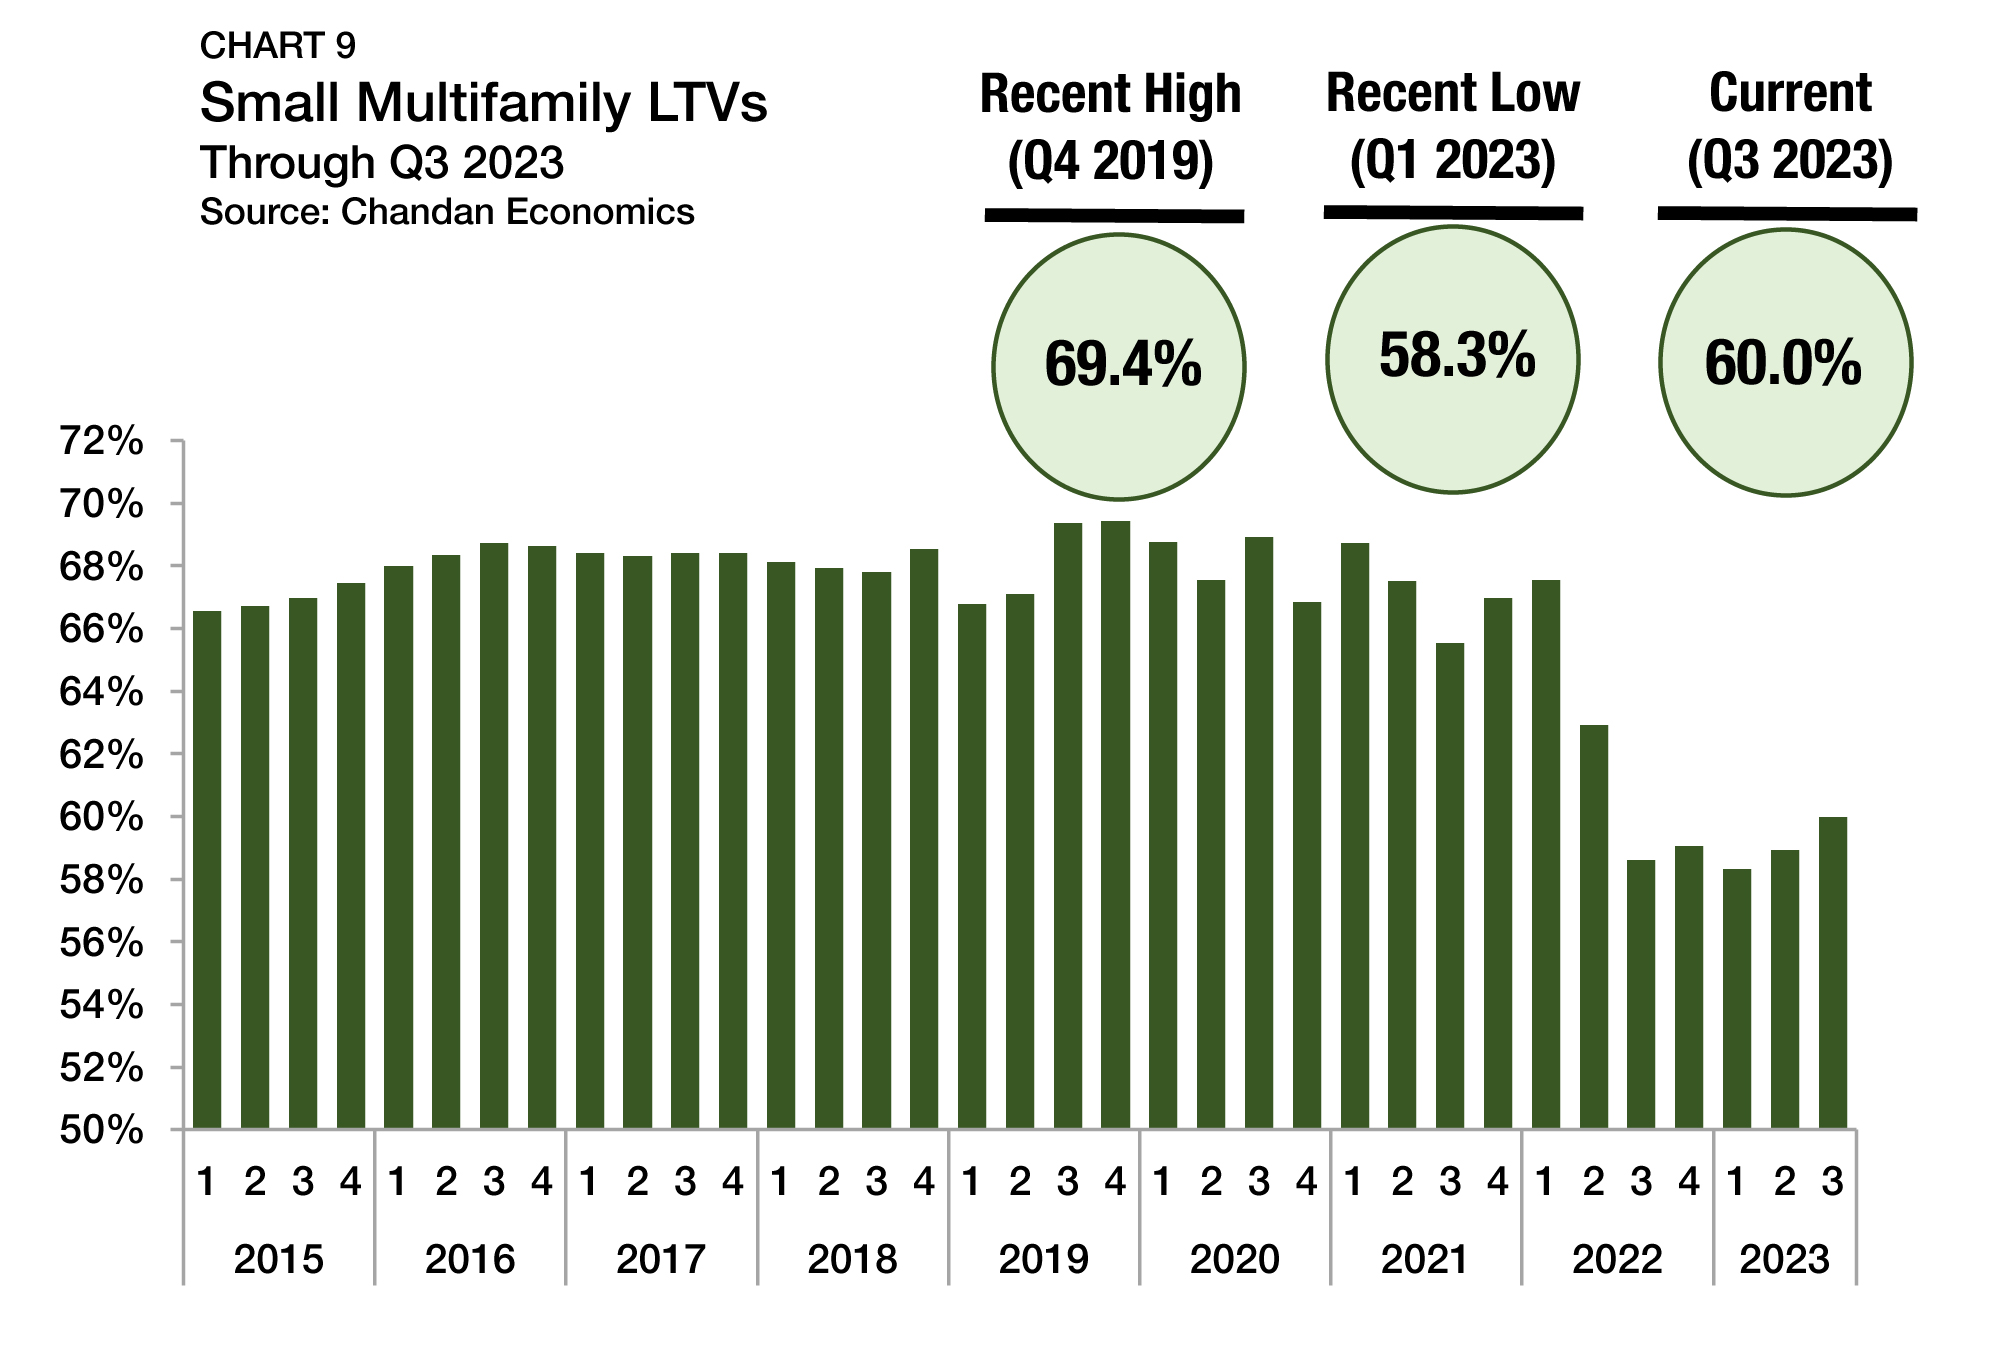
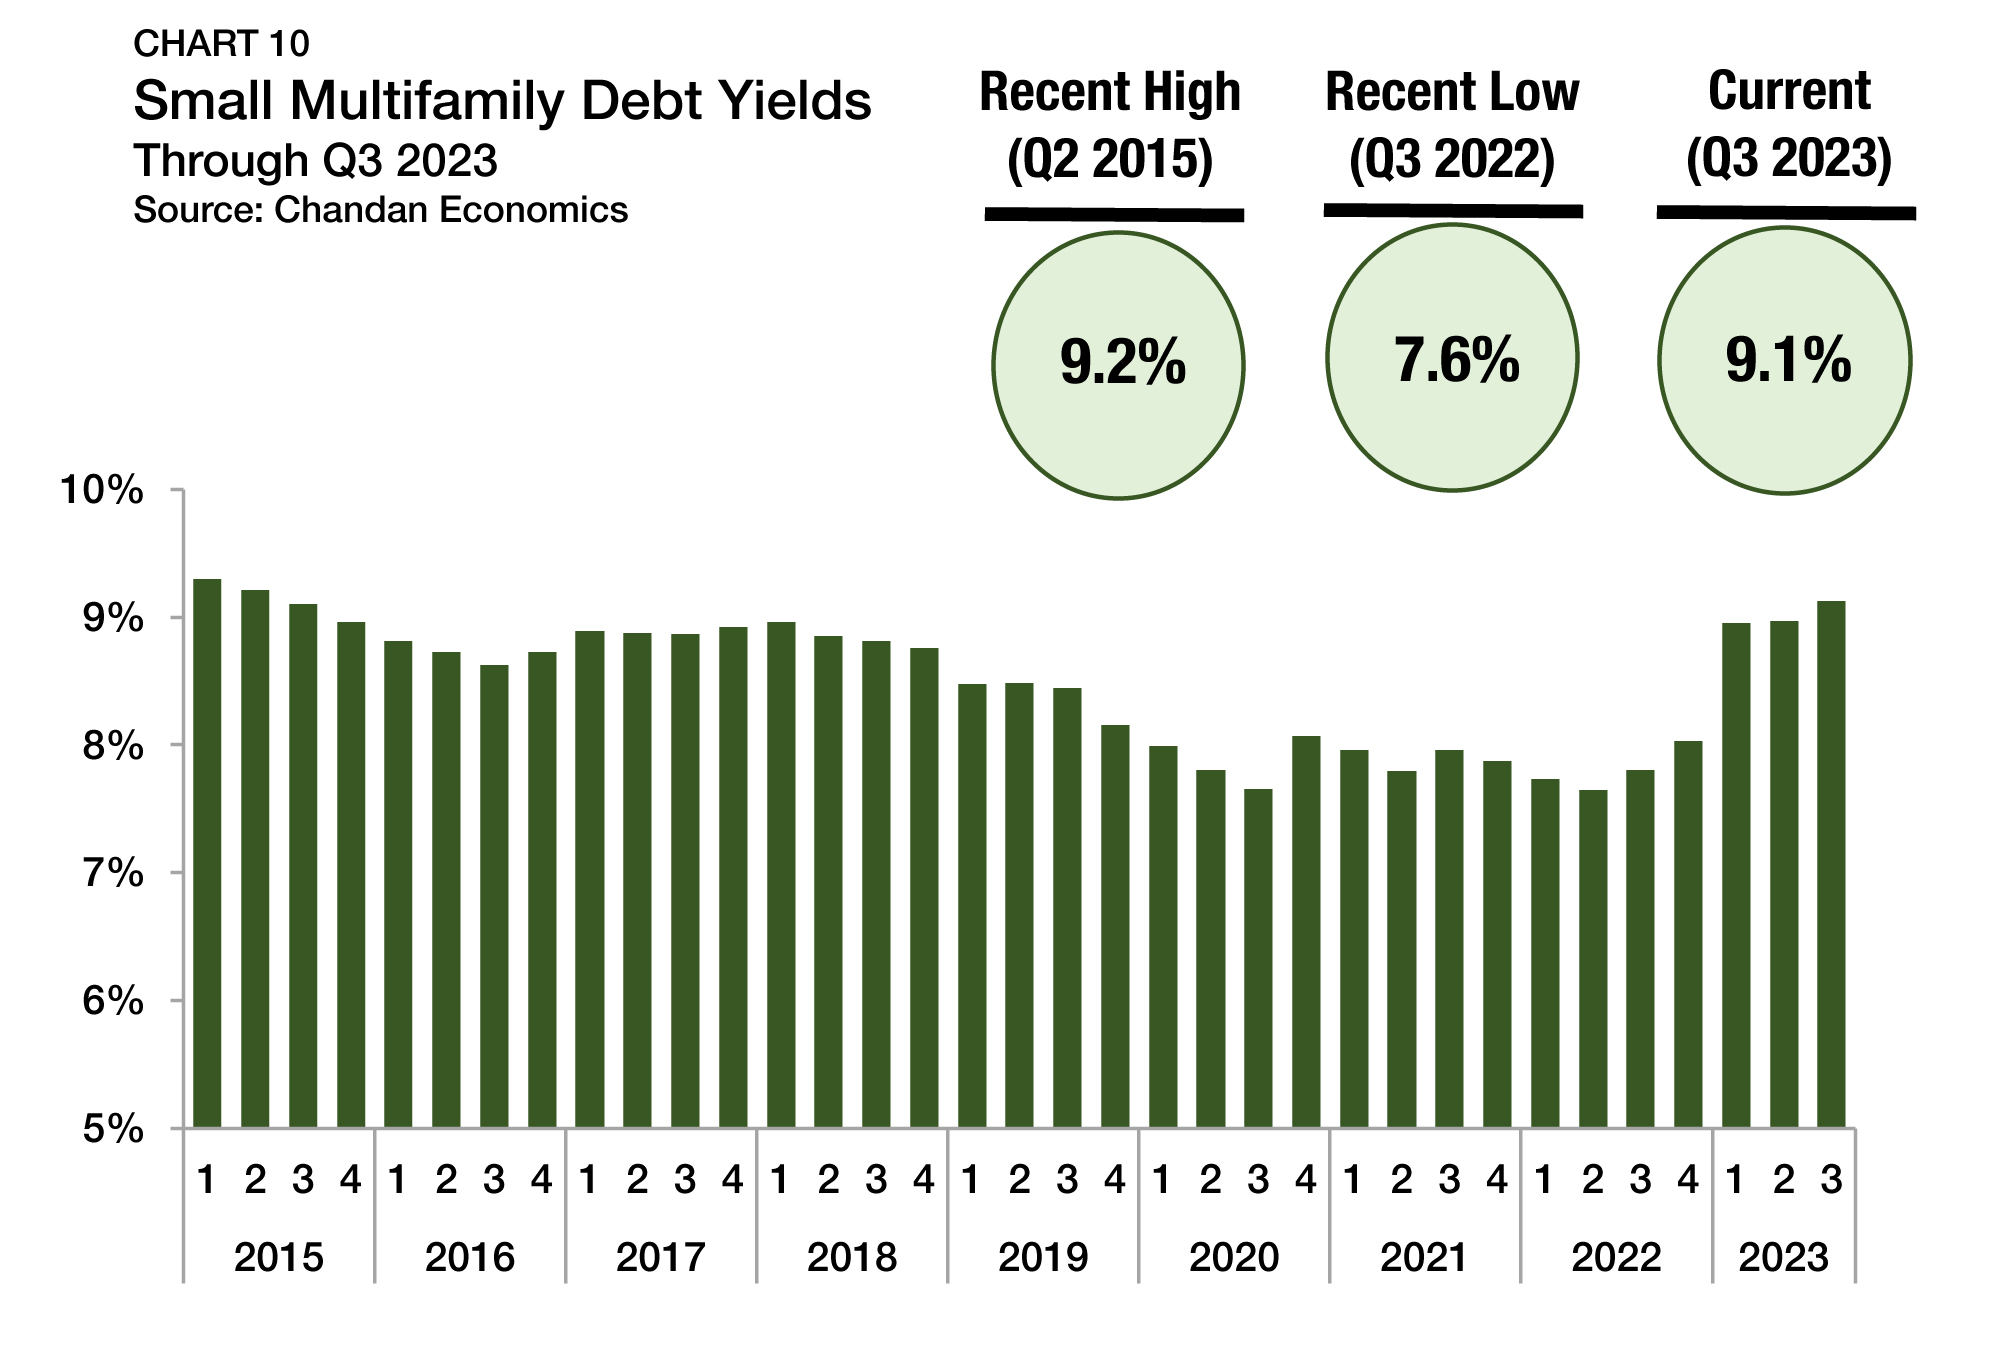
The small multifamily outlook continues to brighten as more signs indicate a normalization has already begun. In the second quarter, originations activity and borrowing conditions improved as completions sat at a five-decade high, Arbor’s Small Multifamily Investment Trends Report Q3 2024, developed in partnership with Chandan Economics, shows. While the subsector’s fundamentals are trending up, it still has room for growth when interest rate relief arrives.

Articles

Top Markets for Multifamily Permitting in 2024’s First Half

While the overall pace of new multifamily permitting per capita in the U.S. slowed recently, it has picked up momentum in pockets of the country, especially the Midwest. In the first two quarters of 2024, Madison, WI, Columbus, OH, and Omaha, NE, were among the major metropolitan markets posting solid permitting gains, another sign of multifamily’s strength in all cycles.

Analysis

Top U.S. Multifamily Rent Growth Markets — Q2 2024

The U.S. multifamily market followed the quick pandemic contraction with a strong recovery, and has now normalized into a more stable cycle. Demand remained strong across the country, with a wide variety of markets among the leaders for rent growth.

Articles

Affordable Housing Supports Positive Physical and Mental Health

Did you know that more U.S. renters now spend over 30% of their income on housing and utilities than at any other time on record? Limited affordable housing options not only increase the rent burdens of low-income tenants but disrupt physical and mental health, underscoring the need for the creation and preservation of more affordable housing units nationwide. Quality affordable housing adds stability to communities and supports healthier environments that can significantly improve well-being.

Analysis

U.S. Multifamily Market Snapshot — August 2024

After skyrocketing through a boom cycle over the past two years, the U.S. multifamily market settled into a cycle of stabilization in the first half of 2024. Rents held steady, occupancy increased, and vacancy rates remained in line with historical averages, while investor sentiment remained positive.

Articles

Annual SFR CMBS Issuance On Pace to Triple in 2024

Single-family rental (SFR) CMBS issuance saw a sizeable pickup through the first half of 2024, with $4.2 billion in new issuance, placing it on pace to at least triple last year’s annual total.

Articles

Arbor’s Build-to-Rent Financing: 10 Reasons to Choose a Premier Lender

Build-to-rent (BTR), a compelling solution to the U.S. housing market’s evolving needs, is experiencing record growth. BTR accounted for 8% of all single-family rental (SFR) construction starts in the 12 months that ended in the first quarter of 2024, according to Arbor’s Single-Family Rental Investment Trends Report Q2 2024. As the need for quality rental units remains high, borrowers have much to gain from partnering with an experienced lender who specializes in build-to-rent financing.

General: 800.ARBOR.10


Small Multifamily Investment Trends Report Q4 2023

Cap Rates Push Higher as Underwriting Standards Stabilize

Key Findings

  • Small multifamily prices fell 3.2% during the quarter.
  • Cap rates climbed 33 bps — the largest single-period jump since 2009.
  • Property-level cash flows remained healthy as rent collections continued to strengthen and expense ratios normalized.

Key Findings & Overview

As we enter the closing chapter of 2023, the small multifamily sector is in the midst of resetting and adjusting to new capital market realities. Even as the Federal Reserve has pumped the brakes on rate hikes over the past few months, financial market conditions have kept tightening as long-term interest rates have ascended. Nevertheless, distress remains limited even as valuations and measures of risk pricing are in flux, signaling a stabilization of conditions.

According to Trepp, the delinquency rate of multifamily loans in CMBS transactions stands at 1.9% through September 2023, the best mark of any commercial property type other than industrial. The trends seen in small asset classes are similar. According to Freddie Mac, 1.5% of small balance multifamily loans are nonperforming — an increase from the 0.7% measured in the summer of 2022 while still below the recent high of 1.7% in spring 2021. To place these figures in context, the multifamily nonperforming rate for loans on bank balance sheets reached 4.7% after the 2008 financial crisis, according to data reported by the FDIC.

While underwriting criteria for small multifamily properties remain tight in a challenging market environment, lending standards held steady in the third quarter of 2023. Market clearing prices continue to edge lower, though the pace of depreciation has slowed, and new deal activity is starting to pick up. Further, the operational profile of the small multifamily subsector has held strong, with rent collections remaining at healthy levels and expense ratios normalizing. While macroeconomic headwinds remain a constant challenge, the small multifamily sector has demonstrated its ability to bend rather than break.

Lending Volume

The $90.1 billion year-end 2022 estimate of new multifamily lending volume on loans with original balances between $1 million and $9 million1 — including loans for apartment building sales and refinancing — represented a modest deceleration from 2021’s record high of $102.1 billion (Chart 1).

To date, 2023 has seen a resetting in the level of small multifamily originations. The current annualized 2023 total is $36 billion, which puts this year on track to be the slowest for new originations since 2012. However, while the annualized total will remain muted, there are signs of activity starting to pick back up. Third-quarter activity was nearly three times higher than the first quarter of the year.

Sustained high interest rates have contributed significantly to the decline in small multifamily origination volumes this year, which has impacted the market in two distinct ways. First, it has widened the bid-ask spread — the difference between what a buyer is willing to pay and what a seller is willing to accept. With costs of capital rising, potential buyers have been requiring larger discounts. At the same time, a lack of multifamily sector distress has meant that few owners are motivated to sell if they do not receive an offer close to their perception of fair value. Driven by this disagreement in price, 2023 has seen a dearth of apartment sales.

The second way that high interest rates impact small multifamily originations is that they reduce the incentive for investors to pursue cash-out refinancing. When interest rates are favorable, borrowers often use accrued equity in their properties to finance subsequent acquisitions. However, in today’s higher-rate environment, a cash-out refinancing would likely result in a voluntary increase in debt servicing costs. After reaching a recent high of 75.6% in the third quarter of 2022, the refinancing share of originations fell in three consecutive quarters, dropping to 60.5% in the second quarter of 2023 (Chart 2). However, there were signs of improvement in the third quarter as the refinancing share of originations shot up to 72.7% — potentially signaling that borrowers are no longer waiting for a rapid return of accommodative interest rates.

Arbor Small Multifamily Price Index

As measured by the Arbor Small Multifamily Price Index2, small multifamily asset valuations are down 11.9% from the same time last year (Chart 3). Meanwhile, prices fell just 0.4% in the third quarter of 2023 — the smallest single-period movement in the past year.

Negative pricing pressures are not unique to either multifamily or the small asset subsector in this interest rate environment. The higher cost of capital means that potential buyers of all property types have larger required yields. However, the slowing pace of devaluation combined with an increasing pace of originations suggests that bid-ask spreads are starting to narrow — albeit at lower market clearing prices than a year ago.

Cap Rates & Spreads

As 10-year Treasury yields push up against their high-water mark of the past 16 years, cap rates across all commercial property types, including multifamily and the small asset subsector, are on the rise. In the third quarter of 2023, small multifamily cap rates averaged 5.8%, reaching their highest point in over four years (Chart 4).

After cap rates in this subsector reached their all-time low of 5.0% in the third quarter of 2022, they have subsequently increased in four consecutive quarters. Small multifamily cap rates jumped 17 bps during the third quarter alone and are up 76 bps from this time last year — the most substantial year-over-year increase since 2010. The small multifamily risk premium, measured by comparing cap rates to the yield on the 10-year Treasury, is the additional compensation that investors require to account for higher levels of risk. This risk premium compressed by 38 bps in the third quarter of 2023, landing at 161 bps (Chart 5). The declining risk premium comes as long-term Treasury yields have rapidly risen in recent months. If long-term interest rates hold up at current levels, it could mean more upward pressure for cap rates on the horizon.

Between 2016 and 2021, the small multifamily risk premium averaged 372 bps and never fell below 290 bps or rose above 441 bps. Its movement back to a more sizable range that is in line with recent patterns is a reasonable baseline outlook for the year ahead. Meanwhile, the cap rate spread between small multifamily assets and the rest of the multifamily sector, a measure of the risk unique to smaller properties, fell by a minuscule 3 bps during the quarter to finish at 53 bps (Chart 6).

Expense Ratios

Expense ratios, measured as the relationship between underwritten property-level expenses and effective gross income, are showing signs of improvement. Driven by increases in vacancies and operating expenses, the small multifamily expense ratio surged to start the year, reaching 44.7% in the first quarter (Chart 7). However, the surge was short-lived. Expense ratios fell in both the second and third quarters of 2023, settling at 40.1% — 394 bps below the first quarter of the year.

Rent Collections

In recent months, on-time rental payment rates in small multifamily properties have consistently been robust, according to Chandan Economics and RentRedi’s Independent Landlord Rental Performance Report. In September 2023, tenants paid their full rent on time in an estimated 83.2% of units — improving 173 bps from the same time last year (Chart 8).

Due to a resilient labor market, tenants’ ability to make on-time rental payments continues to be one of the small multifamily subsector’s biggest strengths. Even in a challenging economic environment, healthy property-level cash flows have limited distress.

Leverage & Debt Yields

Underwriting standards remained tight during the third quarter of the year. Loan-to-value ratios (LTVs) improved slightly, rising 105 bps from 58.9% to 60.0% (Chart 9). Moreover, LTVs have now risen in two consecutive quarters, signaling that fears of sizable upcoming devaluations are calming. Nevertheless, current LTVs are exceptionally low and represent very tight underwriting standards compared to conditions seen as recently as early 2022. While small multifamily LTVs have improved from the first-quarter 2023 low by 167 bps, they remain down from first-quarter 2022 levels by a far more substantial 756 bps.

Average debt yields for small multifamily loans resumed their ascent in the third quarter, rising to 9.1% (Chart 10). Small multifamily debt yields have now risen in each of the past five quarters, and this pace of increase does appear to be settling down. Between the second quarter of 2022 and the first quarter of 2023, debt yields rose by 131 bps, notching an average quarterly increase of 45 bps in that time. In the following six months, small multifamily debt yields rose by a cumulative total of 17 bps.

The inverse of debt yields, the debt per dollar of net operating income (NOI), for small multifamily loans fell again during the quarter. Small multifamily borrowers secured an average of $10.96 in new debt for every $1.00 of property NOI, down $0.19 from the previous quarter and the lowest level since 2015.

Together, these two trends indicate that underwriting standards remain conservative as capital and real estate markets adjust to new economic realities. However, movements in both were marginal, offering hope that credit markets do not need to tighten further.

Outlook

Like all commercial real estate asset classes, the small multifamily market will continue to face challenges over the next several months. Even as the Federal Reserve is near or at the end of its monetary tightening cycle, markets broadly expect that the central bank will reduce short-term interest rates more slowly than they raised rates over the past year and a half. As we head into 2024, investors should watch for how a potential yield curve normalization could push long-term Treasury yields higher in the coming months, putting more upward pressure on cap rates. Despite the unsettling market impacts of high interest rates, the small multifamily sector has maintained operational stability, and there is momentum toward price stabilization. On balance, the small multifamily sector, which is bolstered by underlying tenant demand and healthy property-level cash flows, remains well-equipped to navigate through macroeconomic headwinds.

1 All data, unless otherwise stated, are based on Chandan Economics’ analysis of a limited pool of loans with original balances of $1 million to $9.0 million and loan-to-value ratios above 50%.
2 The Arbor Small Multifamily Price Index (ASMPI) uses model estimates of small multifamily rents and compares them against small multifamily cap rates. The index measures the estimated average price appreciation on small multifamily properties with 5 to 50 units and primary mortgages of $1 million to $7.5 million. For the full methodology, visit arbor.com/asmpi-faq.

For more small multifamily research and insights, visit arbor.com/research

About Arbor
Arbor Realty Trust, Inc. (NYSE: ABR) is a nationwide real estate investment trust and direct lender, providing loan origination and servicing for multifamily, single-family rental (SFR) portfolios, and other diverse commercial real estate assets. Headquartered in Uniondale, New York, Arbor manages a multibillion-dollar servicing portfolio, specializing in government-sponsored enterprise products. Arbor is a leading Fannie Mae DUS® lender, Freddie Mac Optigo® Seller/Servicer, and an approved FHA Multifamily Accelerated Processing (MAP) lender. Arbor’s product platform also includes bridge, CMBS, mezzanine, and preferred equity loans. Arbor is rated by Standard and Poor’s and Fitch. In June 2023, Arbor was added to the S&P SmallCap 600® index. Arbor is committed to building on its reputation for service, quality, and customized solutions with an unparalleled dedication to providing our clients excellence over the entire life of a loan.

Disclaimer
All content is provided herein “as is” and neither Arbor Realty Trust, Inc. or Chandan Economics, LLC (“the Companies”) nor their affiliated or related entities, nor any person involved in the creation, production and distribution of the content make any warranties, express or implied. The Companies do not make any representations regarding the reliability, usefulness, completeness, accuracy, currency nor represent that use of any information provided herein would not infringe on other third party rights. The Companies shall not be liable for any direct, indirect or consequential damages to the reader or a third party arising from the use of the information contained herein.