
FREDDIE MAC® Conventional Small
Small Multifamily Investment Trends Report Q1 2025
Asset Valuations Edge Higher as Credit Conditions Tighten
Key Findings
-
Small multifamily valuations have started rising again, growing modestly in the third and fourth quarters of 2024.
-
Origination volumes ticked up 5.0% despite interest rate headwinds.
-
The structural need for workforce housing continues to support the
sector’s demand.
State of the Market
Small multifamily, much like all of commercial real estate, contended with an abrupt increase in long-term interest rates at the end of 2024. Now, the future path of monetary policy looks less accommodative than it did a few months earlier. As of late January, markets assign a 28.4% probability that the Federal Reserve will cut short-term interest rates by more than 50 basis points (bps) this year. While small multifamily’s normalizing trend has been interrupted by resurgent interest rate headwinds, the sector has repeatedly demonstrated the structural strength to withstand economic cycles.
Similar patterns have played out through the overall multifamily market. The National Multifamily Housing Council’s (NMHC) Quarterly Survey of Apartment Conditions recently indicated that multifamily practitioners observed lower sales volume and a decline in levels of capital availability in the fourth quarter of last year. At the same time, construction has surged. In 2024, 590,600 new multifamily units were completed, the highest total since 1974 and more than 60% above pre-pandemic norms. Even as housing options expanded, multifamily remained balanced in 2024, with rent growth and occupancy rates holding firm.
Driven by rising Treasury rates, measures of risk pricing and risk appetites for small multifamily moved in a more cautious direction at the end of the year, as cap rates and debt yields rose and loan-to-value ratios dipped. However, encouraging signals have persisted as asset valuations and origination volumes returned to modest growth.
Amid ongoing macroeconomic uncertainty, the small multifamily sector remains favorably positioned for stability as the structural need for affordable housing in the U.S. has supported the strength of the sector’s demand profile.
Lending Volume
The $46.7 billion year-end 2024 estimate of new multifamily lending volume on loans with original balances between $1 million and $9 million1 (including loans for apartment building sales and refinancing) increased modestly from $44.4 billion in 2023 (Chart 1). After declining in both 2022 and 2023, originations improved 5.0% last year. While 2024’s production was well below pandemic highs, it was close to pre-pandemic averages. Between 2015 and 2019, small multifamily origination volumes had a yearly average of $50.5 billion.
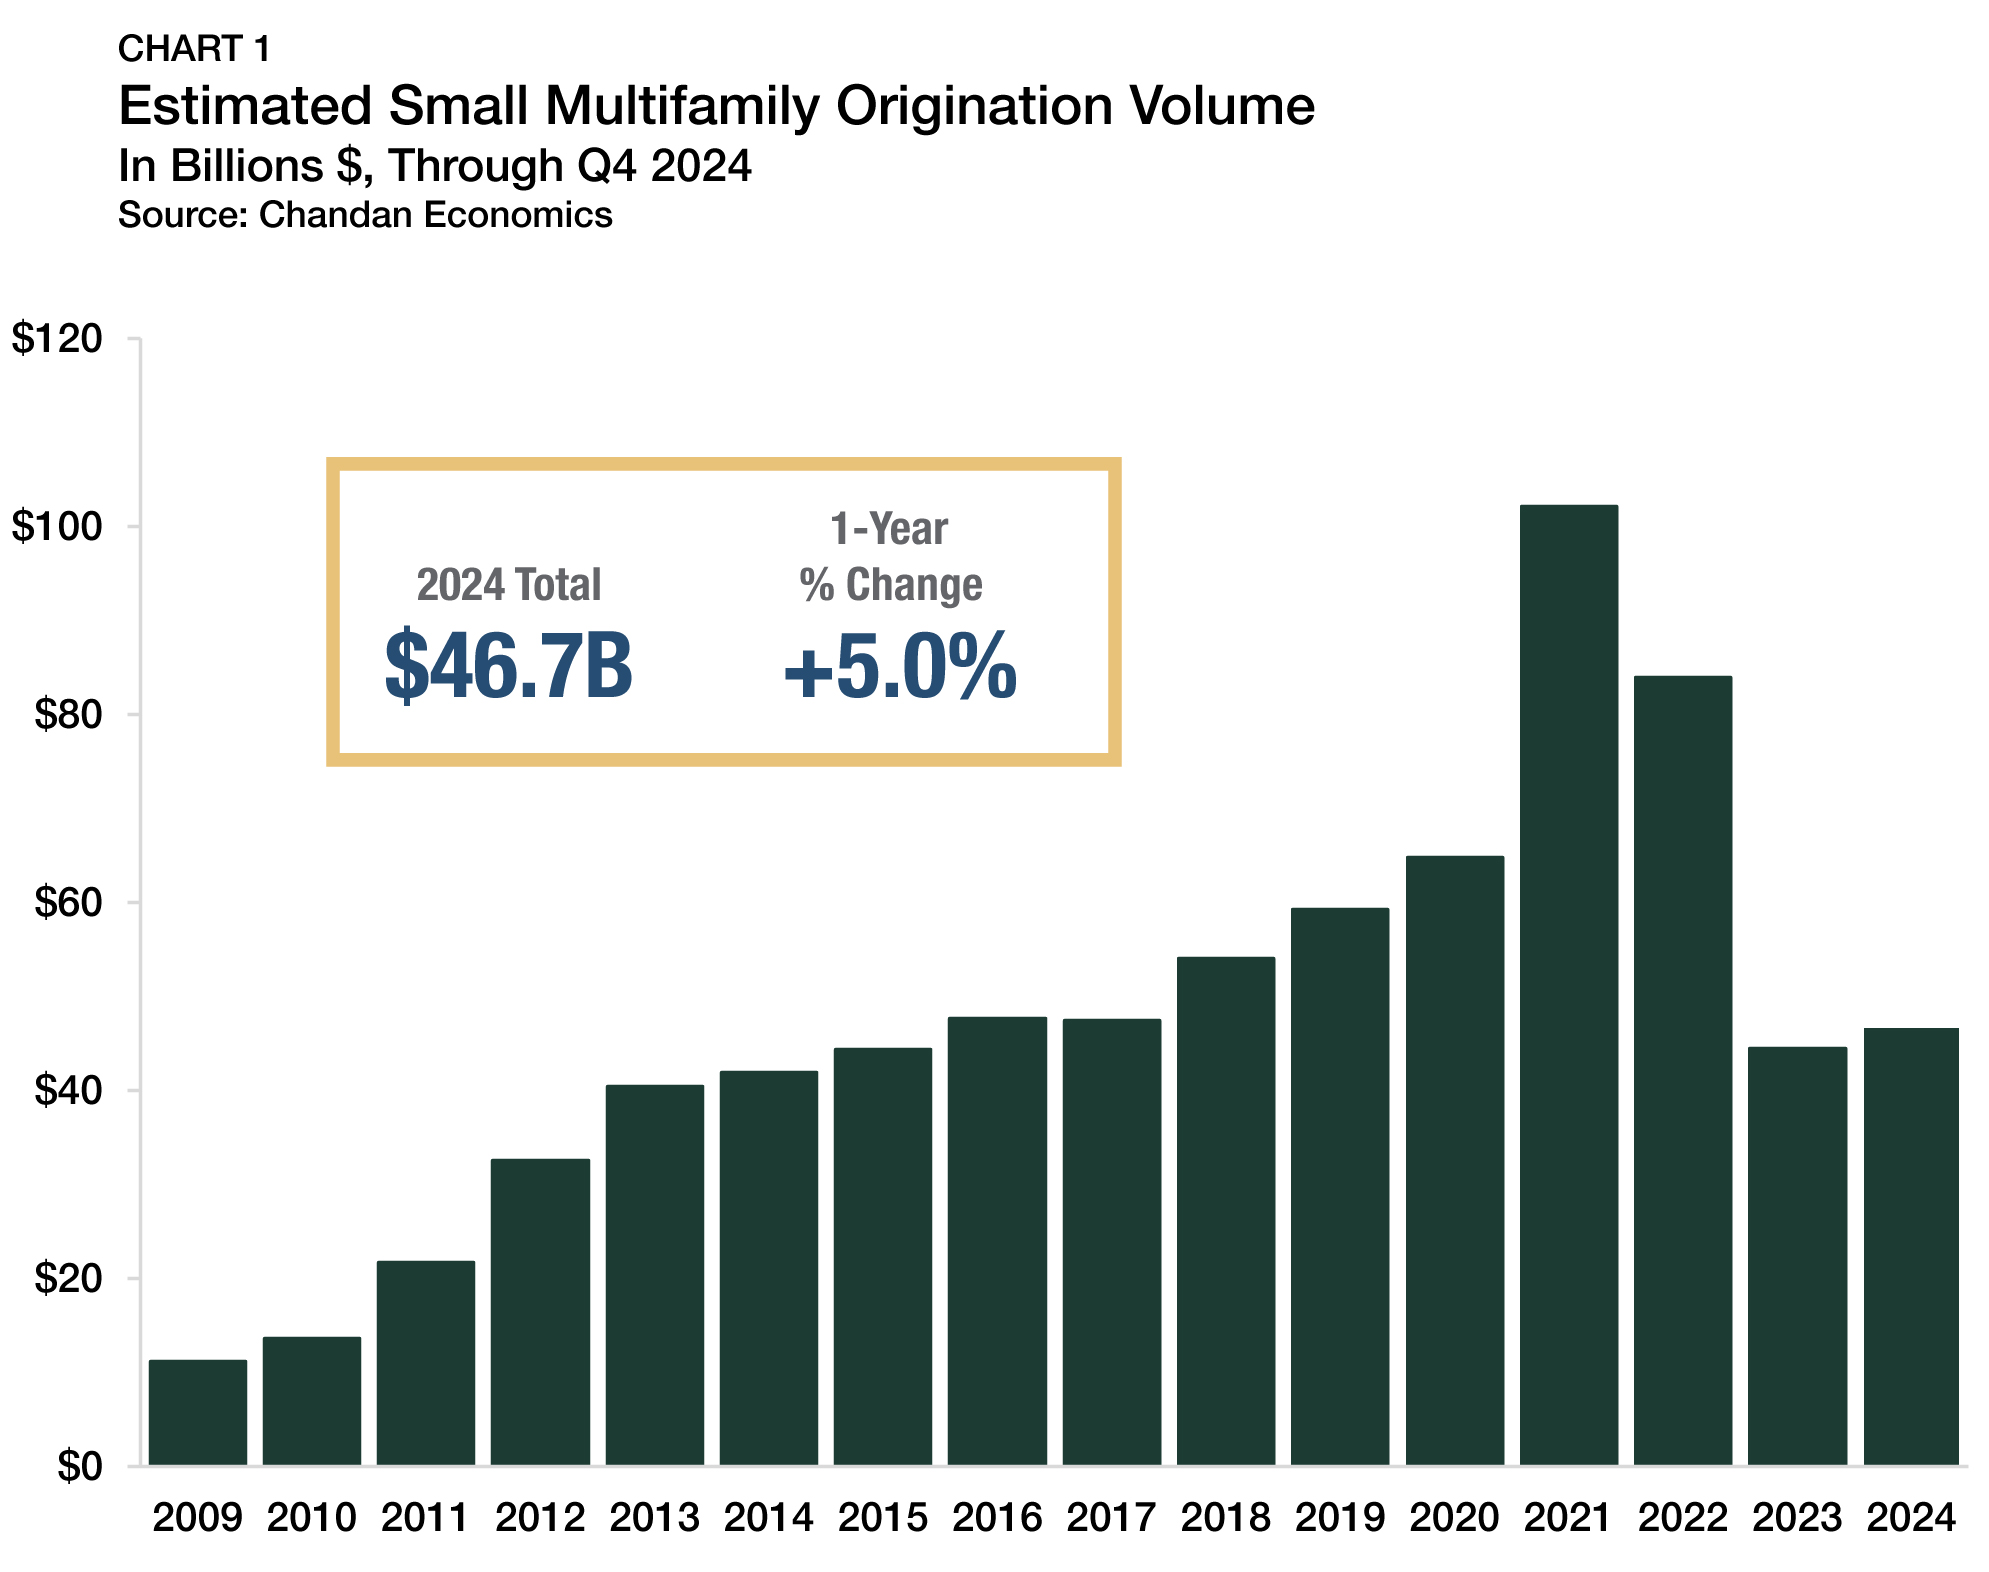
The interest rate environment in 2023 and 2024 was a primary factor that suppressed origination volumes. Higher financing costs have meant that prospective buyers have required steeper asset price discounts to execute transactions. At the same time, asset owners who held properties before 2022 generally enjoyed low debt servicing costs over the past two years. As a result, buyers and sellers have been more patient, leading to less deal activity.
1 All data, unless otherwise stated, are based on Chandan Economics’ analysis of a limited pool of loans with original balances of $1 million to $9.0 million and loan-to-value ratios above 50%.
Loans by Purpose
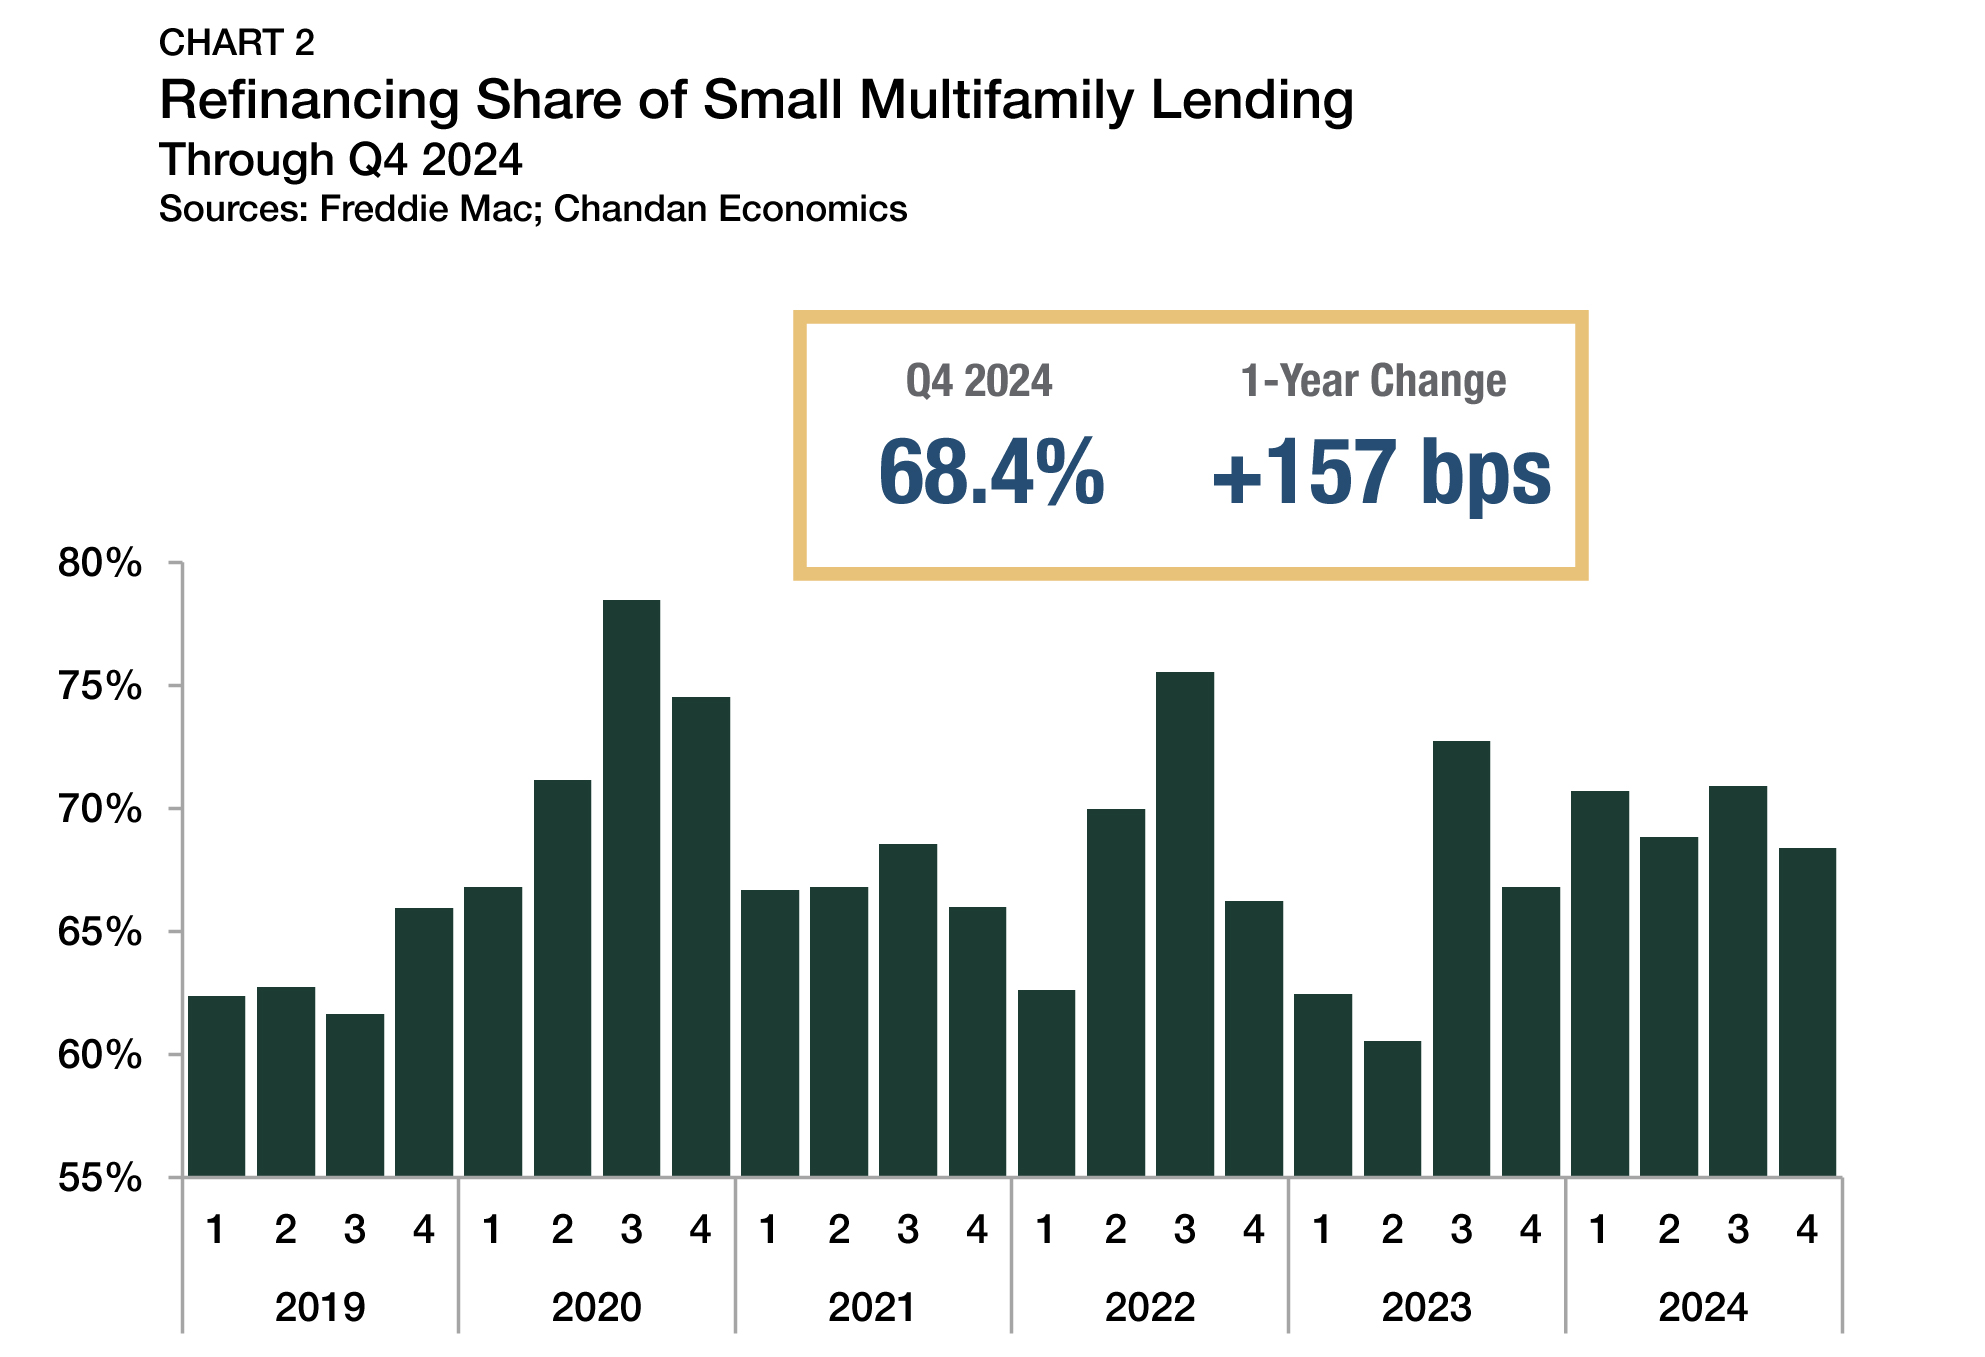
High interest rates have reduced the incentive for investors to pursue cash-out refinancings. After hitting a recent high of 75.6% in the third quarter of 2022, the refinancing share of originations fell substantially to reach a low point of 60.5% in the second quarter of 2023 (Chart 2). However, the share has recovered and moderated over the past six quarters, ranging between 66.8% and 72.7%, and finished the fourth quarter of 2024 at 68.4%.
Arbor Small Multifamily Price Index
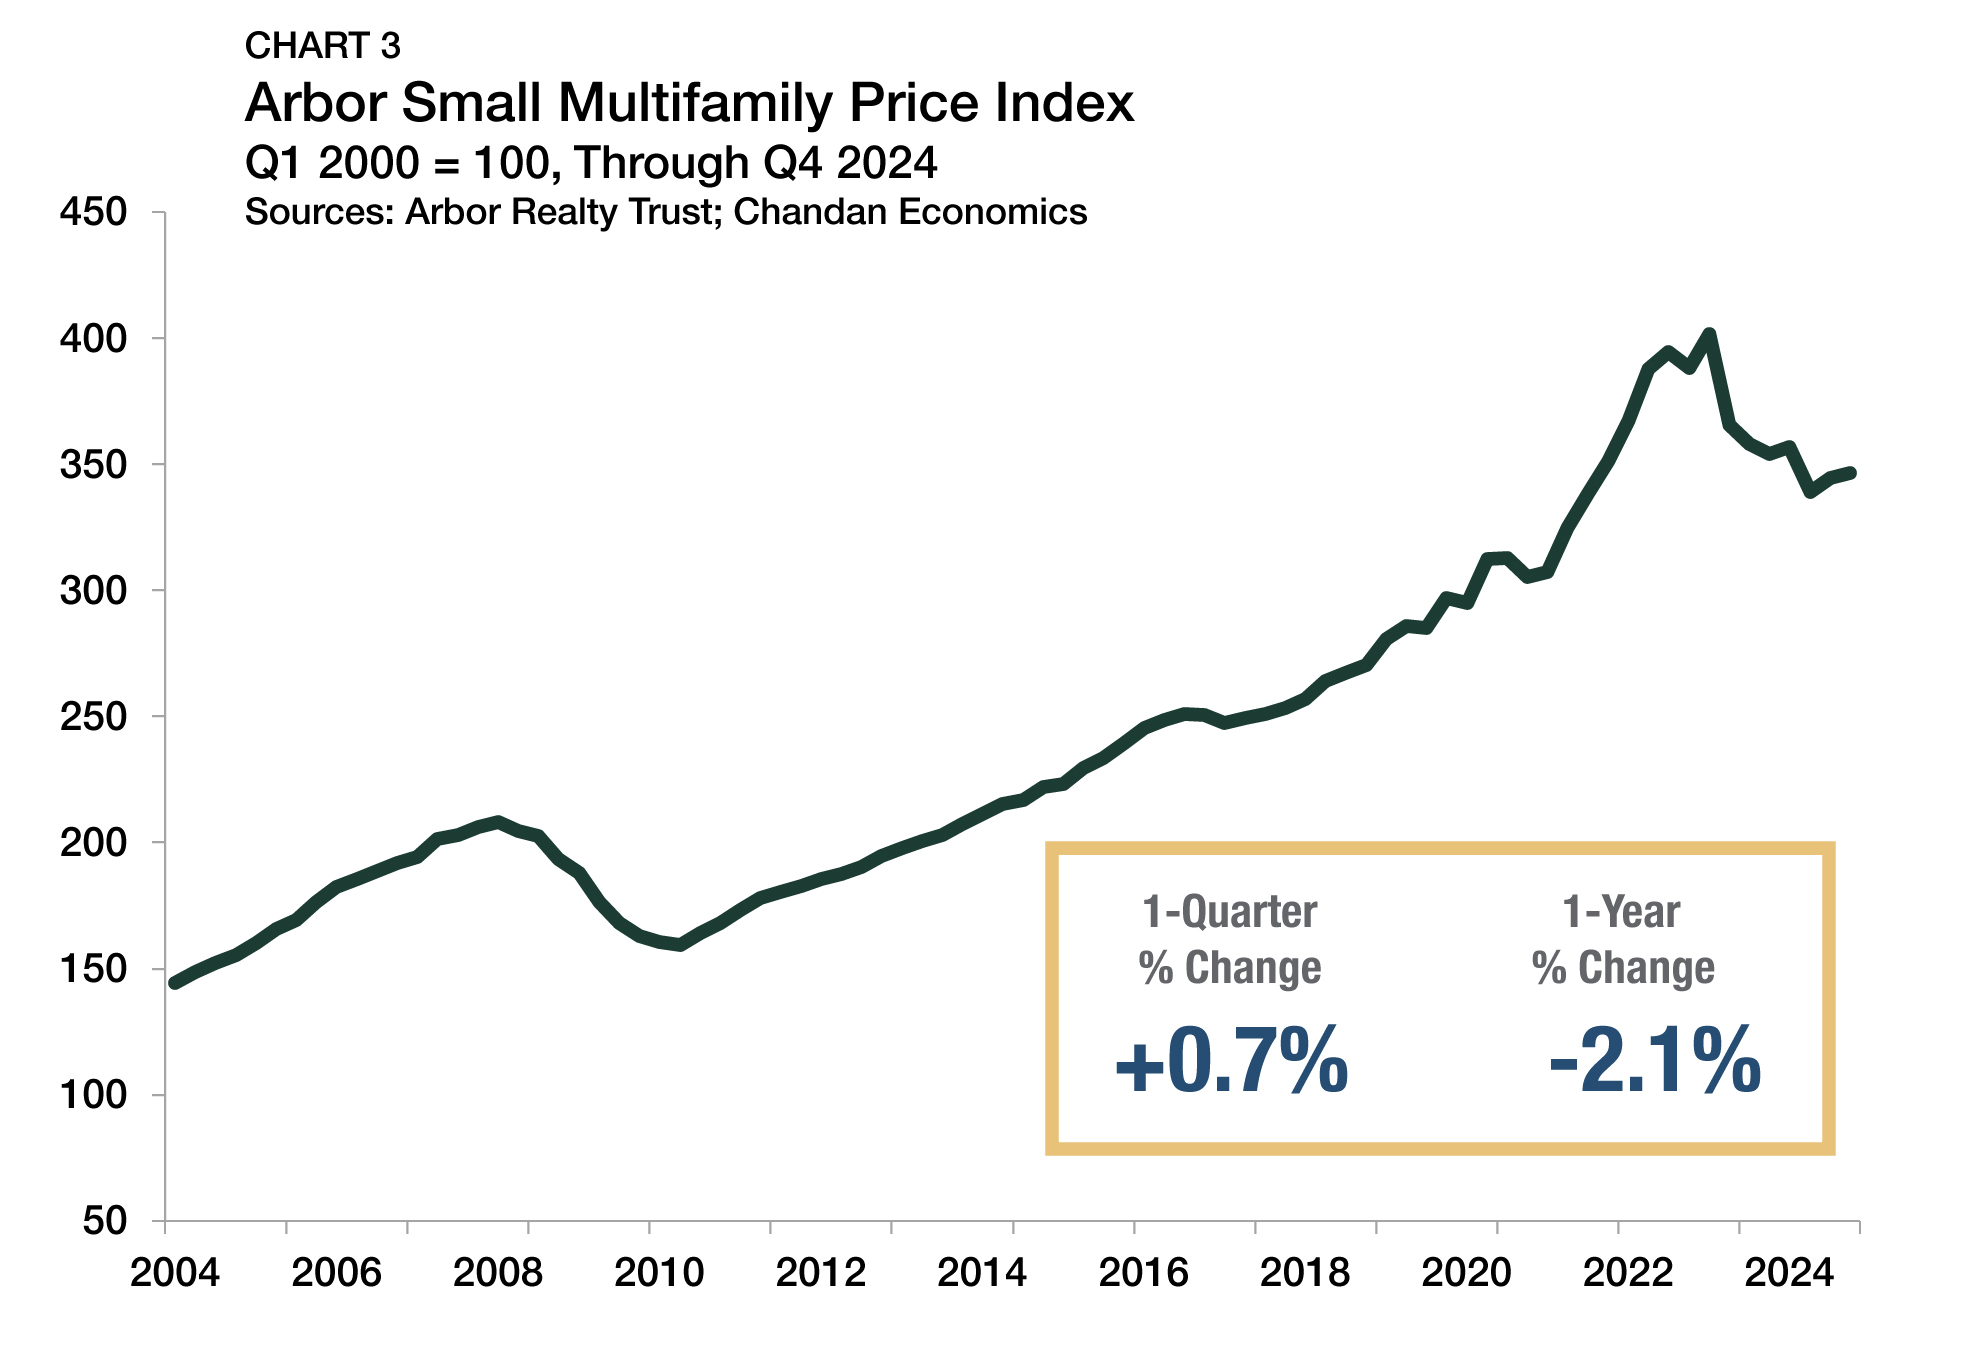
According to the Arbor Small Multifamily Price Index, asset valuations were down 2.1% from a year earlier through the fourth quarter of 2024 (Chart 3), marking the seventh consecutive quarter of annual price declines. Despite negative annual growth, green shoots of optimism are still sprouting. The severity of annual declines lessened in each of the past three quarters. On a quarterly basis, prices rose in both the third (+1.5%) and fourth (+0.7%) quarters. Behind the slight quarterly increase was an improving picture of property-level revenues as both rent growth and occupancy rates moved higher, while a slight increase in cap rates acted as a counterweight, muting overall gains.
Cap Rates & Spreads
In the fourth quarter of 2024, small multifamily cap rates averaged 6.0%, a slight increase (+2 bps) from the previous quarter (Chart 4). After small multifamily cap rates rapidly rose to the 6.0% range in the second quarter of 2024, they held around that mark for the remainder of the calendar year despite significant interest rate volatility. Compared to the cyclical low point of 4.9% set in the first quarter of 2023, small multifamily cap rates remained up by a cumulative 108 bps.
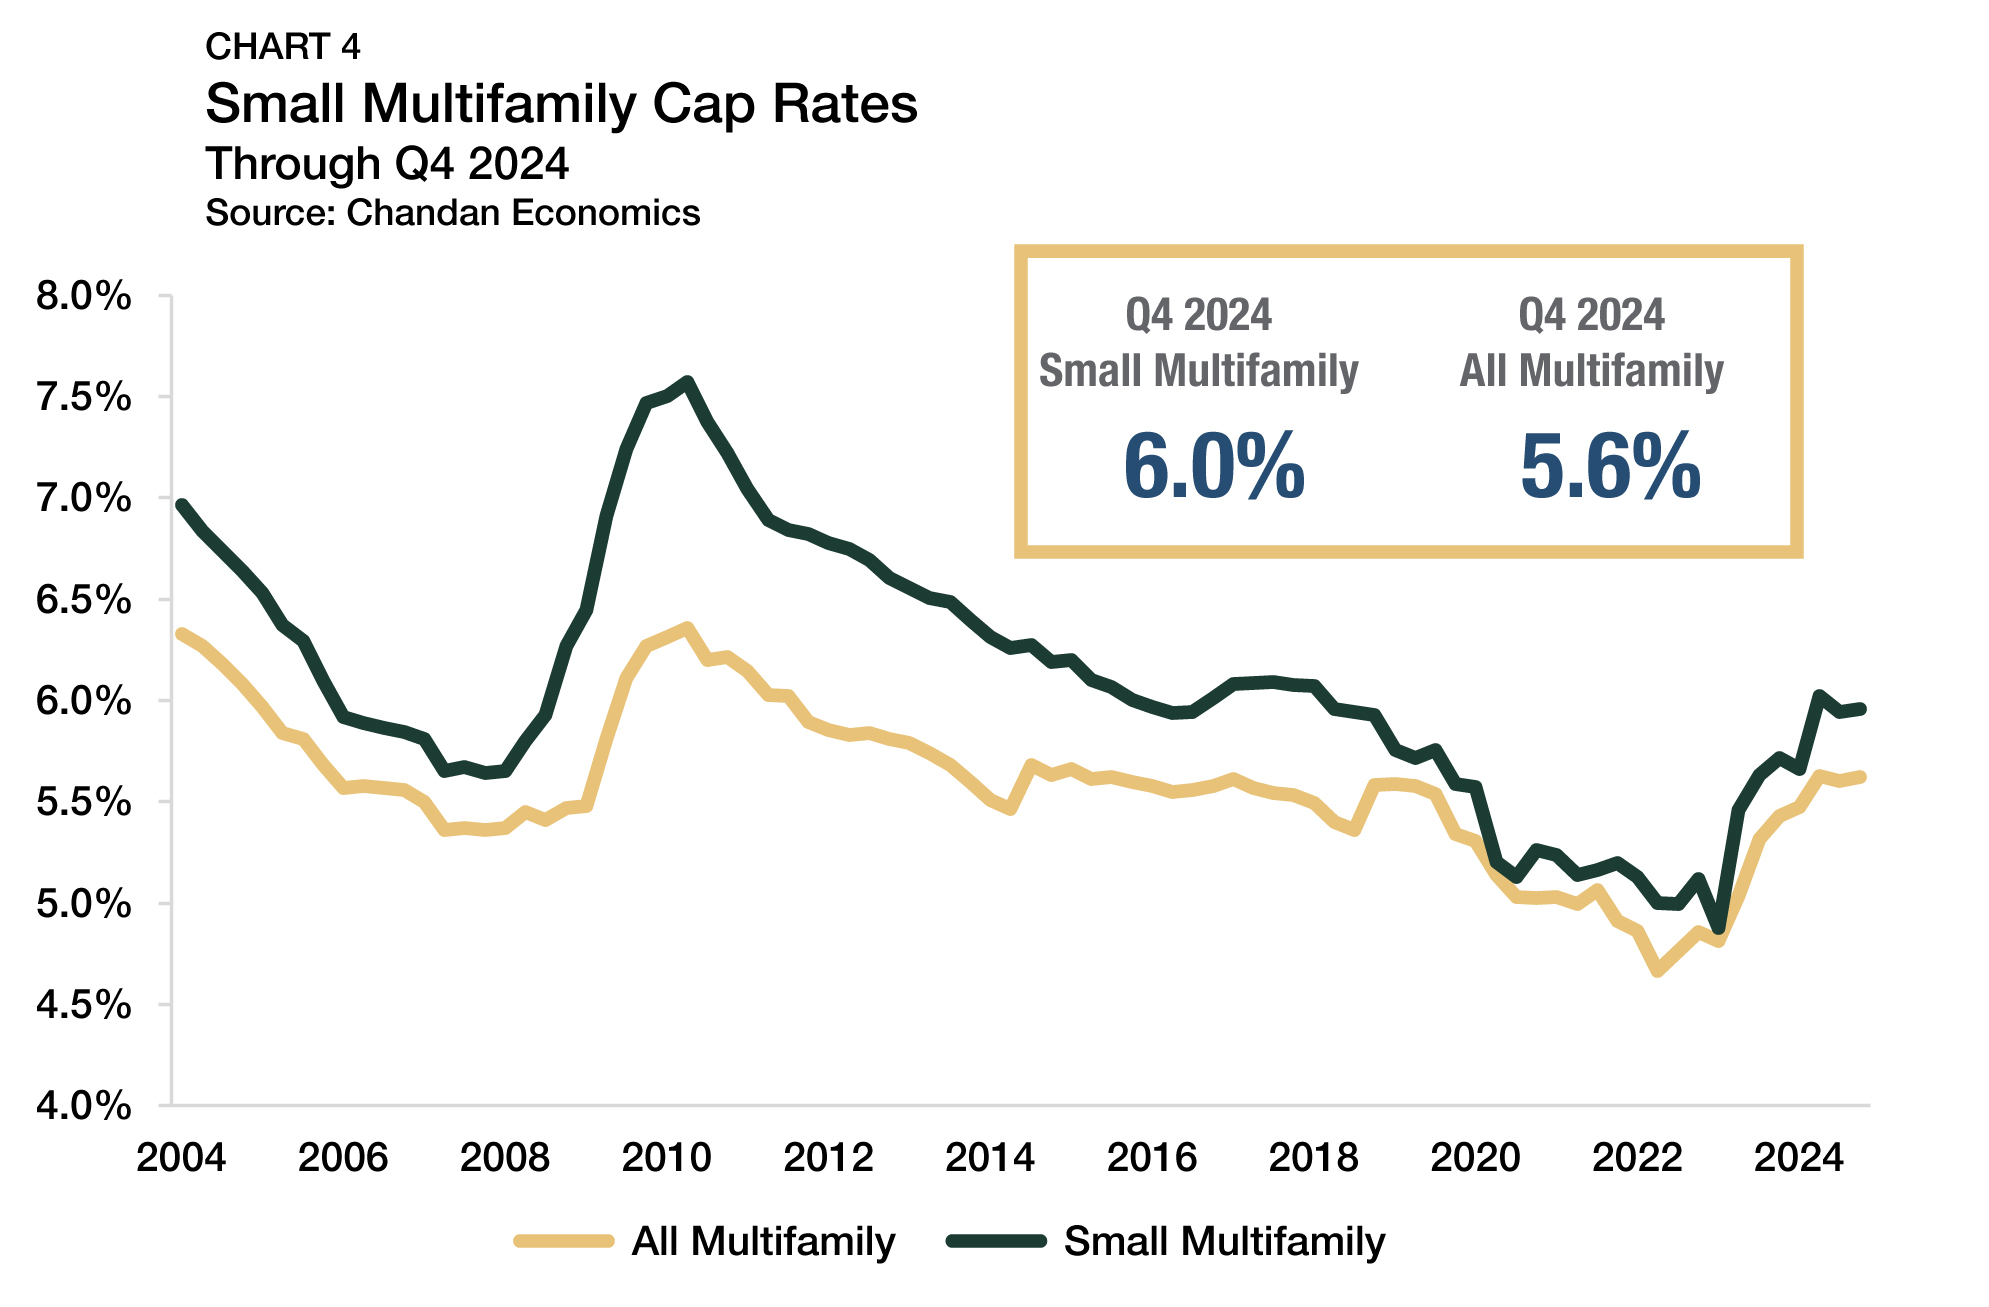
While elevated cap rates negatively weighed on asset valuations in recent quarters, they also improved the return profile of small multifamily properties for prospective investors.
The small multifamily risk premium, measured by comparing cap rates to the yield on the 10-year Treasury, approximates the additional compensation that investors require to account for higher levels of risk. This risk premium compressed by 32 bps in the fourth quarter of 2024 to reach 168 bps (Chart 5). The drop-off occurred as 10-year Treasury yields averaged 4.3% between October and December 2024, jumping from 4.0% in the third quarter.
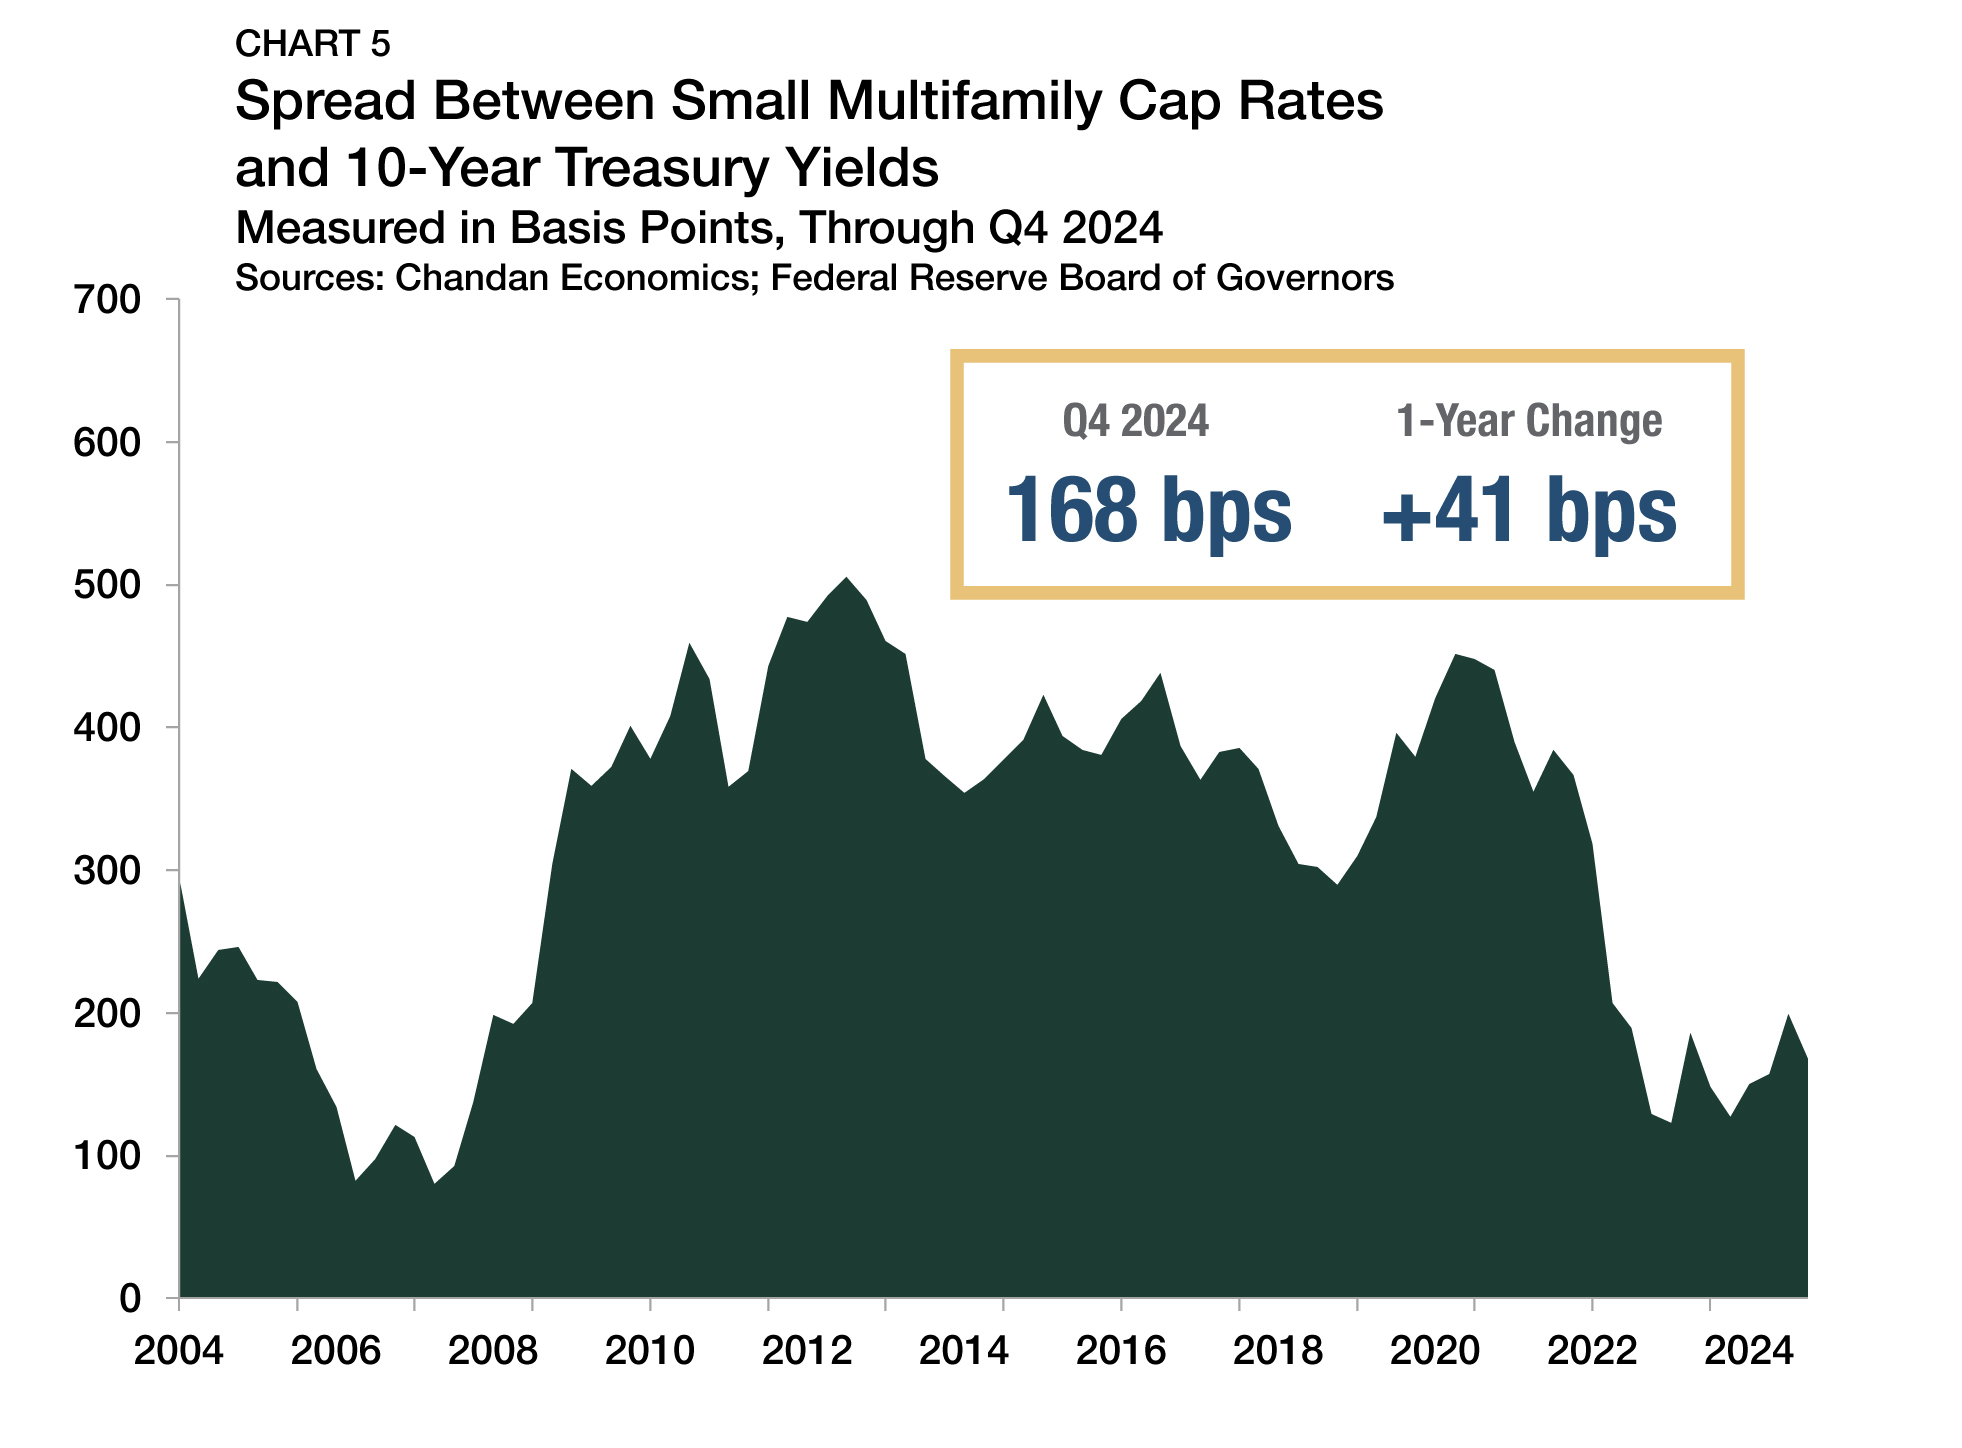
As long-term government bond yields jumped, any momentum towards re-establishing an equilibrium risk premium more in line with pre-pandemic trends was short-lived. Between 2015 and 2019, the small multifamily risk premium averaged 369 bps — more than double the current spread. Moreover, the small multifamily/Treasury risk premium sat below 200 bps for the past 10 consecutive quarters.
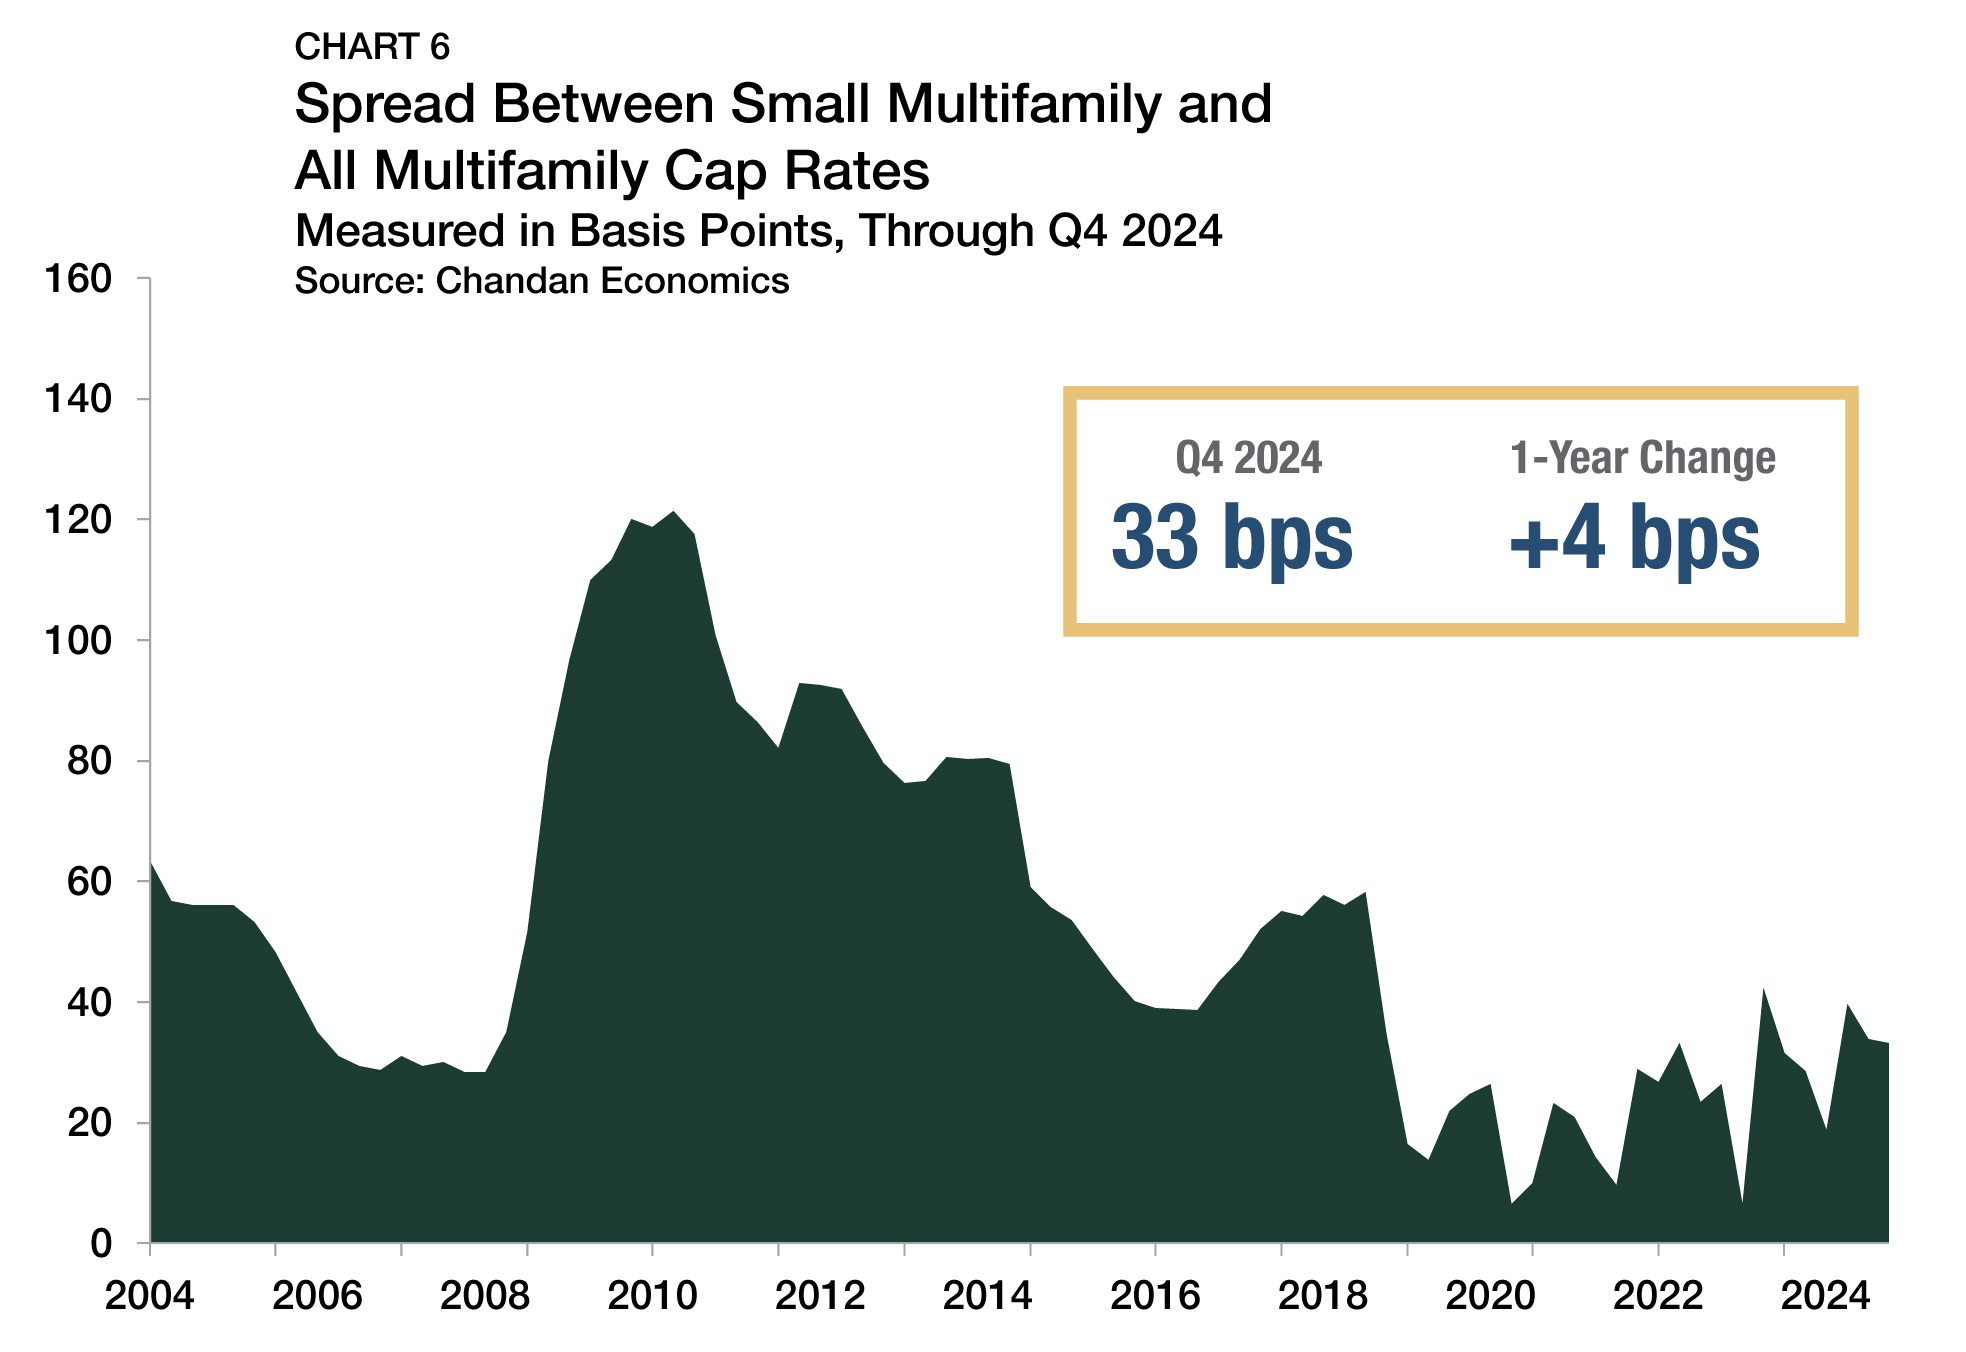
At the same time, the cap rate spread between small multifamily assets and the rest of the multifamily sector, a measure of the risk unique to smaller properties, decreased by a single basis point during the fourth quarter to reach 33 bps (Chart 6). This risk premium averaged a comparable 42 bps over the five years preceding the pandemic, signaling that perceptions of the comparative riskiness of small assets have generally held stable.
Expense Ratios
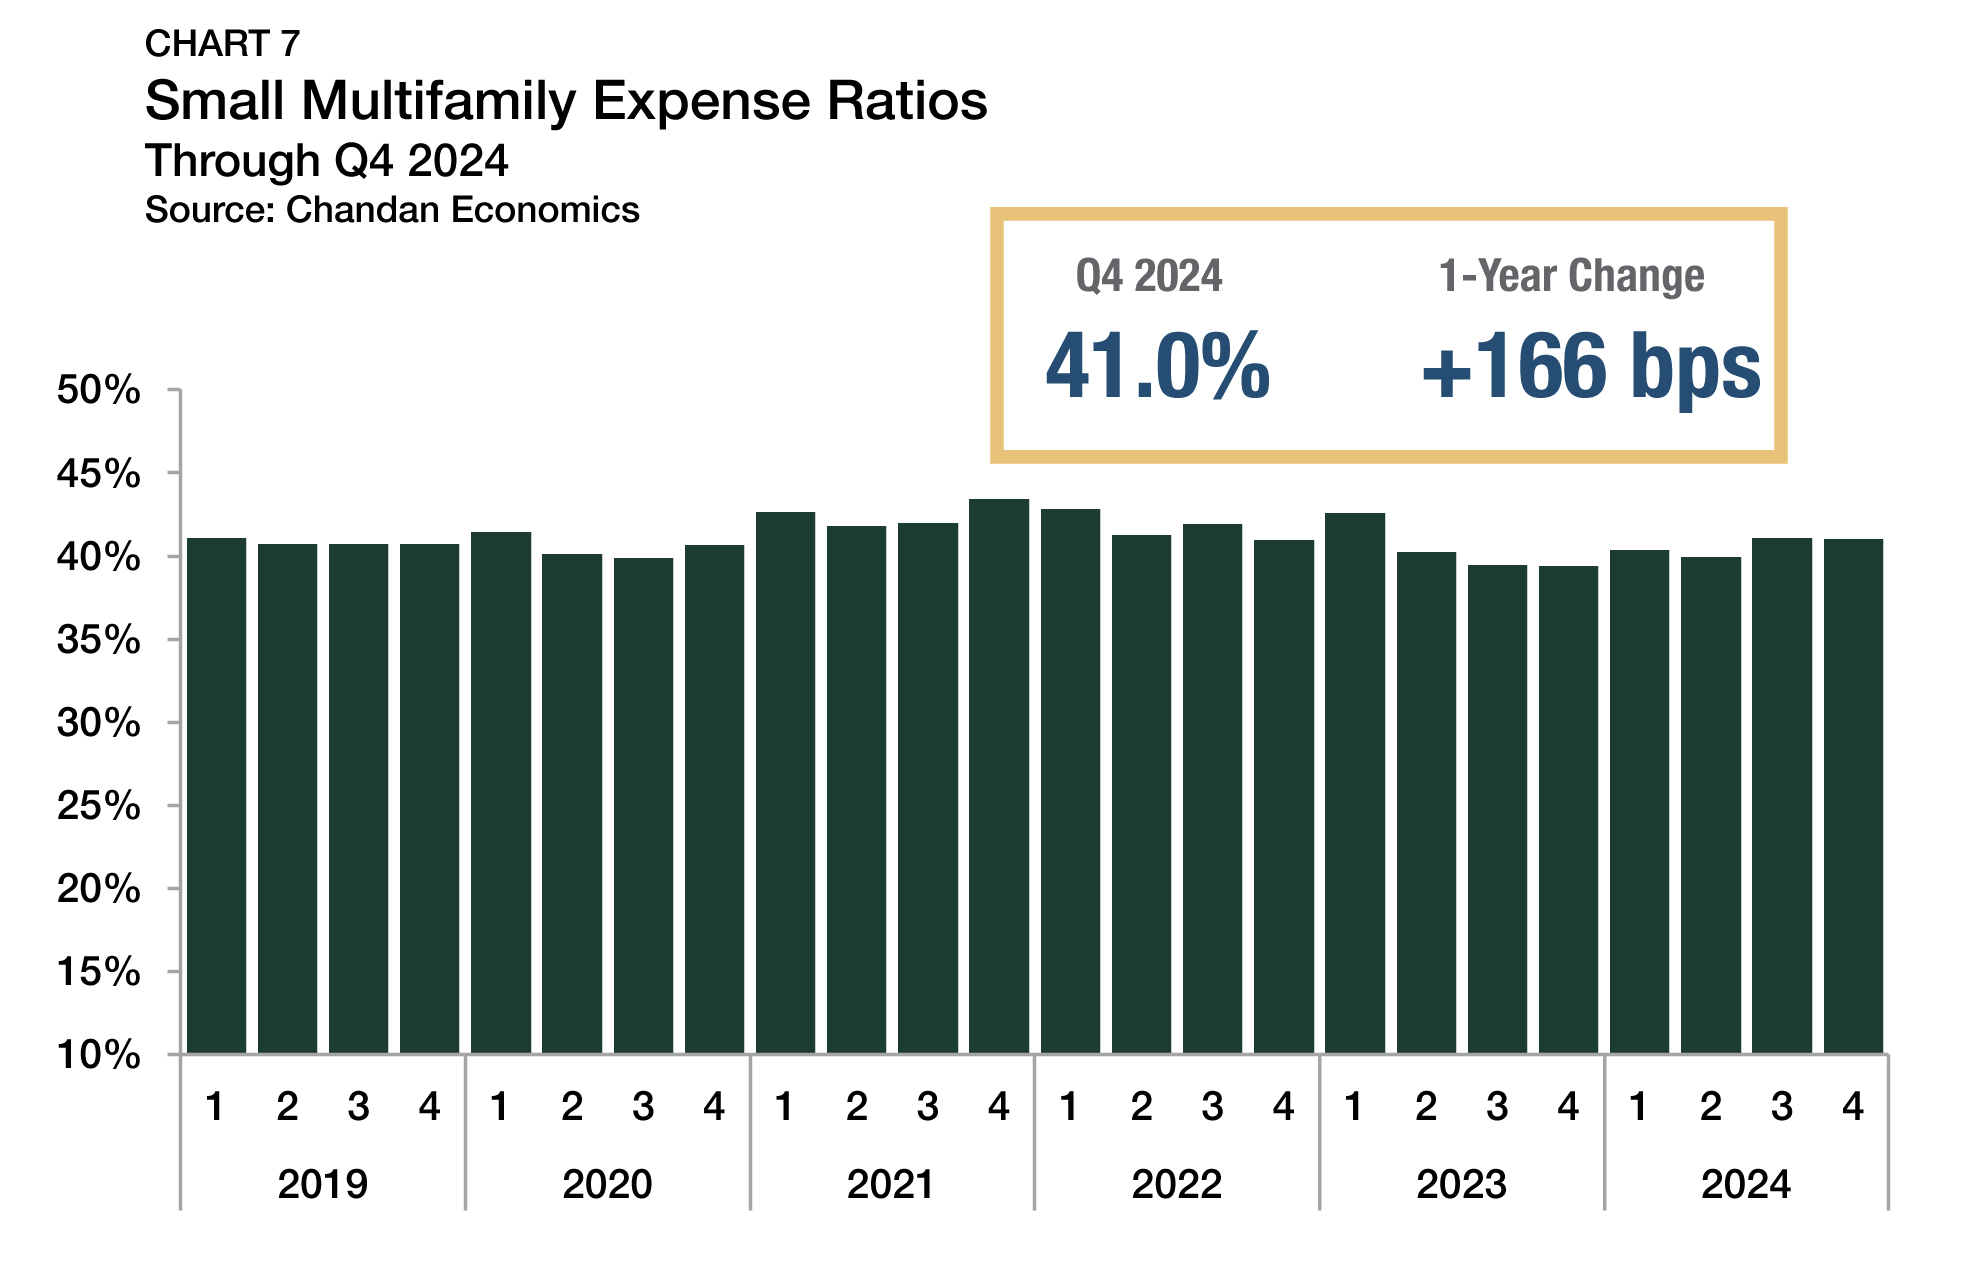
Expense ratios, measured as the relationship between underwritten property-level expenses and gross income, dropped by a marginal six bps in the fourth quarter of 2024, falling to 41.0% (Chart 7). Compared to a year earlier, expense ratios were up by 166 bps. While the annual change was not insignificant, the prevailing expense ratio was still well in line with recent norms. From 2019 through 2024, expense ratios ranged from a low of 39.4% to a high of 43.4%, averaging 41.1% over that time.
Occupancy Rates
Occupancy rates within small multifamily properties that received financing during the fourth quarter averaged 97.5% (Chart 8). After occupancy rates slid through 2023 and into early 2024, there was an encouraging turnaround over the past three quarters, as occupancy rates jumped by an average of 86 bps between the first and fourth quarters of the year.
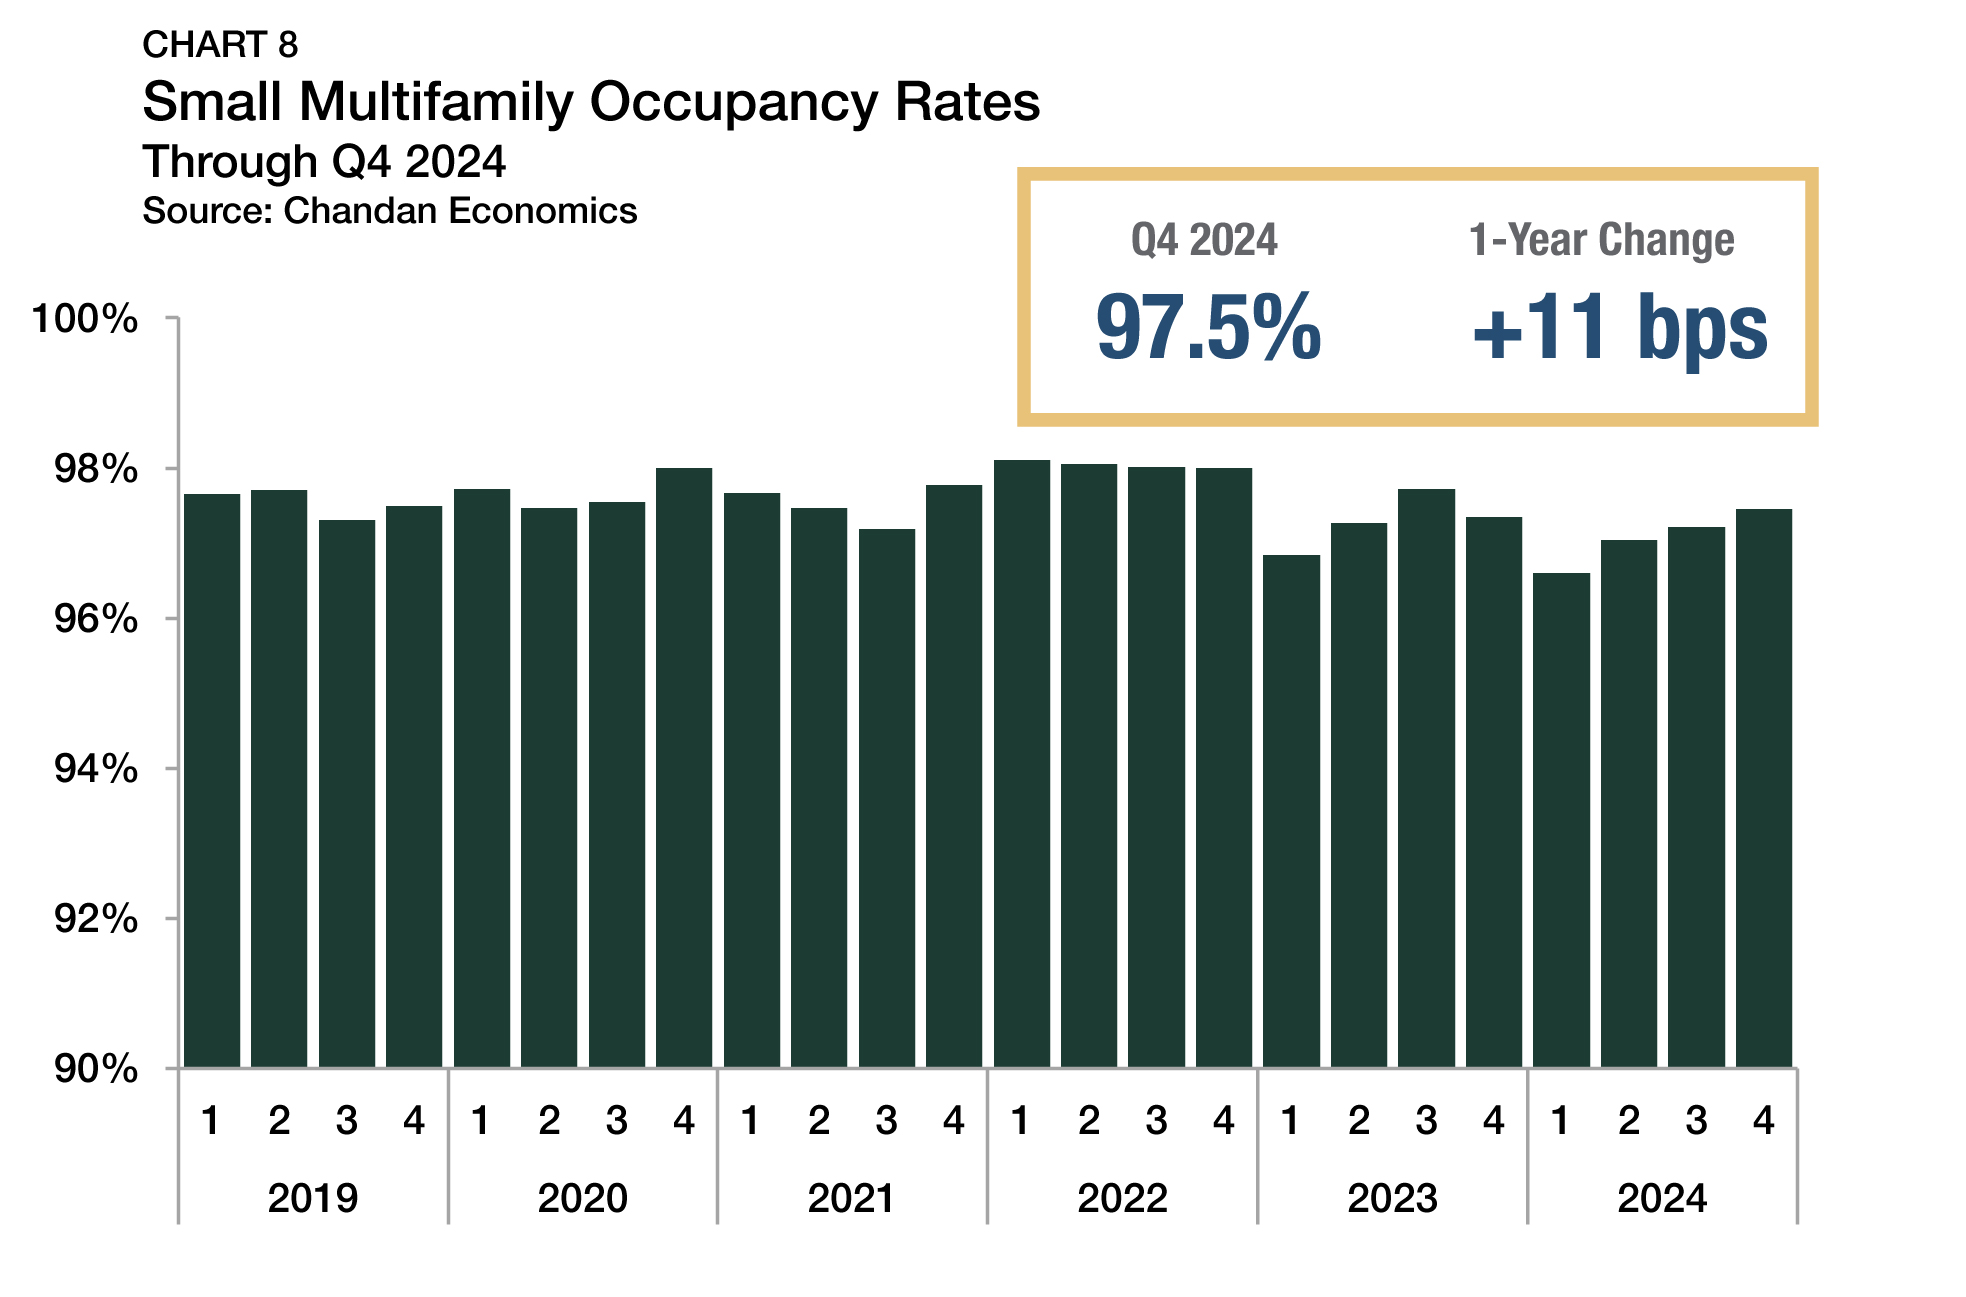
Small multifamily occupancy rates routinely outperform the rest of the multifamily sector, tracking about 2% higher than the average set across all multifamily properties, which may result from closer tenant-landlord relationships in small buildings. According to a recent report by the Terner Center for Housing Innovation at UC Berkeley, a majority of small multifamily property owners reported that at least half of their rental units were being leased at below-market-rate rents, primarily to retain quality tenants. By and large, small multifamily households are moving less. A recent Chandan Economics analysis of the U.S. Census Bureau’s American Community Survey found 58.3% of existing small multifamily households have remained in their current unit for two or more years — 3.4 percentage points higher than the share in large multifamily (50+ units) properties.
Leverage & Debt Yields
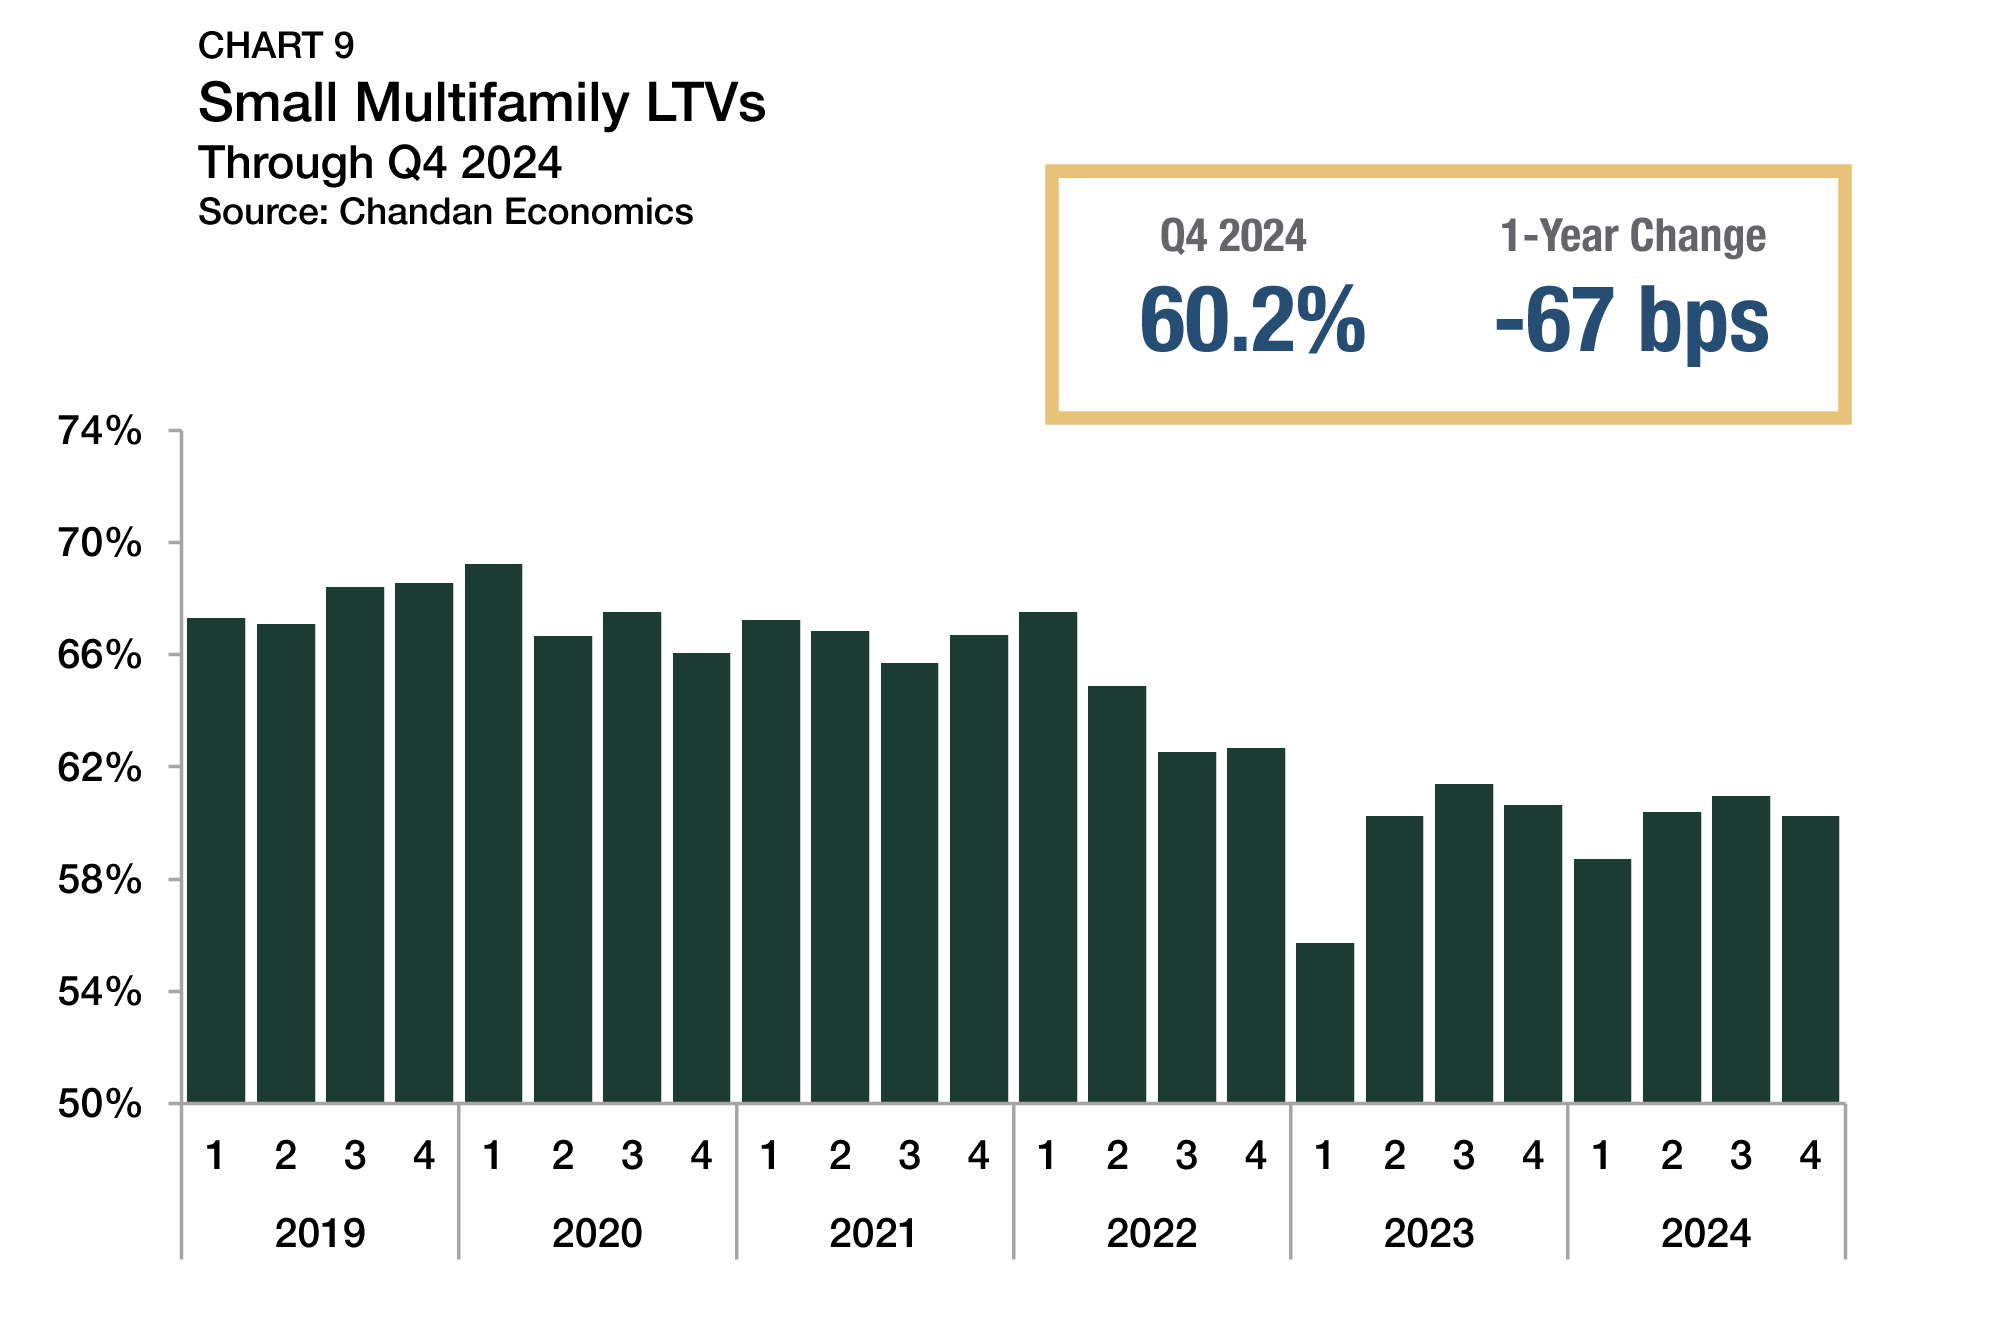
After debt underwriting standards loosened in the third quarter, rising bond yields in the fourth quarter caused lending criteria to tighten again. Loan-to-value ratios (LTVs) retreated to 60.2%, falling 70 bps between the third and fourth quarters (Chart 9). While the current small multifamily average sat 153 bps above its recent low of 58.7% in the first quarter of 2024, LTVs remained down by more than 700 bps compared to early 2022, underscoring a swift and sizeable shift in lending standards.
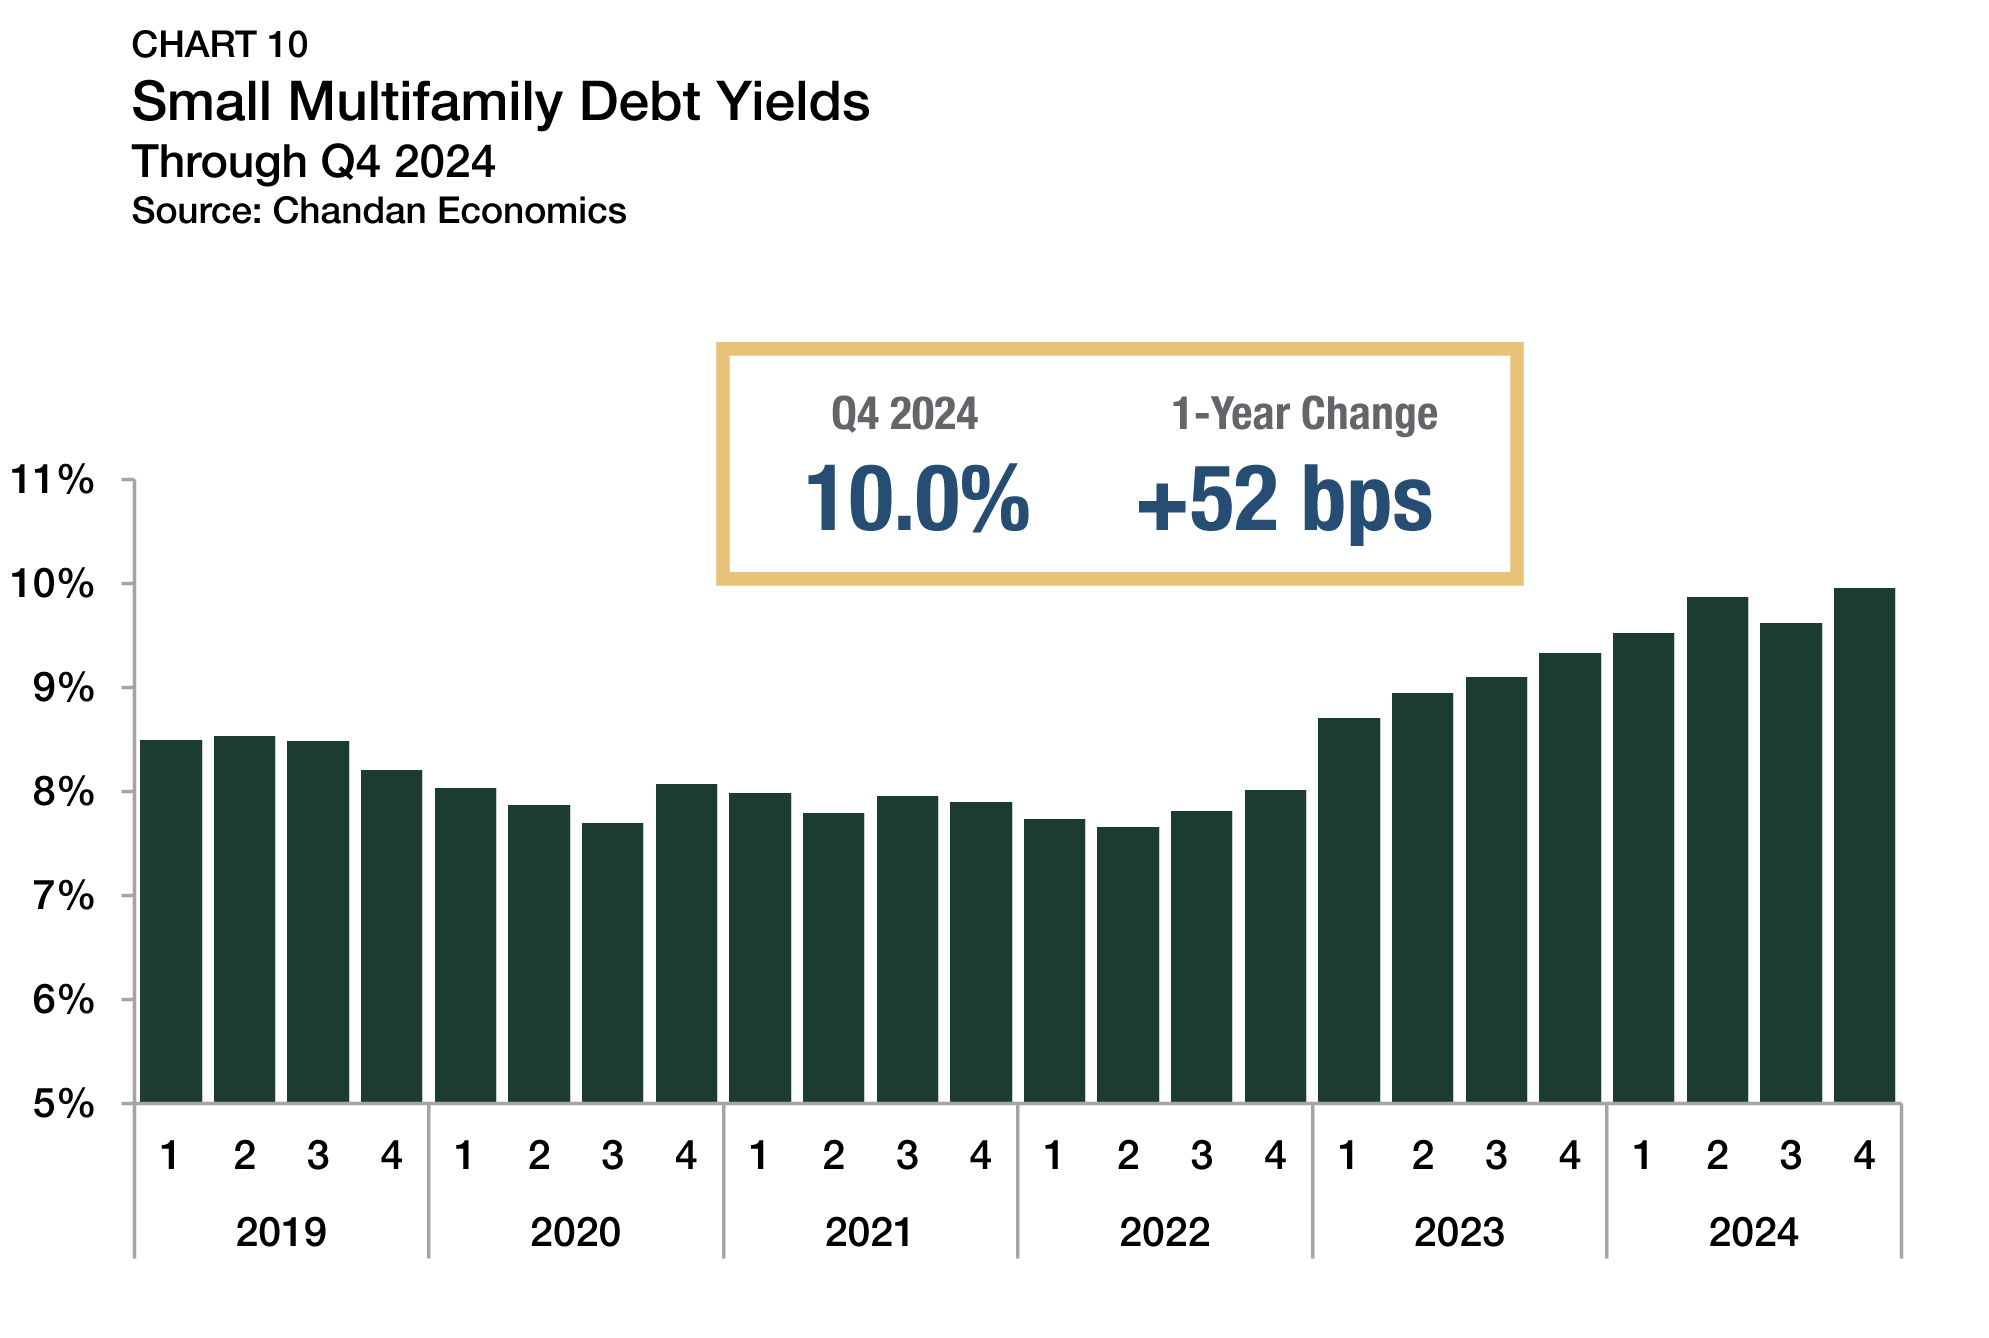
Along the same lines, average debt yields jumped higher in the fourth quarter, increasing by 34 bps and settling at 10.0% (Chart 10). Notably, the last time small multifamily debt yields eclipsed 10% was over a decade ago. The inverse of debt yields, debt per dollar of net operating income (NOI), fell for the ninth time in the past ten quarters. In the fourth quarter of 2024, small multifamily borrowers secured an average of $10.04 in new debt for every $1.00 of property NOI, down $0.35 from the previous quarter and $0.67 from the same time last year.
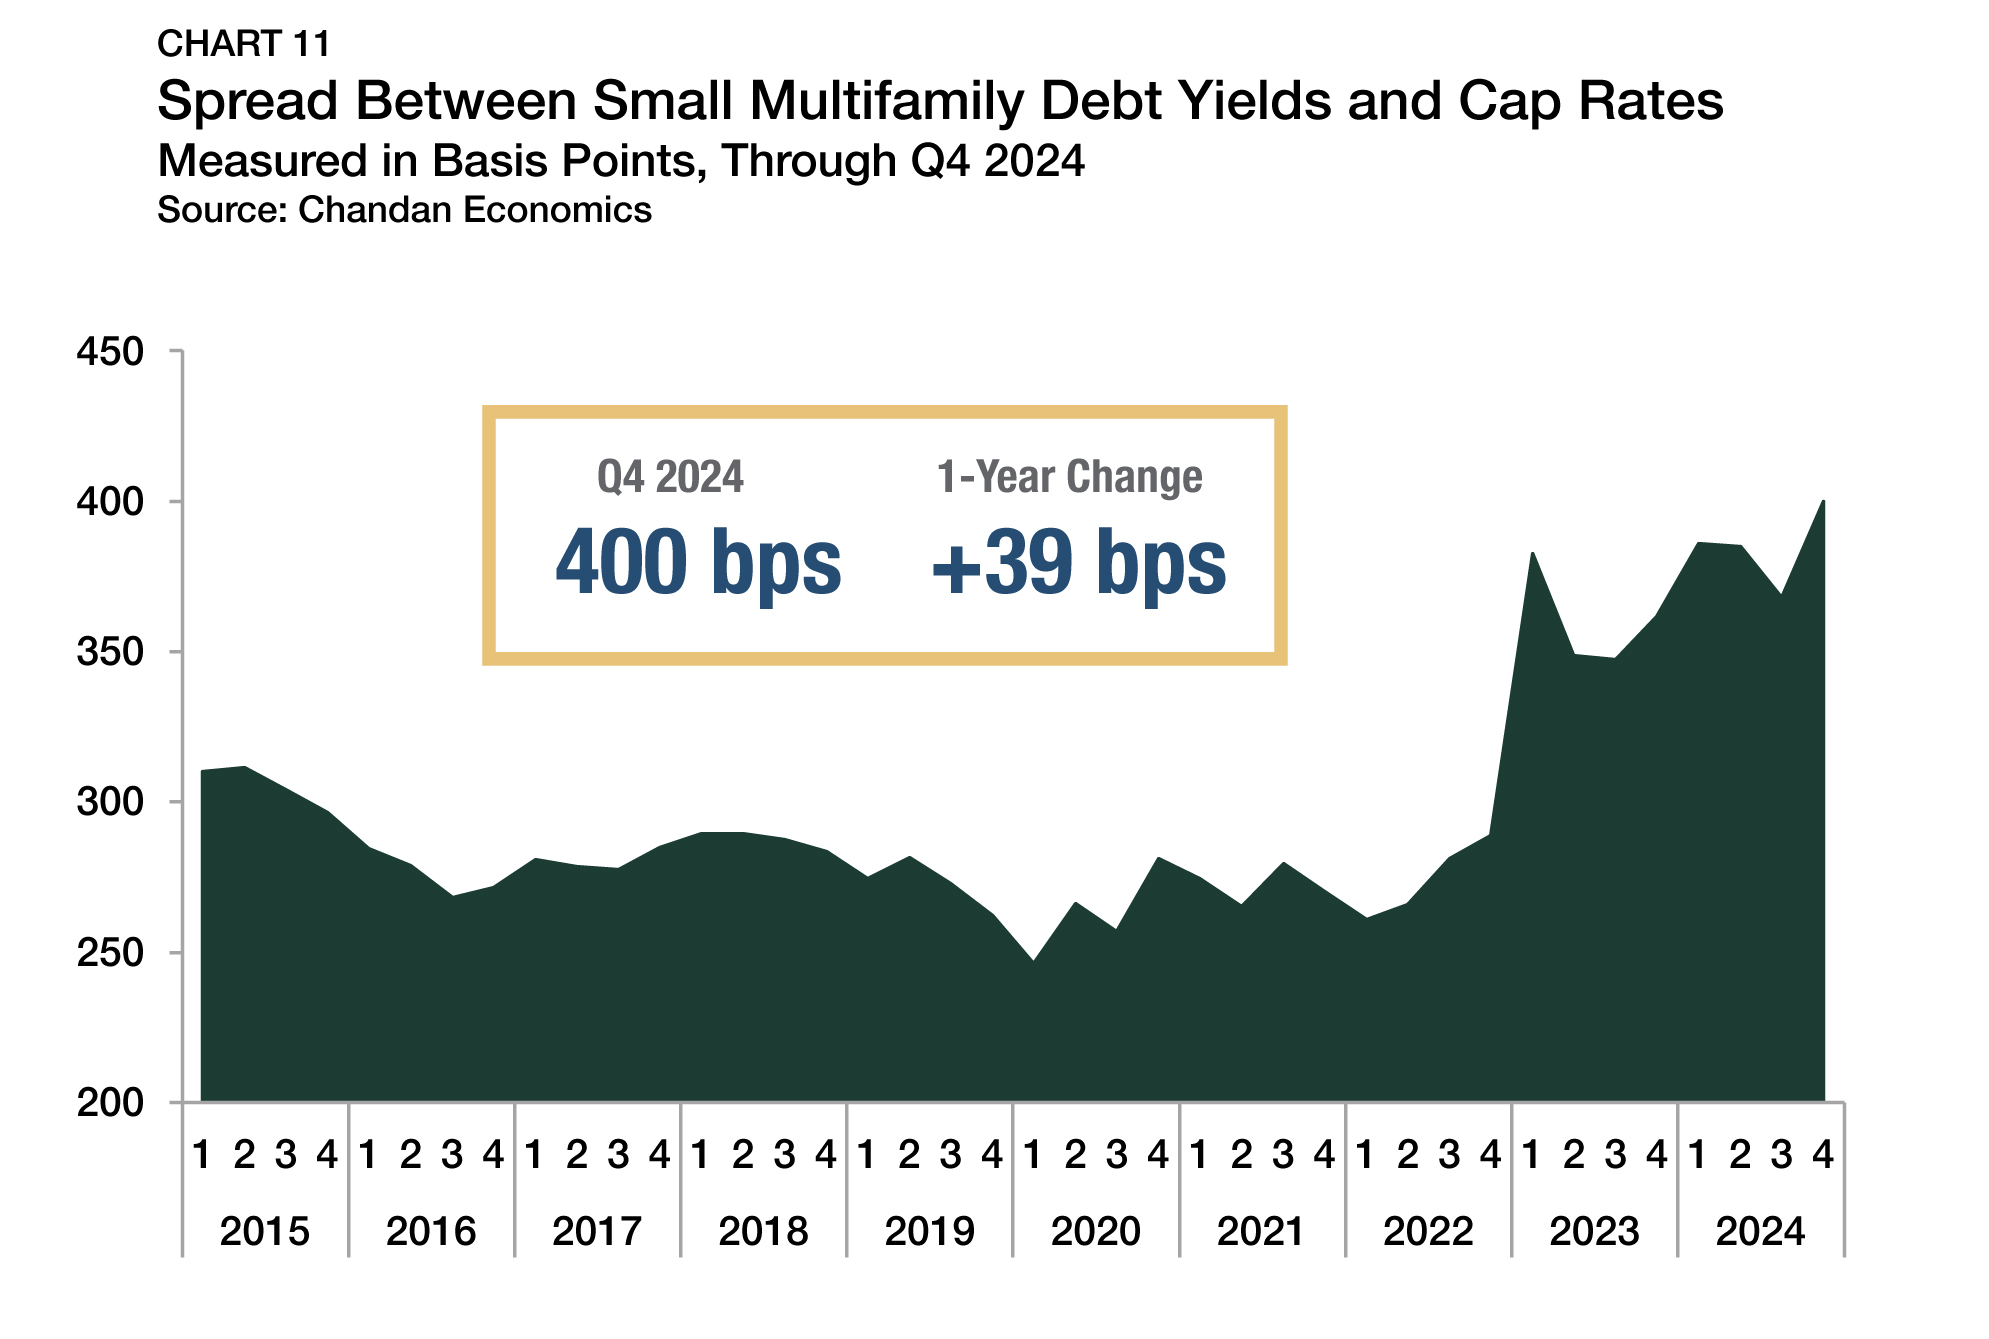
While cap rates and debt yields increased during the fourth quarter, debt yields rose substantially more. As a result, the spread between debt yields and cap rates grew to 400 bps (Chart 11). Between 2015 and 2019, the spread between debt yields and cap rates averaged 284 bps. Spreads have remained elevated since then, highlighting that lenders became more risk-averse over the past two years than buyers.
Outlook
Amid market constraints, the small multifamily sector performed solidly in 2024. Despite headwinds from record levels of new supply and resurgent capital costs, property level incomes, valuations, and occupancy rates all showed improvement.
The notion that reductions in the federal funds rate would pull down long-term interest rates through 2024 and into 2025 could have been overly optimistic. As a result, small multifamily investors may have to adjust to an economic environment with higher-for-longer interest rates.
Despite ongoing challenges, the sector’s comparative stability should overpower headwinds in the short term and place small multifamily in a position to build on its momentum when the economy as a whole settles into a new cycle.
For more small multifamily research and insights, visit arbor.com/articles
Disclaimer
This report is intended for general guidance and information purposes only. This report is under no circumstances intended to be used or considered as financial or investment advice, a recommendation or an offer to sell, or a solicitation of any offer to buy any securities or other form of financial asset. Please note that this is not an offer document. The report is not to be considered as investment research or an objective or independent explanation of the matters contained herein and is not prepared in accordance with the regulation regarding investment analysis. The material in the report is obtained from various sources per dating of the report. We have taken reasonable care to ensure that, and to the best of our knowledge, material information contained herein is in accordance with the facts and contains no omission likely to affect its understanding. That said, all content is provided herein “as is” and neither Arbor Realty Trust, Inc. or Chandan Economics, LLC (“the Companies”) nor their affiliated or related entities, nor any person involved in the creation, production and distribution of the content make any warranties, express or implied. The Companies do not make any representations or warranties, express or implied, as to the reliability, usefulness, completeness, accuracy, currency nor represent that use of any information provided herein would not infringe on other third-party rights. The Companies shall not be liable for any direct, indirect or consequential damages to the reader or a third party arising from the use of the information contained herein. There may have been changes in matters which affect the content contained herein and/or the Companies subsequent to the date of this report. Neither the issue nor delivery of this report shall under any circumstance create any implication that the information contained herein is correct as of any time subsequent to the date hereof or that the affairs of the Companies have not since changed. The Companies do not intend, and do not assume any obligation to update or correct the information included in this report. The contents of this report are not to be construed as legal, business, investment or tax advice. Each recipient should consult with its legal, business, investment and tax advisors as to legal, business, investment and tax advice. The information contained herein may be subject to changes without prior notice. This report is only intended for the recipients, and should not be copied or otherwise distributed, in whole or in part, to any other person.