In today’s constantly evolving market environment, partnering with a lender that can balance prioritizing speed of execution with tailored solutions makes all the difference in securing the financing you need. Arbor’s experience, expertise, and innovation, combined with our willingness to understand each deal and work to make it successful, set us apart from other multifamily lenders. In our more than three decades of closing deals, we’ve found that having these 10 items on hand at the beginning of your borrowing journey helps prevent roadblocks and streamlines the entire financing process.
Small Multifamily Investment Trends Report Q3 2023
Higher Interest Rates Drive Cap Rates Up as Cash Flows Remain Robust
Key Findings
- Small multifamily prices fell 3.2% quarter-over-quarter.
- Cap rates climbed 33 bps between the first and second quarters of 2023, the largest single-period jump since 2009.
- Property-level cash flows remained healthy as rent collections were robust and expense ratios normalized.
State of the Market
Through the first half of 2023, capital market realities continued testing the resiliency of the small multifamily subsector. More than a year after the Federal Reserve began its monetary tightening cycle, commercial real estate investors are still adjusting to the higher cost of capital. While market disruptions have weakened performance, the scope of the impact has remained limited.
According to Trepp, the delinquency rate of multifamily loans in CMBS transactions stands at 1.6% through June, which is the best mark of any commercial property type other than industrial. The recent trends seen in small asset classes are similar. According to Freddie Mac, 1.3% of small balance multifamily loans are nonperforming — an increase from the 0.7% measured in the summer of 2022 though still below the recent high of 1.7% seen in spring 2021. To place these figures in context, the multifamily nonperforming rate for loans on bank balance sheets reached 4.7% after the 2008 financial crisis, according to data reported by the FDIC.
This year, the rapid recalibration of risk and pricing of small multifamily assets has been widespread. But, as buyers and sellers navigate new challenges, bright spots have emerged. Amid a corrective environment, the operational profile of the small multifamily subsector has held strong, with rent collection trending higher and expense ratios normalizing. While macroeconomic headwinds may not recede soon, tenant dependability, the core strength of small multifamily, has proven to be a powerful antidote to financial market storms.
Lending Volume
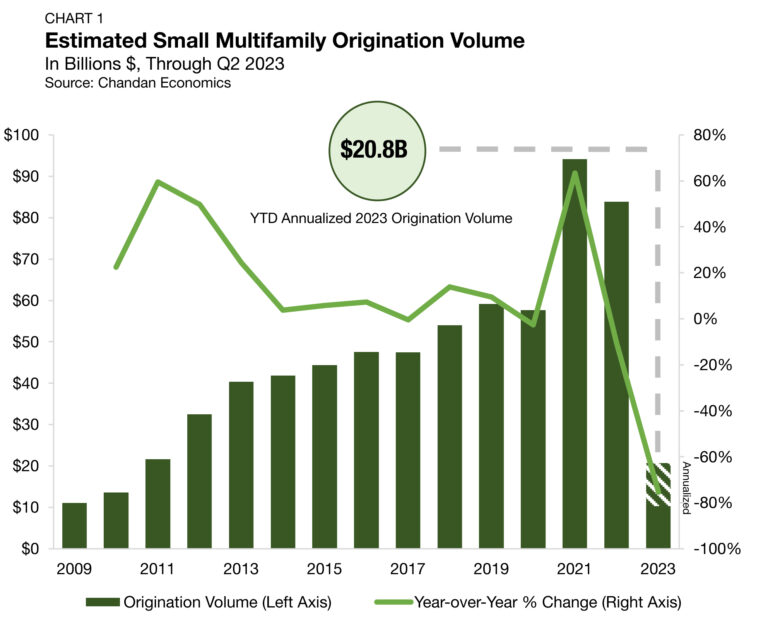
The $83.9 billion year-end 2022 estimate of new multifamily lending volume on loans with original balances between $1 million and $7.5 million1 — including loans for apartment building sales and refinancing — represented a modest 10.9% deceleration from 2021’s record high of $94.1 billion (Chart 1).
However, the annualized 2023 total illustrates a market that is starting to show renewed signs of movement. While the current 2023 estimate of $20.8 billion still represents the slowest pace since 2010, second quarter performance was a solid improvement on the first quarter’s reading of $15.5 billion.
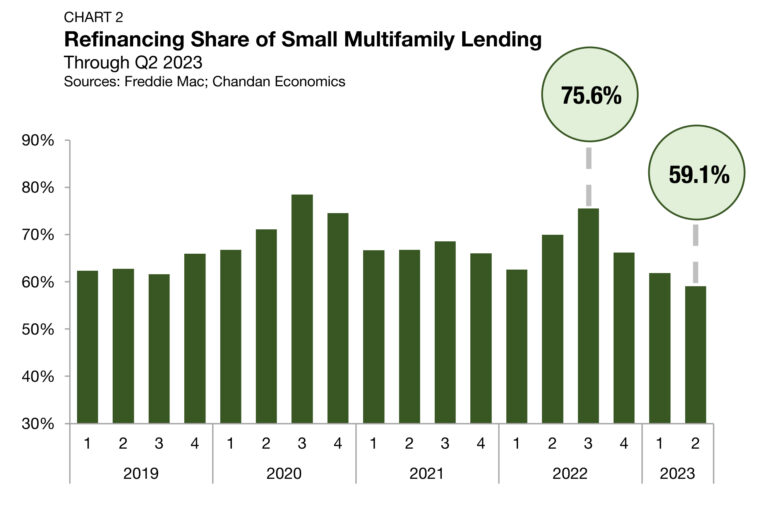
One significant factor contributing to the drop off in new small multifamily originations has been the reduced incentive for investors to pursue cash-out refinancing. When interest rates are favorable, borrowers often use accrued equity in their properties to finance subsequent acquisitions. However, in today’s higher-rate environment, a cash-out refinancing would likely result in a voluntary increase in debt servicing costs. As a result, refinancings remained slow in the second quarter of 2023, accounting for just 59.1% of tracked small multifamily originations— a total decrease of 16.5 percentage points over the previous three quarters (Chart 2).
Arbor Small Multifamily Price Index
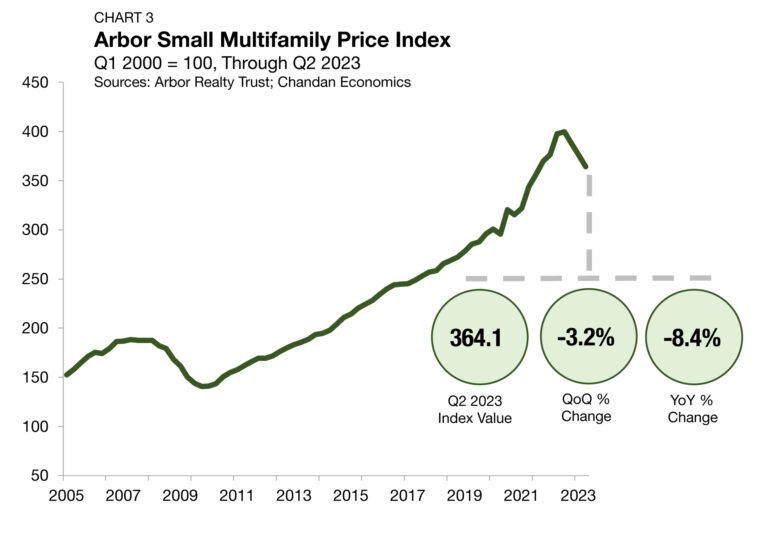
As measured by the Arbor Small Multifamily Price Index2, small multifamily asset valuations fell 3.2% quarter-over-quarter (Chart 3). Moreover, compared to the same time last year, prices were down 8.4%.
Negative pricing pressures are not unique to either multifamily or the small asset subsector in this interest rate environment. The higher cost of capital means that potential buyers of all property types have larger required yields. Data from recent quarters indicate that some seller capitulation is taking place, leading to higher cap rates and a softening of prices.
Cap Rates & Spreads
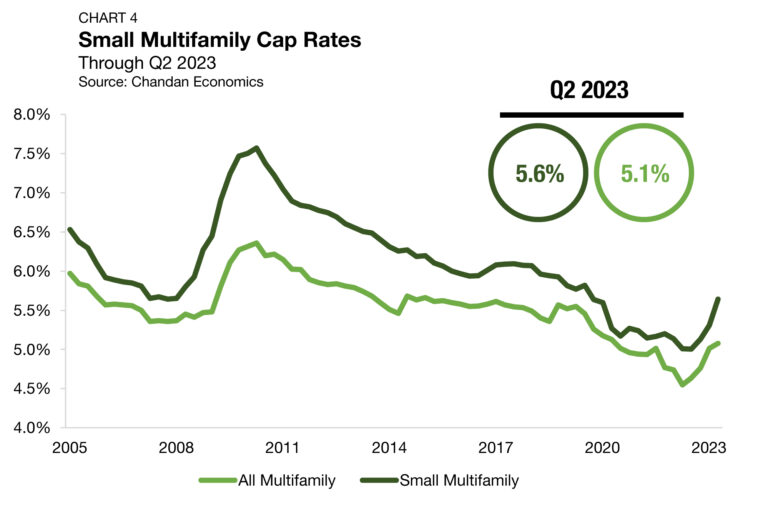
As 10-year Treasury yields continue holding at their highest levels in over a decade, cap rates across all commercial property types, including multifamily and the small asset subsector, have been rising. In the second quarter of 2023, small multifamily cap rates averaged 5.6%, reaching their highest point since mid-2019. After cap rates in this subsector reached their all-time low of 5.0% in the third quarter of 2022, they have subsequently risen in three consecutive quarters — and by a growing magnitude in each observation. Small multifamily cap rates jumped 33 bps between the first and second quarters of 2023, marking the largest single-period jump since 2009 (Chart 4).
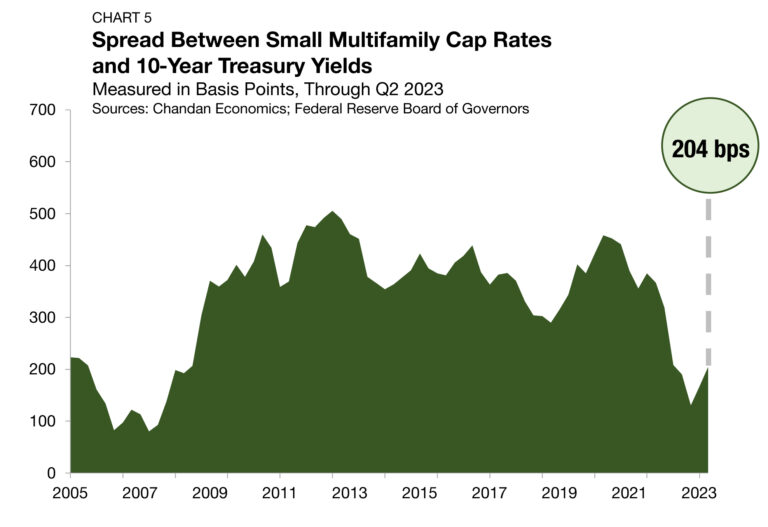
The small multifamily risk premium, which is best measured by comparing cap rates to the yield on the 10-year Treasury, is a measurement of additional compensation that investors require to account for higher levels of risk. This risk premium rose again in the second quarter of 2023, jumping to 204 bps (Chart 5).
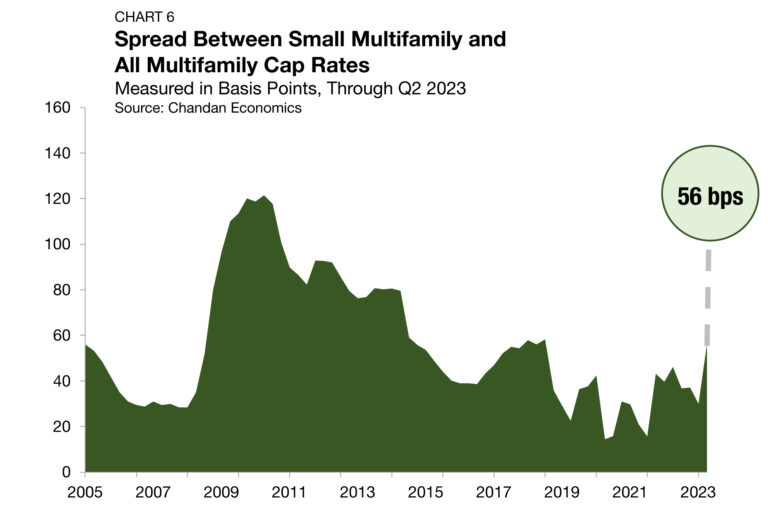
Between 2016 and 2021, the small multifamily risk premium averaged 372 bps and never fell below 290 bps or rose above 441 bps. These fluctuations happened as financial and real estate markets felt the ripple effects of higher interest rates. The risk premium fell as low as 130 bps in the fourth quarter of 2022 — its lowest level on record. As a result, recent premium increases represent a normalization of risk pricing as the spreads move back toward historical averages. Meanwhile, the cap rate spread between small multifamily assets and the rest of the multifamily sector, a measure of the risk unique to smaller properties, rose 26 bps during the quarter to finish at 56 bps (Chart 6).
Expense Ratios
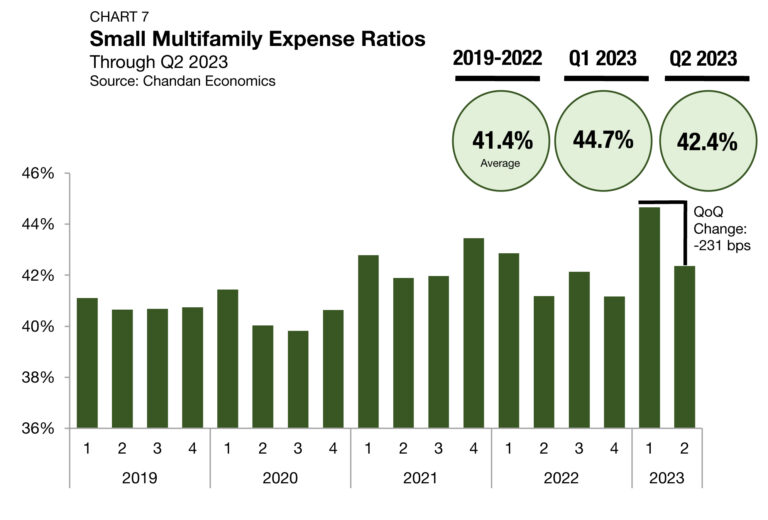
Expense ratios, measured as the relationship between underwritten property-level expenses and effective gross income, are showing signs of improvement. Driven by increases in vacancies and operating expenses, the small multifamily expense ratio surged to start the year, reaching 44.7% in the first quarter (Chart 7). However, during the second quarter, this expense ratio retreated 231 bps quarter-over-quarter to settle at 42.4%, close to its 2019-2022 average.
Rent Collections
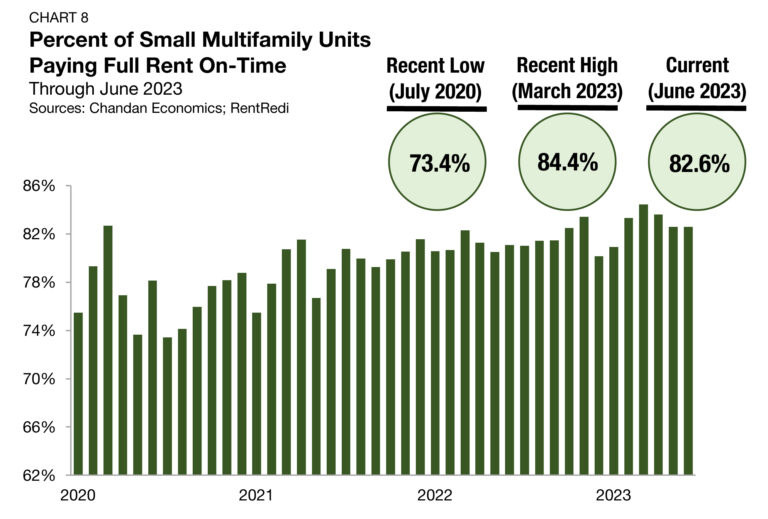
On-time rental payment rates in small multifamily properties have consistently been robust in recent months, according to Chandan Economics and RentRedi’s Independent Landlord Rental Performance Report. In June 2023, full rent was paid on time in an estimated 82.6% of units — improving 153 bps from the same time last year (Chart 8).
Thanks to a resilient labor market, tenants’ continued ability to make on-time rental payments continues to be one of the small multifamily subsector’s biggest assets. Even in a challenging economic environment, healthy property-level cash flows will likely continue to limit small multifamily property owners and lenders from experiencing distress.
Leverage & Debt Yields
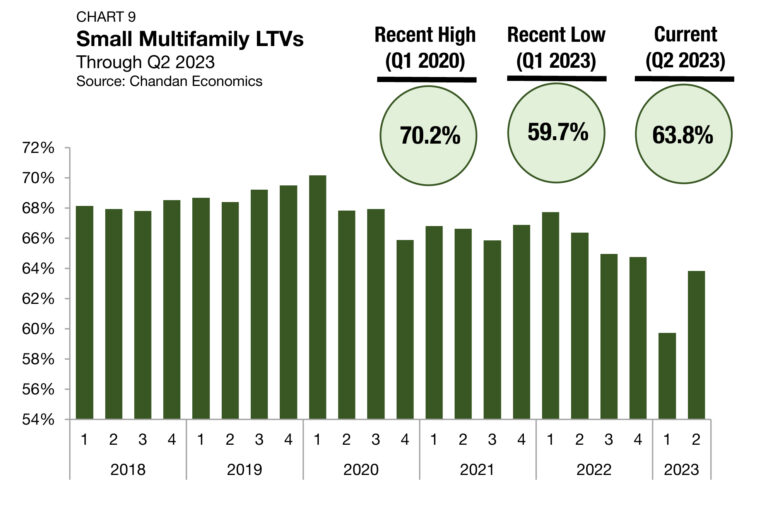
While signals are mixed, debt underwriting standards remained tight through the second quarter of this year. Loan-to-value ratios (LTVs) slid in four consecutive quarters through the first quarter of 2023. After a dramatic drop of 501 bps between the fourth quarter of 2022 and the first quarter of 2023, average small multifamily LTVs reached 59.7%. However, in the second quarter, LTVs bounced back to 63.8% (+409 bps). While the quarter-over-quarter improvement is significant and encouraging, current LTV levels remain historically low. Aside from the first quarter of 2023, which was an outlier due to low transaction activity, small multifamily LTVs were lower in the second quarter than at any point since 2013 (Chart 9).
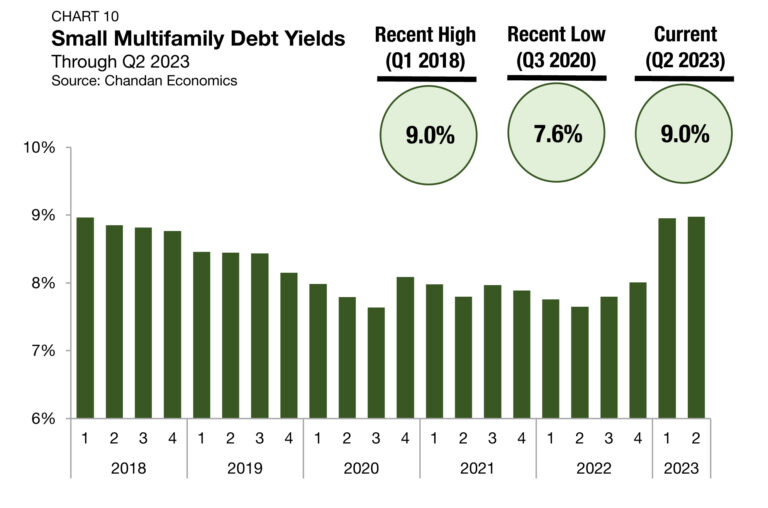
Average debt yields for small multifamily loans remained at 9.0% in the second quarter of 2023 (Chart 10). After debt yields jumped by 95 bps in the first quarter — the largest quarterly jump in 15 years — they edged 3 bps higher, demonstrating the effect of tight underwriting standards. The inverse of debt yields, the debt per dollar of net operating income (NOI), for small multifamily loans fell slightly. Small multifamily borrowers secured an average of $11.14 in new debt for every $1.00 of property NOI, down $0.03 from the previous quarter and the lowest level since 2015.
Outlook
Like all commercial real estate asset classes, the small multifamily market will continue to be challenged over the next several months. While the Federal Reserve signaled it is near the end of its monetary tightening cycle, interest rate normalization is likely to take time. Looking a year ahead, there is a greater than 65% chance the federal funds rate will sit higher than 450 bps in July 2024, according to the CME Group’s FedWatch tool. Given the interest rate outlook, Fannie Mae forecasts that multifamily cap rates will continue rising through the rest of 2023 and into early 2024. At the same time, it forecasts that net operating growth will remain positive for the foreseeable future — underscoring the present decoupling of asset-level operations and financial market conditions. If all things remain equal, negative pricing pressures are unlikely to abate through the second half of the year. Still, small multifamily, strengthened by its healthy property-level cash flows, remains well-equipped to overcome macroeconomic headwinds.
1 All data, unless otherwise stated, are based on Chandan Economics’ analysis of a limited pool of loans with original balances of $1 million to $7.5 million and loan-to-value ratios above 50%.
2 The Arbor Small Multifamily Price Index (ASMPI) uses model estimates of small multifamily rents and compares them against small multifamily cap rates. The index measures the estimated average price appreciation on small multifamily properties with 5 to 50 units and primary mortgages of $1 million to $7.5 million. For the full methodology, visit arbor.com/asmpi-faq.
For more small multifamily research and insights, visit arbor.com/articles
Disclaimer
All content is provided herein “as is” and neither Arbor Realty Trust, Inc. or Chandan Economics, LLC (“the Companies”) nor their affiliated or related entities, nor any person involved in the creation, production and distribution of the content make any warranties, express or implied. The Companies do not make any representations regarding the reliability, usefulness, completeness, accuracy, currency nor represent that use of any information provided herein would not infringe on other third party rights. The Companies shall not be liable for any direct, indirect or consequential damages to the reader or a third party arising from the use of the information contained herein.


