Normalization was the thread that tied together multifamily real estate narratives in 2025. Asset valuations stabilized, cap rates held steady, and rent growth was balanced. Entering the new year, normalization is still driving the conversation, as shown by newly released data from the Federal Reserve Bank of Atlanta on real estate conditions and associated trends.
Small Multifamily Investment Trends Report Q3 2024
Cap Rates Climb Again as Originations Begin Rebounding
Key Findings
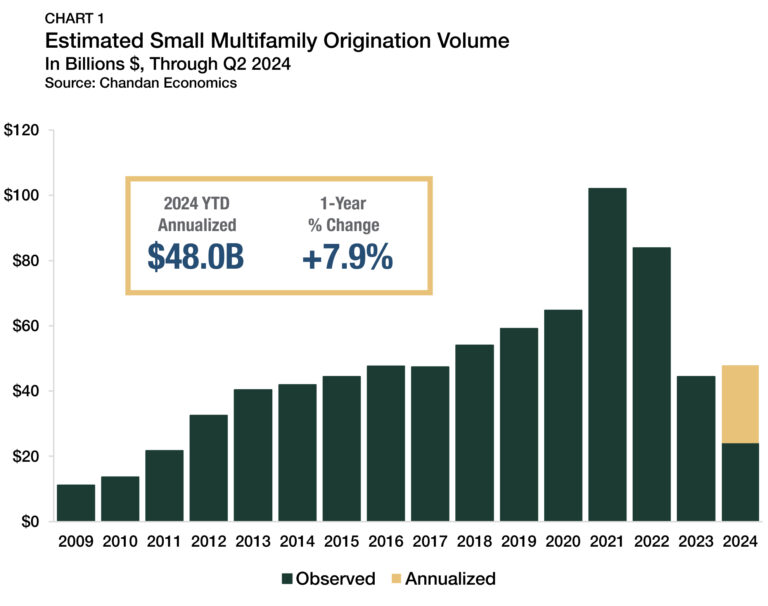
- Small multifamily originations were on pace for a modest 7.9% annual increase in 2024.
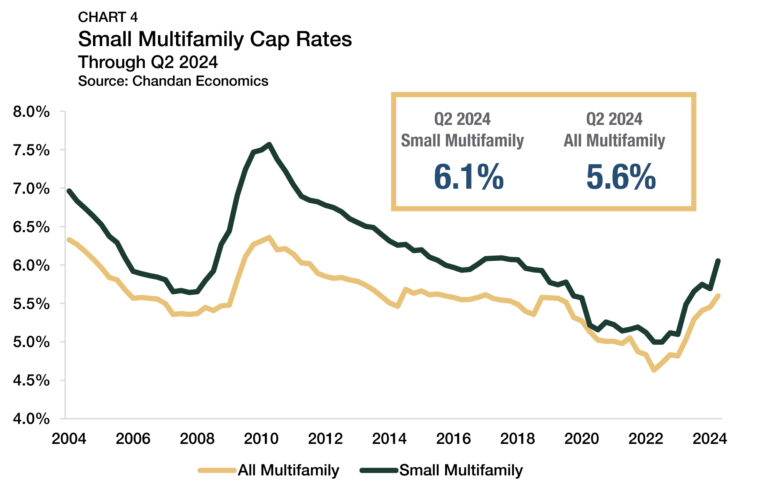
- Cap rates reversed a first-quarter decline, rising to 6.1%.
- Credit conditions remained conservative as debt yields rose to 9.9%.
State of the Market
Small multifamily continued to moderate through the midpoint of 2024, as strong demand and lending support from government-sponsored enterprises (GSEs) counterbalanced an elevated interest rate environment and rising property-level yields.
Although loan activity retreated slightly, distress has remained limited within the small multifamily subsector. According to Freddie Mac, 97.2% of its small balance multifamily loans were current through May 2024 — a decrease of about two percentage points from the end of 2022. The share of the outstanding loan balance that has either reached foreclosure or REO (real estate owned) was just 0.2%, signaling that lenders and borrowers are increasingly working together to cure non-performance.
While economic headwinds persist, more signs of a normalization underway have brightened the outlook for 2025 and beyond. The National Multifamily Housing Council’s (NMHC) most recent Quarterly Survey of Apartment Conditions shows a growing share of multifamily practitioners reported higher sales volume and improved borrowing conditions compared to the previous three-month period.
Multifamily originations have also recently shown signs of improvement. According to Freddie Mac’s 2024 Midyear Multifamily Outlook, they have now been projected to increase by a little more than 20% in 2024, provided monetary policy is loosened as expected this year. Already, small multifamily originations have seen a modest pickup in the first two quarters of the year, although uneven improvement can be expected for the remainder of 2024. Multifamily completions sit at a five-decade high, while rents increased 2.7% year-over-year through June 2024, signaling momentum is trending positive but has room to grow.
With a consensus of opinion building that the Federal Reserve will cut interest rates multiple times by year’s end, a macroeconomic inflection that would accelerate a normalization could be on the horizon.
Lending Volume
The $44.4 billion year-end 2023 estimate of new multifamily lending volume on loans with original balances between $1 million and $9 million1 — including loans for apartment building sales and refinancing — decelerated significantly from $83.9 billion in 2022 (Chart 1).
Thus far in 2024, originations appear to be stabilizing and rebounding modestly. Through the second quarter, small multifamily originations are on an annualized pace to reach $48.0 billion in 2024, an increase of 7.9% over last year’s volume.
Several factors have weighed down origination volumes in 2023 and 2024, including challenges brought on by high interest rates, sellers adjusting to the realities of lower asset valuations, and macroeconomic uncertainties. Additionally, loan extensions, a common feature of the current lending environment, have simultaneously suppressed both new originations and distress.
1 All data, unless otherwise stated, are based on Chandan Economics’ analysis of a limited pool of loans with original balances of $1 million to $9 million and loan-to-value ratios above 50%.
Loans by Purpose
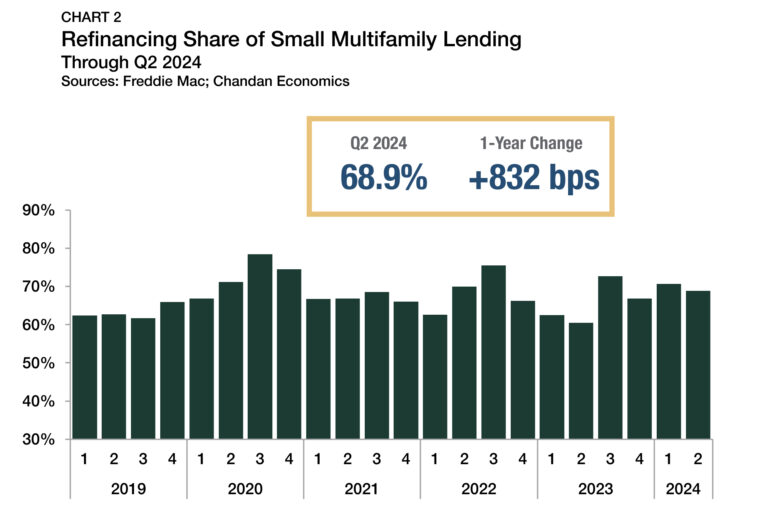
High interest rates have been reducing the incentive for investors to pursue cash-out refinancing. After hitting a high of 75.6% in the third quarter of 2022, the refinancing share of originations fell for three consecutive quarters, reaching a low of 60.5% in the second quarter of 2023 (Chart 2). However, the refinancing share of originations, which was 68.9% in the second quarter of 2024, has normalized over the past four quarters, ranging between 66.8% and 72.7%.
Arbor Small Multifamily Price Index
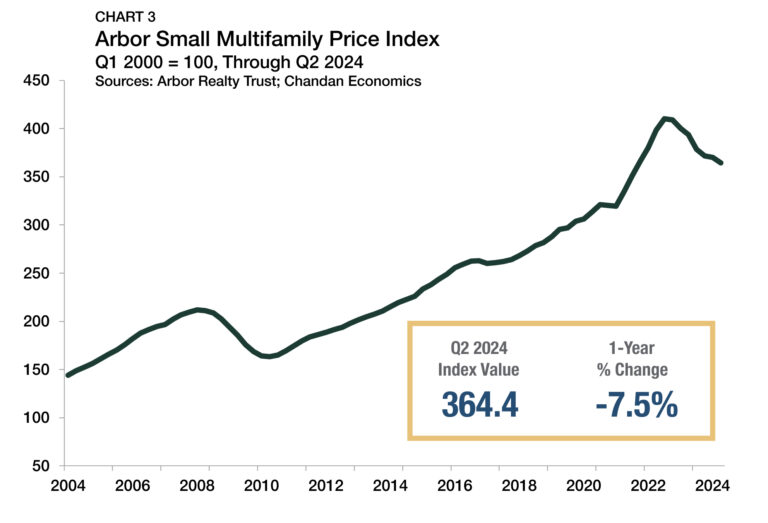
The Arbor Small Multifamily Price Index showed that asset valuations were down 1.5% year-over-year through the second quarter of 2024 and down 11.2% from their 2022 peak (Chart 3). The second-quarter price decline was driven entirely by rising cap rates — as operating incomes, expense ratios, and occupancy rates all improved within the sector. Despite these declines, valuations were about 19.0% higher than pre-pandemic levels.
Cap Rates & Spreads
In the second quarter of 2024, small multifamily cap rates averaged 6.1%, reversing the previous quarter’s declines (Chart 4) with an increase of 36 basis points (bps). After cap rates in the sector reached an all-time low of 5.0% in the third quarter of 2022, property-level yields increased in six of the following seven quarters, climbing a total of 105 bps during that time. The second quarter mark was the first time since 2018 that cap rates eclipsed 6.0%. Rising cap rates have been a double-edged sword for small multifamily. On the one hand, cap rate increases have negatively impacted asset valuations. At the same time, they have improved the return profile for prospective investors.
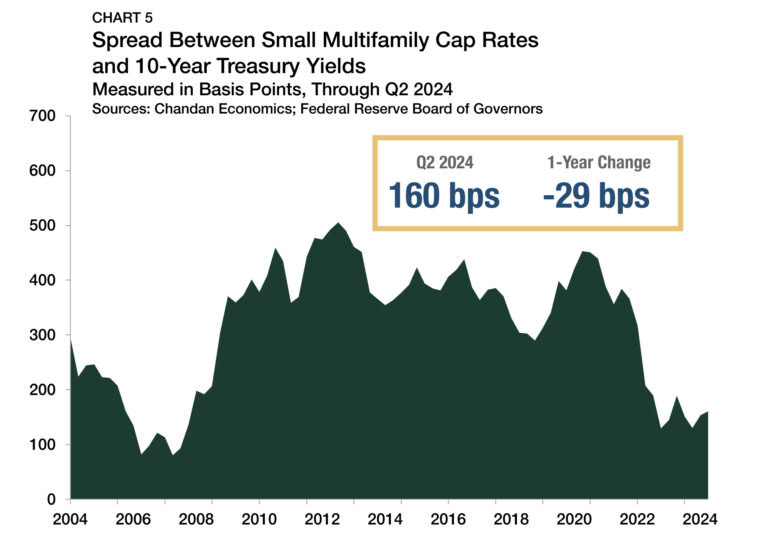
The small multifamily risk premium, best measured by comparing cap rates to the yield on the 10-year Treasury, approximates the additional compensation that investors require to account for higher levels of risk. This risk premium widened by a marginal seven bps in the second quarter of 2024 to reach 160 bps (Chart 5). The increase arrived as 10-year Treasury yields averaged 4.5% between April and June — up from 4.2% in the first quarter of the year.
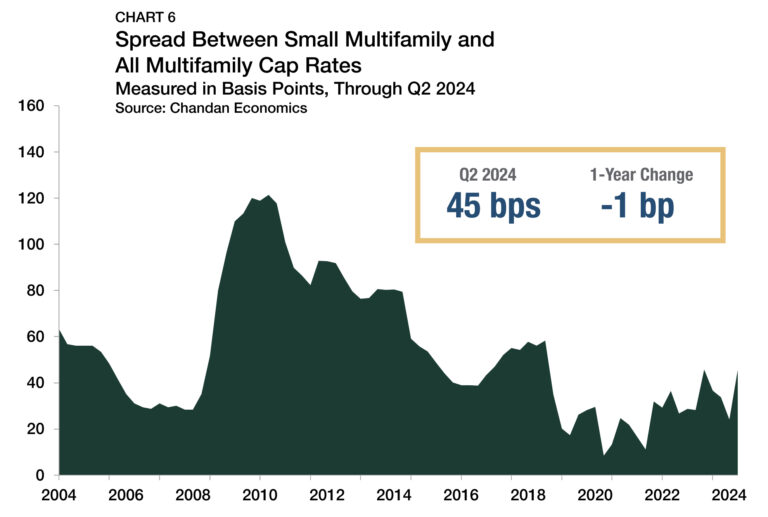
Despite the slight increase, the risk premium remained well below pre-pandemic trends. Between 2015 and 2019, the small multifamily risk premium averaged 370 bps — more than double the current spread. Meanwhile, the cap rate spread between small multifamily assets and the rest of the multifamily sector, a measure of the risk unique to smaller properties, increased by 21 bps during the second quarter to reach 45 bps (Chart 6).
Expense Ratios
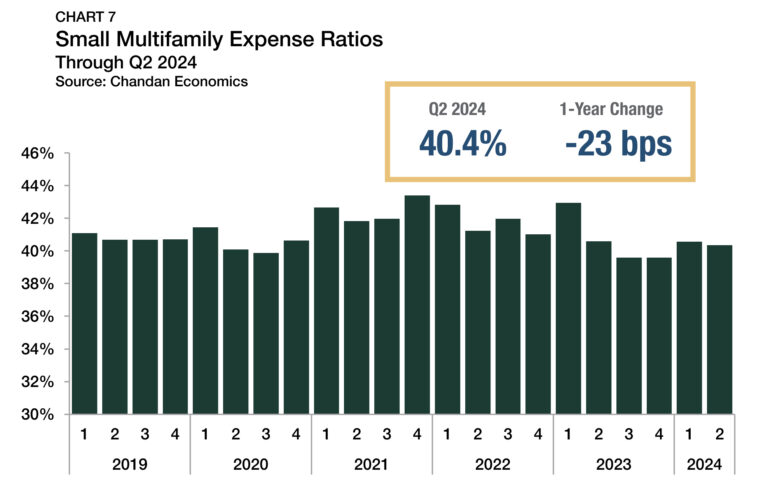
Expense ratios, measured as the relationship between underwritten property-level expenses and effective gross income, have remained stable in recent quarters. In the second quarter of 2024, expense ratios in small multifamily properties receiving financing averaged 40.4%, a slight decline from the 40.6% observed during the prior quarter (Chart 7). Expense ratios peaked at 43.0% in the first quarter of 2023, coinciding with a steep rise in property insurance prices. However, expense ratios have quickly normalized. In the past five quarters of available data, expense ratios ranged in a tight window between 39.6% and 40.6%.
Occupancy Rates
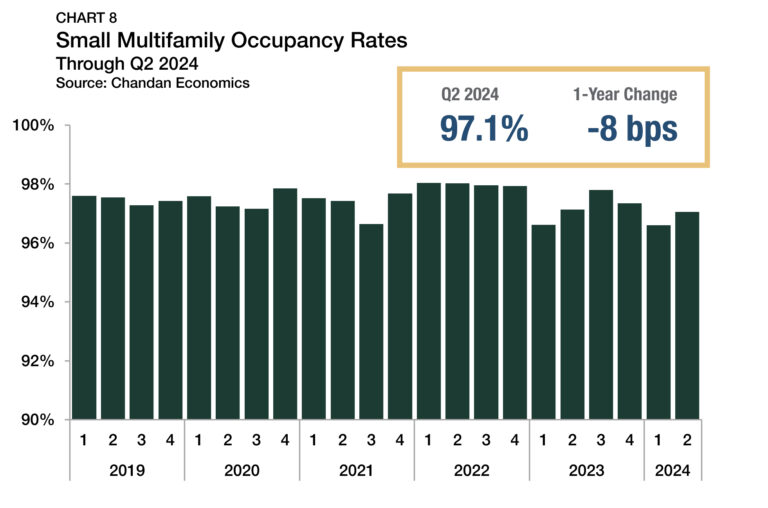
Occupancy rates within small multifamily properties that received financing during the second quarter averaged 97.1% (Chart 8). After posting slight declines in the prior two quarters, the average was a notable improvement of 45 bps, putting occupancy rates directly in line with where they were a year ago.
Small multifamily occupancy rates routinely best the rest of the multifamily sector. Occupancy rates in small multifamily properties track about 2% higher than the rest of the sector, an anomaly that may be driven by the interpersonal relationships between many landlords and their tenants. According to a recent report by the Terner Center for Housing Innovation at UC Berkeley, a majority of small multifamily property owners reported that at least half of their rental units were being leased at below-market-rate rents, primarily to retain quality tenants.
Leverage & Debt Yields
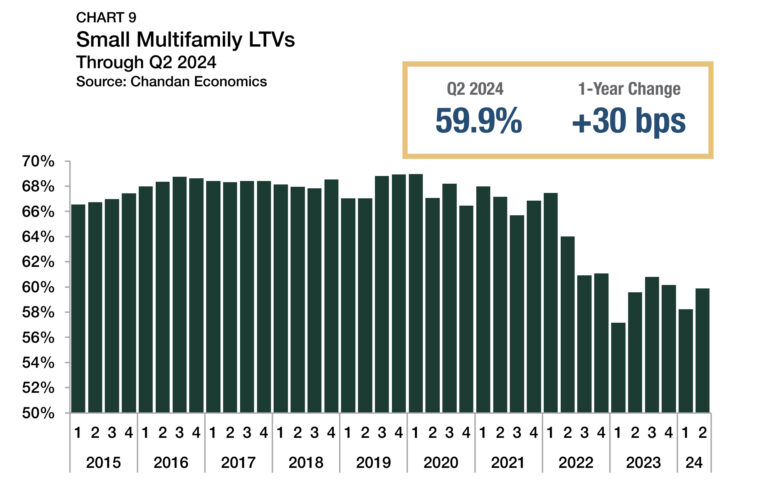
Debt underwriting standards remained tight, as loan-to-value ratios (LTVs) improved by 164 bps from the previous quarter, settling at 59.9% (Chart 9). However, the upward movement in the second quarter only erased declines from the first three months of the year, with average LTVs down 29 bps from year-end 2023. Small multifamily LTVs remain below pre-pandemic levels and down 9.1 percentage points from a peak of 68.9% in 2019.
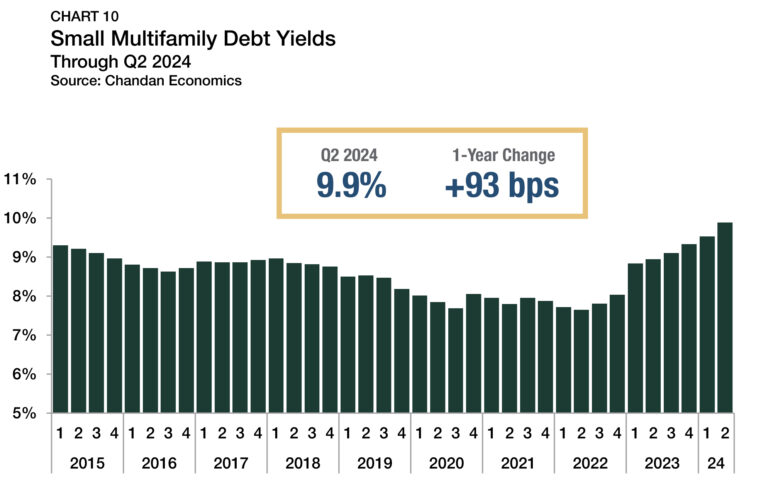
Average debt yields for small multifamily loans continued to ascend, reaching 9.9% (Chart 10). Small multifamily debt yields have risen in each of the past eight quarters, reaching their highest point in over a decade.
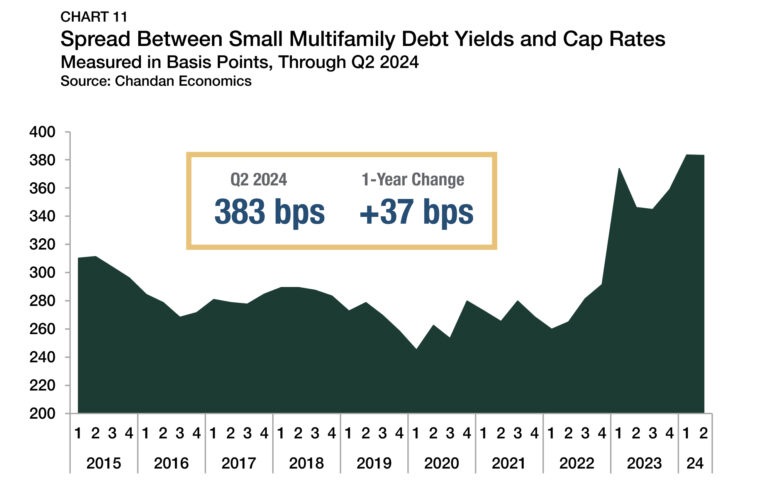
While cap rates and debt yields are both higher than one year ago, debt yields have increased more substantially than cap rates. The spread between debt yields and cap rates remained at 383 bps in the second quarter of 2024, holding at its widest point since 2013 (Chart 11).
The inverse of debt yields, the debt per dollar of net operating income (NOI), for small multifamily loans fell again in the first quarter of 2024. Small multifamily borrowers secured an average of $10.49 in new debt for every $1.00 of property NOI, a decline of $0.21 from the previous quarter and its lowest level since 2014.
Outlook
The small multifamily subsector continues to post gains and show growth amid a challenging macroeconomic environment. Between the liquidity provided by the GSEs, the increasing frequency of loan extensions, and the expectation that financial market conditions will soon improve, the small asset class remains on solid footing and distress should remain contained.
In the past decade, there have been 3.5 million more household formations than new housing unit completions. The ongoing housing shortage in the U.S. will result in above-average multifamily demand levels for the foreseeable future. If the Federal Reserve moves to cut interest rates this year, it will further help bridge gaps between buyers and sellers, accelerating the small multifamily sector’s normalization.
For more small multifamily research and insights, visit arbor.com/articles
Disclaimer
This report is intended for general guidance and information purposes only. This report is under no circumstances intended to be used or considered as financial or investment advice, a recommendation or an offer to sell, or a solicitation of any offer to buy any securities or other form of financial asset. Please note that this is not an offer document. The report is not to be considered as investment research or an objective or independent explanation of the matters contained herein and is not prepared in accordance with the regulation regarding investment analysis. The material in the report is obtained from various sources per dating of the report. We have taken reasonable care to ensure that, and to the best of our knowledge, material information contained herein is in accordance with the facts and contains no omission likely to affect its understanding. That said, all content is provided herein “as is” and neither Arbor Realty Trust, Inc. or Chandan Economics, LLC (“the Companies”) nor their affiliated or related entities, nor any person involved in the creation, production and distribution of the content make any warranties, express or implied. The Companies do not make any representations or warranties, express or implied, as to the reliability, usefulness, completeness, accuracy, currency nor represent that use of any information provided herein would not infringe on other third-party rights. The Companies shall not be liable for any direct, indirect or consequential damages to the reader or a third party arising from the use of the information contained herein. There may have been changes in matters which affect the content contained herein and/or the Companies subsequent to the date of this report. Neither the issue nor delivery of this report shall under any circumstance create any implication that the information contained herein is correct as of any time subsequent to the date hereof or that the affairs of the Companies have not since changed. The Companies do not intend, and do not assume any obligation to update or correct the information included in this report. The contents of this report are not to be construed as legal, business, investment or tax advice. Each recipient should consult with its legal, business, investment and tax advisors as to legal, business, investment and tax advice. The information contained herein may be subject to changes without prior notice. This report is only intended for the recipients, and should not be copied or otherwise distributed, in whole or in part, to any other person.


