National rent growth in the single-family rental (SFR) sector remained strong and consistent in 2025 as market-level pricing momentum was broad-based and robust, according to an analysis of newly released data from the Zillow Observed Rent Index. Year-end annual rent gains averaged 2.9%, down from 4.1% in 2024, marking the most modest increase since 2015. But even as the intensity of SFR rent growth abated last year, its reach was extensive, with 98 of the 100 largest markets posting year-over-year gains.
Top Markets for Multifamily Investment Report Fall 2025
Table of Contents
Overview
While growth has stalled in many asset classes, the tide has started to turn for multifamily real estate investment. Following a two-year price correction, multifamily valuations are trending higher in 2025, bolstered by steady rent gains and growing interest rate optimism. As anticipation builds for the next shift in the cycle, actionable insights into the best locations to deploy capital are invaluable.
The Arbor Realty Trust-Chandan Multifamily Opportunity Matrix analyzes a wide range of factors — such as liquidity, affordability, population growth, and demographics — to assess the economic strength and durability of the largest 50 U.S. metropolitan areas. This fall, a mix of maturing, dynamic markets and affordable, opportunity-rich metros outperformed.
From Nashville, TN, to Indianapolis, IN, to Columbus, OH, our biannual report is a roadmap designed to guide multifamily investors to the top locations for capital deployment.
Key Findings
-
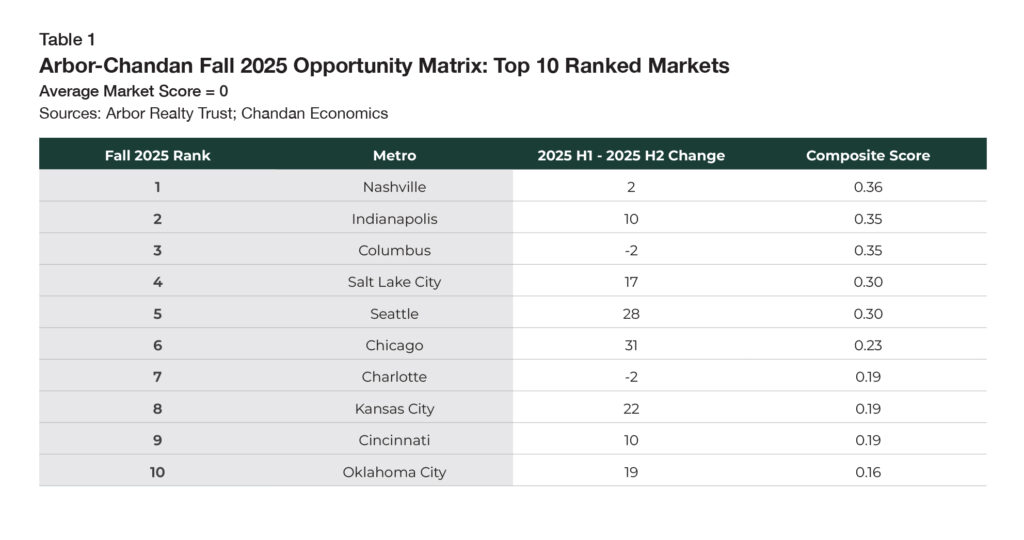
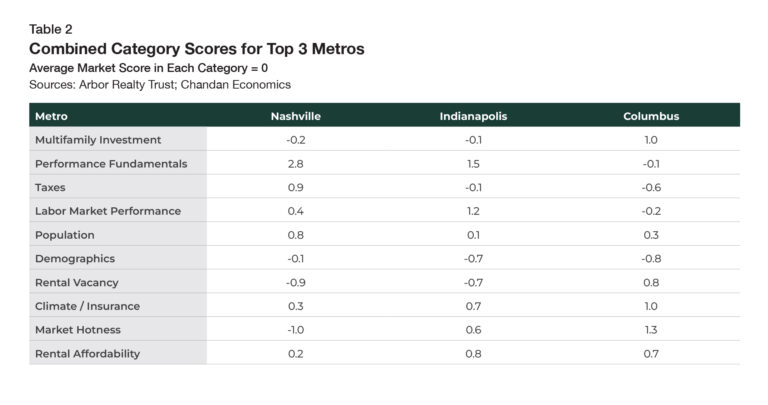
Nashville, TN, is the most appealing metropolitan market for multifamily investing due to its robust labor market, strong performance fundamentals, business-friendly tax climate, and youthful population profile.
-
Six of the top 10 markets are in the Midwest, underscoring how the region’s blend of stability, affordability, and newfound economic dynamism is leading to multifamily success.
-
Strengthened by regional momentum and labor market diversification, Indianapolis, IN, and Columbus, OH, finished second and third, respectively.
PDF link below
Top Ranked Markets
Nashville
Nashville ranked first in the Fall 2025 Multifamily Opportunity Matrix due to its strong labor market, healthy performance fundamentals, business-friendly tax environment, and youthful population.
According to a comprehensive study by the Tax Foundation, Tennessee has the eighth most competitive set of tax laws, policies, and regulations in the country, which has attracted substantial inflows of new residents and investment capital (Table 1). Nashville’s unemployment rate has held steady near 3.0% so far this year, which underscores the strength of the local economy.
On a risk-adjusted basis, Nashville has a rare alignment of growth and stability — one where demographic momentum, business dynamism, and cultural vitality converge to support durable multifamily returns.
For a full breakout of the Fall 2025 scores and rankings,
see Table 4 in the Appendix at the end of the report.
Indianapolis
Indianapolis, IN, continues to distinguish itself as one of the most balanced and resilient multifamily markets in the country. The metro’s diversified economy — anchored by healthcare, logistics, and advanced manufacturing — has helped it maintain steady employment gains and attract a growing roster of corporate investment. With an unemployment rate below the national average and annual wage growth outpacing many of its Midwest peers, second-place Indianapolis provides investors with a stable economic backdrop with room for upside.
Affordability is at the heart of the success of Indiana’s capital city, where the average household needs an annual income of $61,293 to comfortably rent a home. Even as rents climbed in recent years, Indianapolis has remained one of the most cost-effective major markets for both residents and businesses, supporting a consistent flow of migration from higher-cost metros. The city’s expanding tech corridor, supported by initiatives from firms like Salesforce and Eli Lilly, has also added momentum to housing demand in the downtown area.
Columbus
Columbus, ranked first in the Spring 2025 Multifamily Opportunity Matrix, ranked third this fall. Ohio’s capital city continues to be one of the nation’s most consistently strong-performing multifamily markets. Anchored by Ohio State University and a diverse employment base spanning education, healthcare, and advanced manufacturing, Columbus has undergone a broad-based economic expansion. Recent and planned large-scale investments, including Intel’s multibillion-dollar semiconductor project in nearby Licking County and Anduril Industries’ next-generation manufacturing campus in Pickaway County, have elevated the city’s long-term growth trajectory and have acted as a catalyst to ongoing regional development. Industrial and infrastructure investment has also added substantial demand for housing, particularly in suburban submarkets located near new job centers. As a result, per capita multifamily originations in Columbus have continued to be among the highest in the nation.
Performance Fundamentals
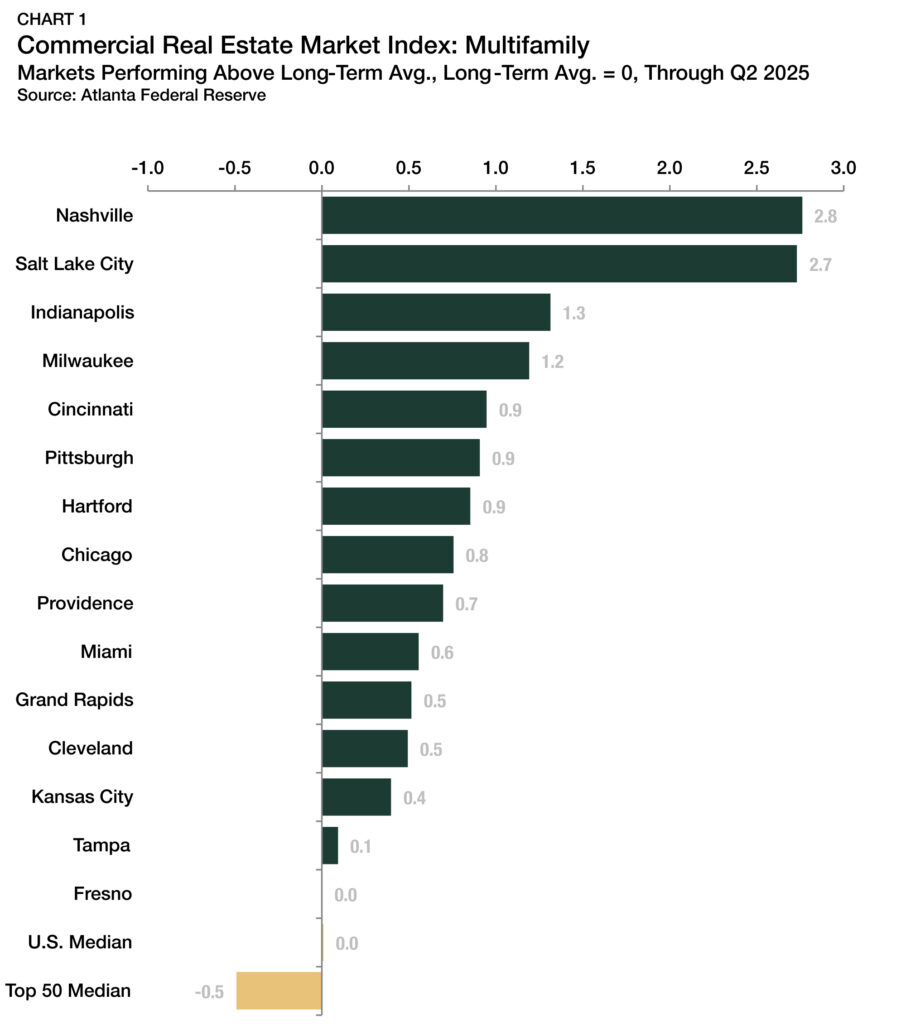
The Federal Reserve Bank of Atlanta’s Commercial Real Estate Market Index (CREMI) for multifamily properties, which compares metro-level multifamily sectors relative to historical patterns in categories that include net operating income (NOI), cap rates, and valuation, was a significant factor in the Arbor Realty Trust-Chandan Multifamily Opportunity Matrix’s calculations.
With every market having a long-term average score of zero in the CREMI index, only 15 of the 50 largest metros (30%) continued to see above-average multifamily sector performance through Q2 2025. However, there were several significant standouts this year, with Nashville, fall 2025’s first-place market, leading the way (Chart 1).
Salt Lake City, fourth overall, scored second highest in the CREMI index, part of the steady outperformance of the Midwest. Of the 15 markets with a positive score, seven were in the Midwest: Indianapolis, IN; Milwaukee, WI; Cincinnati, OH; Chicago, IL; Grand Rapids, MI; Cleveland, OH; and Kansas City, MO.
Tax Climate
Tax climate can have a profound impact on local economies. For multifamily investors, tax competitiveness can tilt long-term return profiles and influence migration-driven demand fundamentals. The Multifamily Opportunity Matrix weighs data from the Tax Foundation’s 2025 State Business Tax Climate Index to assess the relative tax competitiveness to rank how favorable — or punitive — each metro’s policy environment is to multifamily investment and future growth.
Across all 50 states and the District of Columbia, the three most tax-competitive states are Wyoming, South Dakota, and Alaska — although none of them include any of the 50 most populous metro areas on our list. Among states with a top 50 metro, Florida and Texas led the way. Neither state has an individual income tax, an attractive feature to high earners. At the other end of the spectrum, New York and California rank among the least tax-competitive states that have qualifying metros. According to a Chandan Economics analysis of U.S. Census Bureau data, Florida and Texas are among the most common destinations among households relocating from New York and California, underscoring how tax climates influence living decisions.
Property Insurance Prices
Insurance pricing acts as a neutral arbiter of localized climate and hazard risk. Through an evaluation of insurance dynamics, this analysis shows how environmental exposure and market-level real estate risk perceptions translate into ongoing expense factors for multifamily assets.
For a comprehensive view of prices and coverage rates, the matrix considers three factors:
1. Annual property insurance prices as a percentage of home values
2. Share of homes in a market without property insurance
3. The 10-year change in the share of homes without coverage
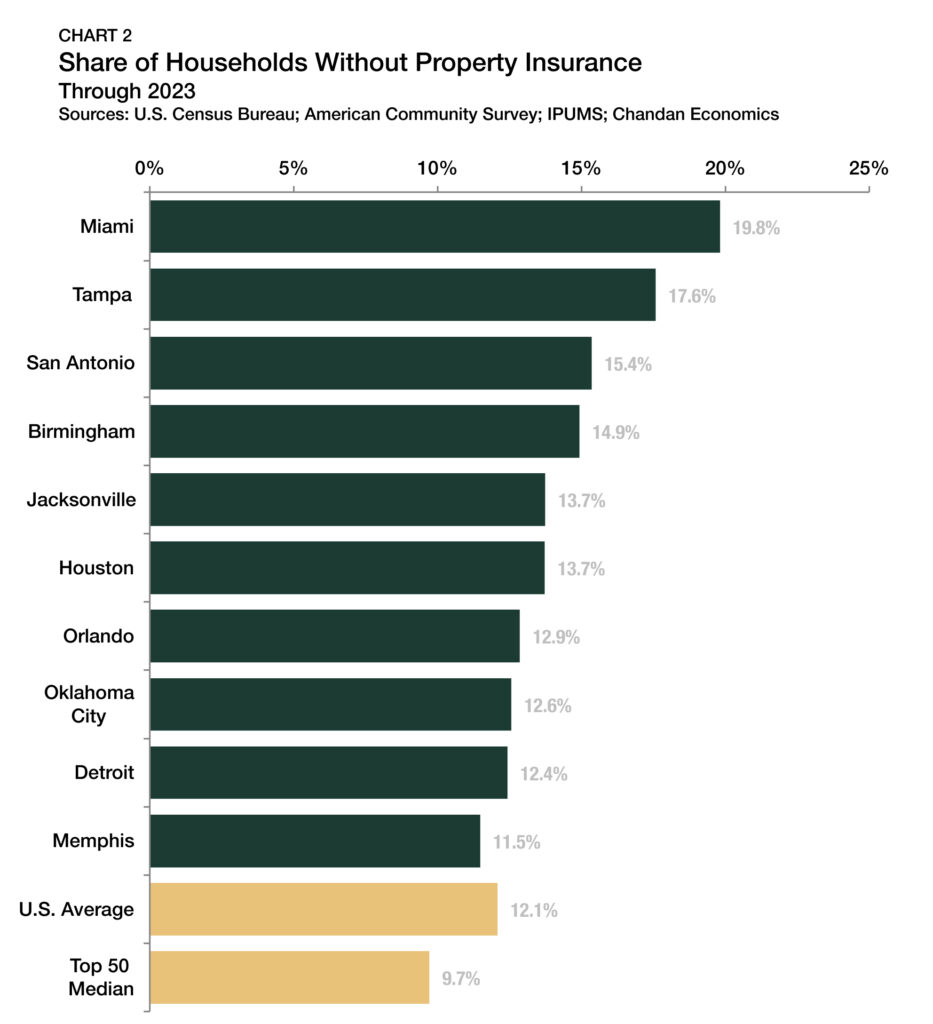
Taken together, these factors provide a market-based proxy for how risk and cost exposure may affect operating margins, long-term asset resilience, and liquidity. Zeroing in on the share of homes in each metro that are insured, nationally, 12.1% of homeowners did not have insurance coverage in 2023. Within our sample of 50 markets, the share of homes without insurance trends lower, with 41 metros having uninsured rates below the national average. However, there are notable outliers. Florida’s Miami and Tampa both jump off the page, with uninsured rates reaching 19.8% and 17.6%, respectively (Chart 2).
Multifamily Investment
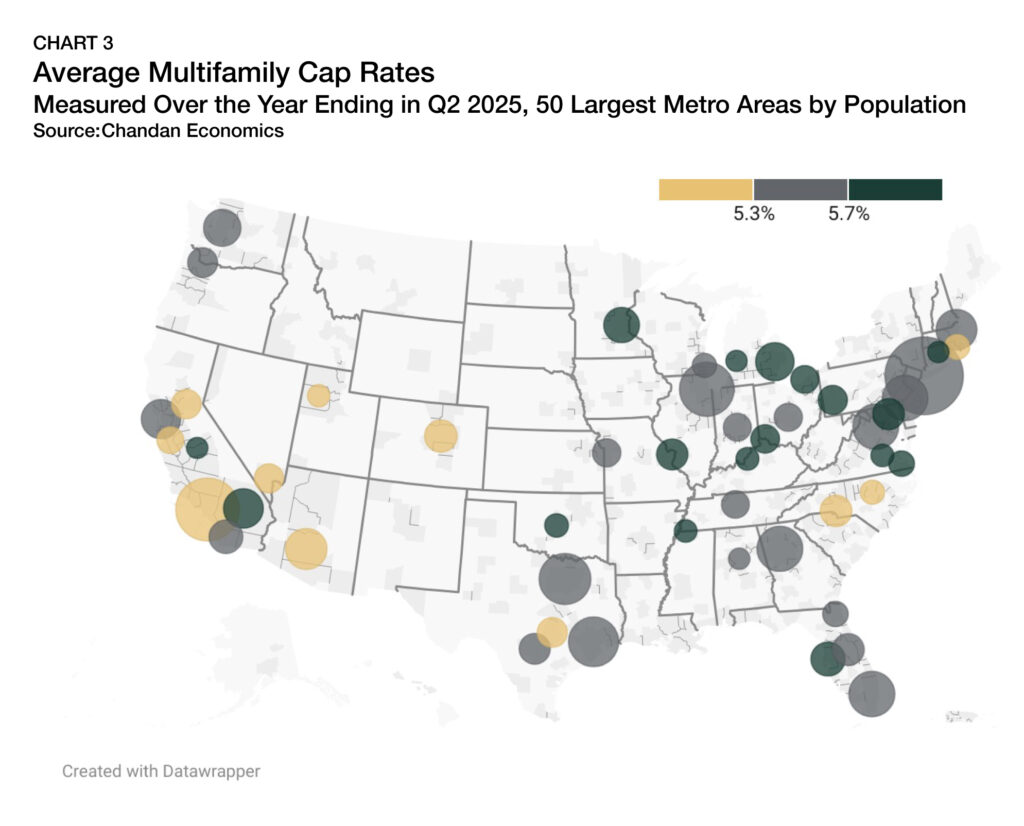
To locate areas of liquidity and opportunity, Chandan Economics analyzed a pool of multifamily loans originated between Q3 2024 and Q2 2025, which were tracked across the largest 50 metros, for both multifamily investment sales and refinancings. The analysis considered total loan volume, volume per capita, and average cap rates at origination over the past year. For a potential real estate investor deciding in which market to deploy capital, our research teams determined higher property-level yields to be more attractive. Within this framework, metros within the Midwest had the highest cash flow returns. Cleveland, OH (6.8%), had the highest average cap rates in the sample, followed by Oklahoma City, OK (6.6%), and Minneapolis, MN (6.3%) (Chart 3).
Rental Affordability
Housing affordability remains a primary concern for U.S. renters. According to an analysis of the U.S. Census Bureau’s Current Population Survey, a desire for lower-priced housing, better/new housing, a more desirable neighborhood, or another housing-centric reason motivated the moving decisions of more than one-third (35.9%) of renters in the survey.
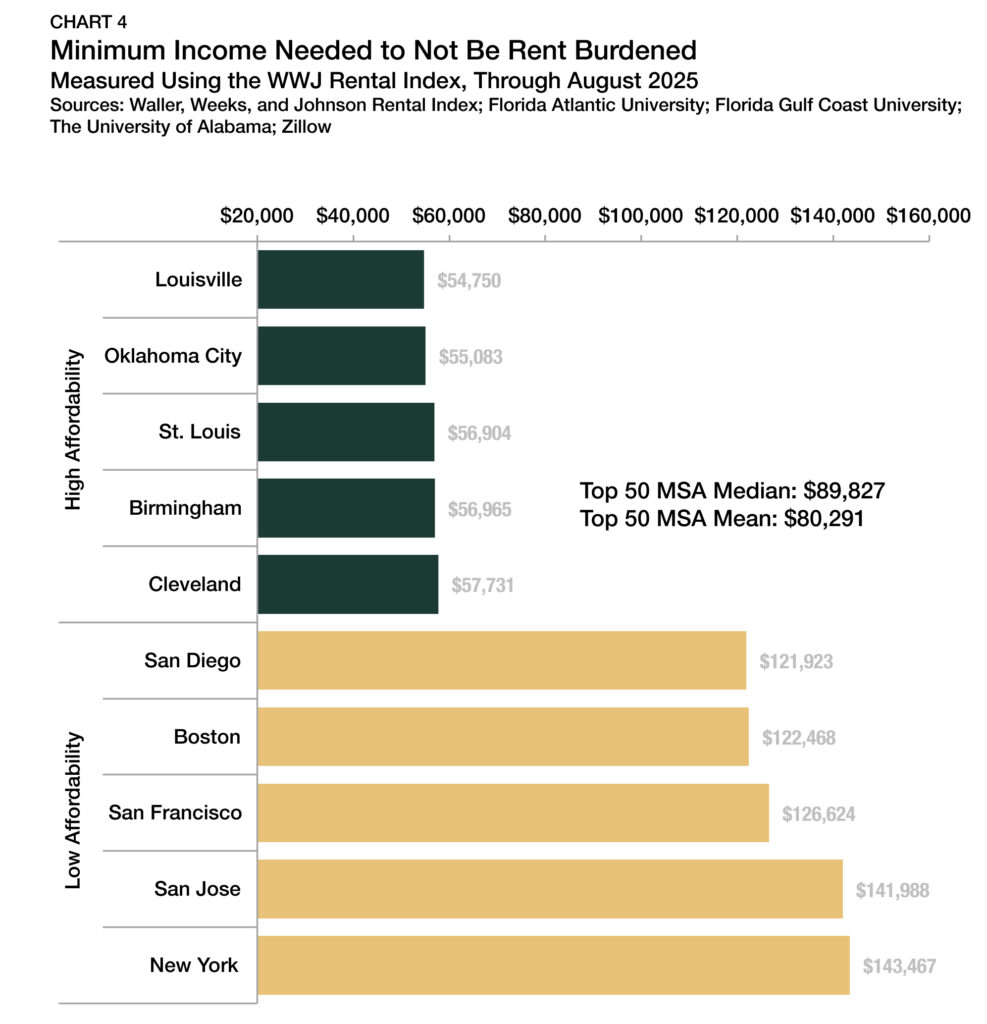
Housing affordability in the Multifamily Opportunity Matrix was determined by reviewing Waller, Weeks, and Johnson Rental Index data, which calculates the minimum income required in each metropolitan area for a household not to be considered rent-constrained. Markets that have lower income thresholds for affordability scored higher in our matrix because they are more attractive to budget-conscious renters. Louisville, KY, led the country in rental affordability in the rankings, with an average monthly rental price of $1,369 through August 2025. Households earning $54,750 or more are not considered rent-burdened there (Chart 4). Just behind Louisville was Oklahoma City, OK, where the rent-burdened threshold was slightly higher at $55,083. Rounding out the top five in rental affordability were St. Louis, MO ($56,904), Birmingham, AL ($56,965), and Cleveland, OH ($57,731).
Meanwhile, coastal cities have seen very different trends. The threshold to be considered not rent-constrained is more than twice as high in several major coastal markets at the opposite end of the affordability spectrum, including New York, NY ($143,467), San Jose, CA ($141,988), and San Francisco, CA ($126,624).
Market Spotlight: Nashville
Nashville has firmly established itself as one of the most dynamic metros in the United States, combining strong demographic tailwinds, a deepening economic base, and a vibrant cultural identity that fuels both population and job growth.
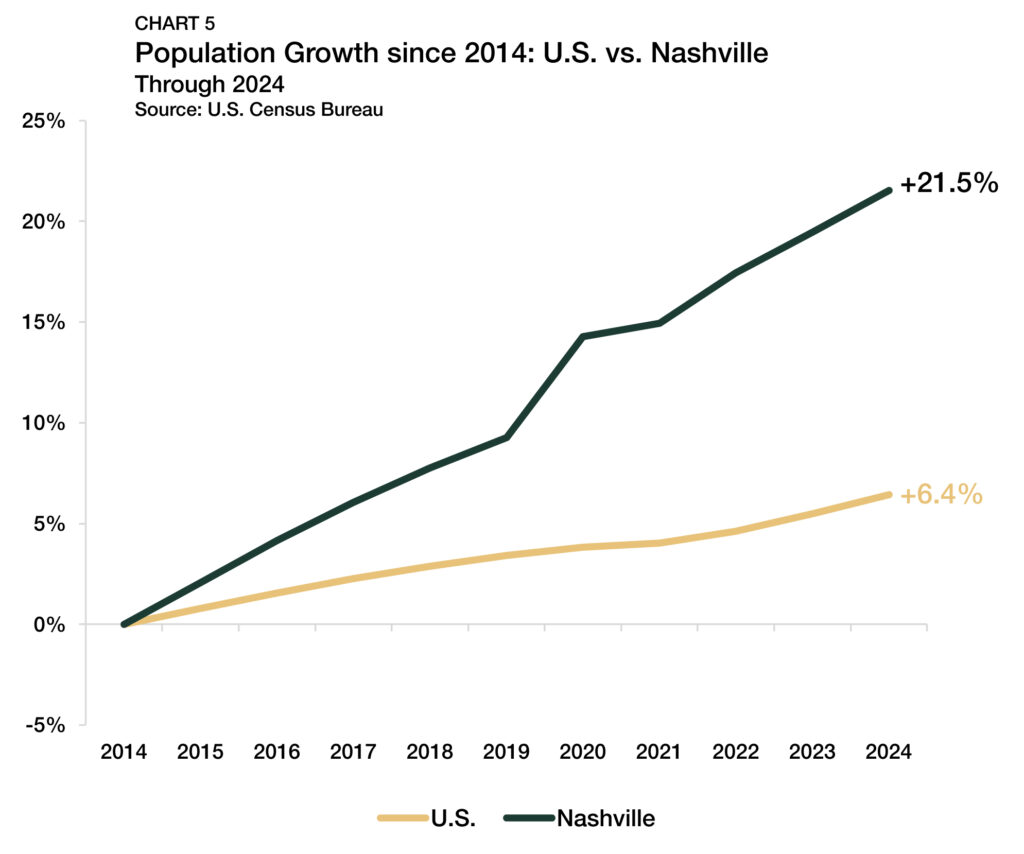
Over the past decade, Nashville has consistently ranked among the fastest-growing large metros in the country. In the past 10 years, Nashville’s base of residents has swelled by 21.5%, more than triple the national growth rate of 6.4% (Chart 5). Nashville’s population growth has been propelled by new residents arriving from higher-cost coastal markets, drawn to the city’s relative affordability, low tax environment, and high quality of life.
The metro’s age and education profile further enhances its investment appeal, as Nashville attracts a steady inflow of young professionals and families seeking employment opportunities and lifestyle amenities in an expanding urban area. Within our sample of 50 metros, Nashville had the third-highest share of renters under 35 years old.
Nashville’s evolution from a regional healthcare and music hub to a diversified, innovation-driven economy is one of the country’s most notable metropolitan success stories. The city’s healthcare management and services cluster — anchored by major employers like HCA Healthcare and Vanderbilt University Medical Center — provides a stable employment foundation. Beyond that, the metro has rapidly expanded into technology, advanced manufacturing, finance, and professional services, attracting both Fortune 500 investment and startup activity. The city’s strong airport connectivity, central location, and pro-business environment have also spurred expansions from firms such as Amazon, Oracle, and Bridgestone, cementing Nashville’s status as a Southeastern economic engine.
Capital inflows and infrastructure upgrades continue to reshape the metro’s skyline and economic trajectory. The construction of Oracle’s East Bank campus — projected to employ thousands — has catalyzed broader redevelopment efforts along the Cumberland River. Investments in transit, airport expansion, and downtown mixed-use projects have elevated Nashville’s urban profile, transforming it from a regional center into a national growth hub.
Investors tend to benefit from strong underlying fundamentals, competitive yields relative to coastal markets, and an economic environment that supports long-term asset appreciation. Nashville’s landlord-friendly regulatory framework and comparatively low property tax burden enhance its appeal, particularly for institutional investors seeking both income stability and growth potential.
Overall, Nashville’s ascent shows little sign of slowing. Its combination of robust job creation, young and growing population, and expanding corporate presence provides a foundation for enduring housing demand and attractive multifamily performance across cycles. With large-scale investment continuing to transform its urban fabric, the market’s long-term trajectory points toward sustained value creation. For multifamily investors, the market presents a compelling case for long-term outperformance as its economic diversification, sustained in-migration, and stable supply fundamentals converge to create favorable risk-adjusted returns.
Outlook
The multifamily housing sector enters the final stretch of 2025 in a moment of growing optimism. With the broad recalibration of asset prices now in the rearview, 70% of national apartment markets have seen positive rent growth in a more accommodative interest rate environment. Altogether, cyclical headwinds are fading. For metros with the right blend of stability, affordability, and magnetic vibrancy, the alignment of structural and cyclical momentum could make 2026 a pivotal springboard year. But with U.S. population growth forecasted to slow, cross-market competition for residents is likely to escalate, making market knowledge a crucial advantage to real estate investors.
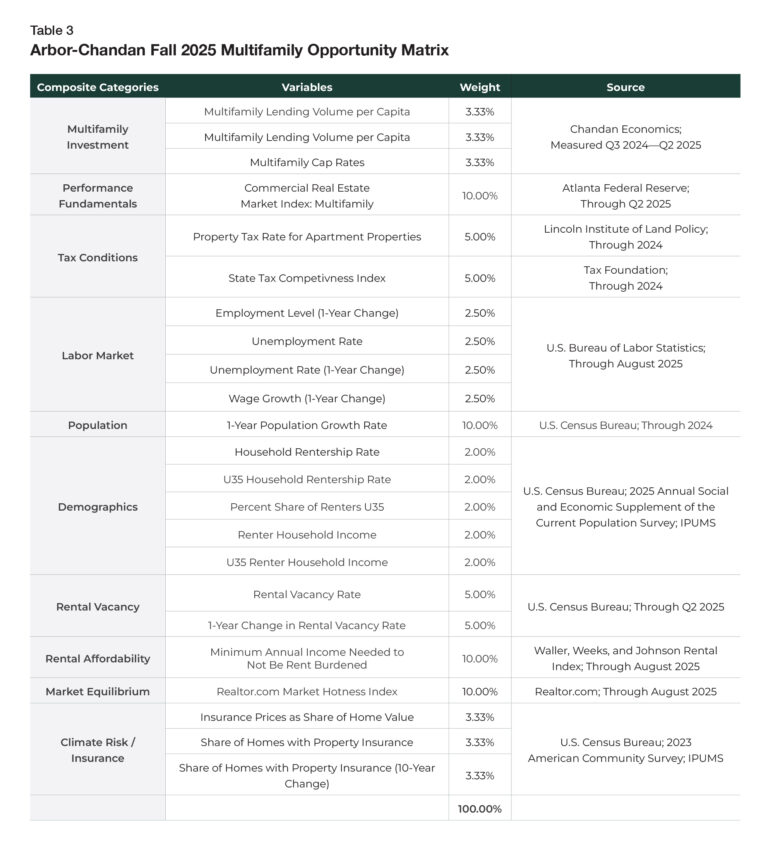
The Opportunity Matrix
- Multifamily Investment: measured as a proxy for the availability of debt financing, overall liquidity, cash-flow opportunity, and a market’s ability to support additional multifamily investment. Both acquisitions and refinancing are tracked in this analysis.
- Performance Fundamentals: a comprehensive mix of recent multifamily sector performance and momentum.
- Tax Conditions: tax burdens for firms, properties, and individuals — measuring monetary and human capital attractiveness.
- Labor Market: topline profile of key labor market performance indicators, including market growth, unemployment rate, change in the unemployment rate over the past year, and wage growth.
- Population Growth: overall growth of a metro over the short and medium term.
- Renter Demographics: spending power and age profile of existing renters (higher household incomes and younger householders assumed as conducive to higher levels of multifamily demand).
- Renter Vacancy: measures the current market tightness for all existing metro-level rental inventory.
- Market Equilibrium: considers the pace of incoming housing demand against existing housing supply using Realtor.com’s Market Hotness Index as a proxy.
- Affordability: minimum income needed to rent an apartment without being rent-burdened, included to capture a market’s attractiveness for incoming rental demand.
- Climate Risk: a mix of property insurance prices and coverage rates offers a market-based proxy for how risk and cost exposure may affect operating margins, long-term asset resilience, and liquidity.
Methodology
This report presents an analytical framework to develop a cross-market comparison for opportunistic multifamily investments. The largest 50 U.S. metropolitan areas1 are ranked using the Arbor-Chandan Multifamily Opportunity Matrix based on a weighted average of performance metrics. It considers how well metro-level economies have maintained strength over the past year and their ability to handle shifting market conditions through 2025 and beyond. The Multifamily Opportunity Matrix includes factors a multifamily investor might consider in their market selection process. All 10 categories received equal weighting. In categories with more than one variable, each variable received equal weighting.
Appendix
About Us
Arbor Realty Trust, Inc. (NYSE: ABR) is a nationwide real estate investment trust and direct lender, providing loan origination and servicing for multifamily, single-family rental (SFR) portfolios, and other diverse commercial real estate assets. Headquartered in Uniondale, New York, Arbor manages a multibillion-dollar servicing portfolio, specializing in government-sponsored enterprise products. Arbor is a leading Fannie Mae DUS® lender, Freddie Mac Optigo® Seller/Servicer, and an approved FHA Multifamily Accelerated Processing (MAP) lender. Arbor’s product platform also includes bridge, CMBS, mezzanine, and preferred equity loans. Arbor is rated by Standard and Poor’s and Fitch. In June 2023, Arbor was added to the S&P SmallCap 600® index. Arbor is committed to building on its reputation for service, quality, and customized solutions with an unparalleled dedication to providing our clients excellence over the entire life of a loan.
Disclaimer
This report is intended for general guidance and information purposes only. This report is under no circumstances intended to be used or considered as financial or investment advice, a recommendation, or an offer to sell, or a solicitation of any offer to buy any securities or other form of financial asset. Please note that this is not an offer document. The report is not to be considered as investment research or an objective or independent explanation of the matters contained herein and is not prepared in accordance with the regulation regarding investment analysis. The material in the report is obtained from various sources per dating of the report. We have taken reasonable care to ensure that, and to the best of our knowledge, material information contained herein is in accordance with the facts and contains no omission likely to affect its understanding. That said, all content is provided herein “as is” and neither Arbor Realty Trust, Inc. or Chandan Economics, LLC (“the Companies”) nor their affiliated or related entities, nor any person involved in the creation, production and distribution of the content make any warranties, express or implied. The Companies do not make any representations or warranties, express or implied, as to the reliability, usefulness, completeness, accuracy, currency nor represent that use of any information provided herein would not infringe on other third-party rights. The Companies shall not be liable for any direct, indirect, or consequential damages to the reader or a third party arising from the use of the information contained herein. There may have been changes in matters which affect the content contained herein and/or the Companies subsequent to the date of this report. Neither the issue nor delivery of this report shall under any circumstance create any implication that the information contained herein is correct as of any time subsequent to the date hereof or that the affairs of the Companies have not since changed. The Companies do not intend and do not assume any obligation to update or correct the information included in this report. The contents of this report are not to be construed as legal, business, investment, or tax advice. Each recipient should consult with its legal, business, investment, and tax advisors as to legal, business, investment and tax advice. The information contained herein may be subject to changes without prior notice. This report is only intended for the recipients, and should not be copied or otherwise distributed, in whole or in part, to any other person.


