Articles
In all market cycles, commercial real estate firms are better positioned to achieve successful results with leaders who are strong, confident, and authentic, qualities demonstrated by the dozens of speakers at the 2025 Real Estate Pride Roundtable in New York City.
Articles
Single-family rental (SFR) investing is surging as this asset class outperforms. With homeownership less attainable and lifestyle renting more popular, the sector’s tailwinds bode well for long-term growth. If you are new to this space, our guide has answers to commonly asked questions.
Current Reports
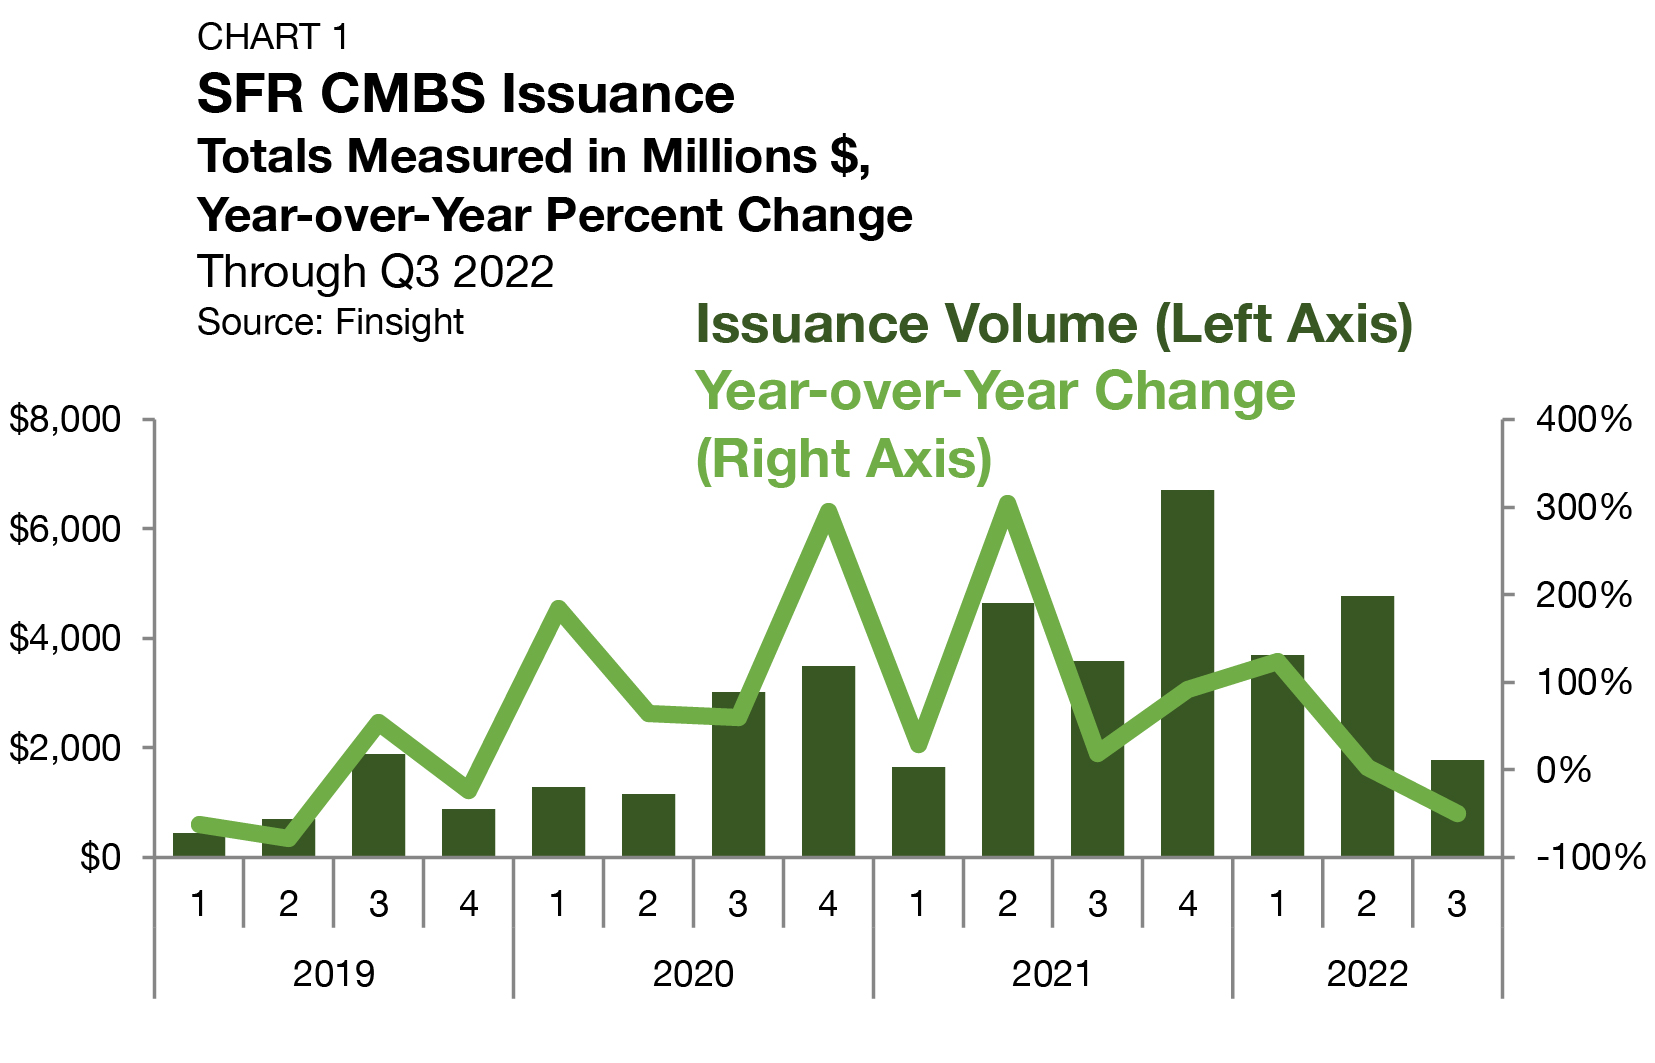
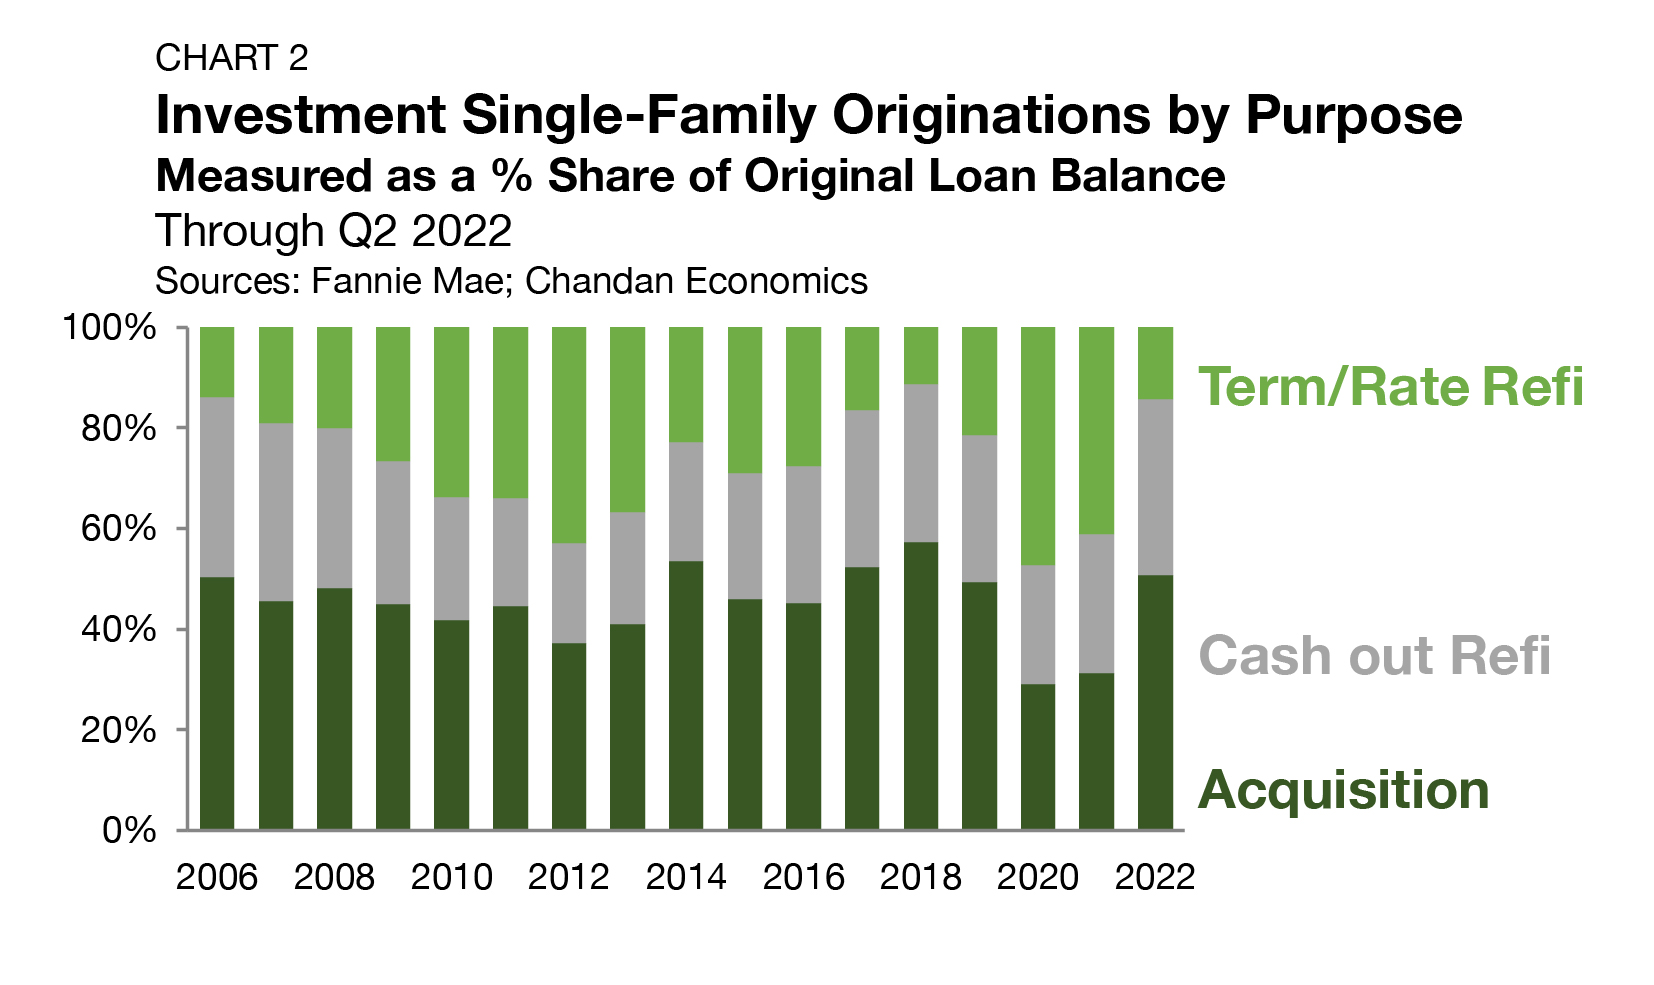
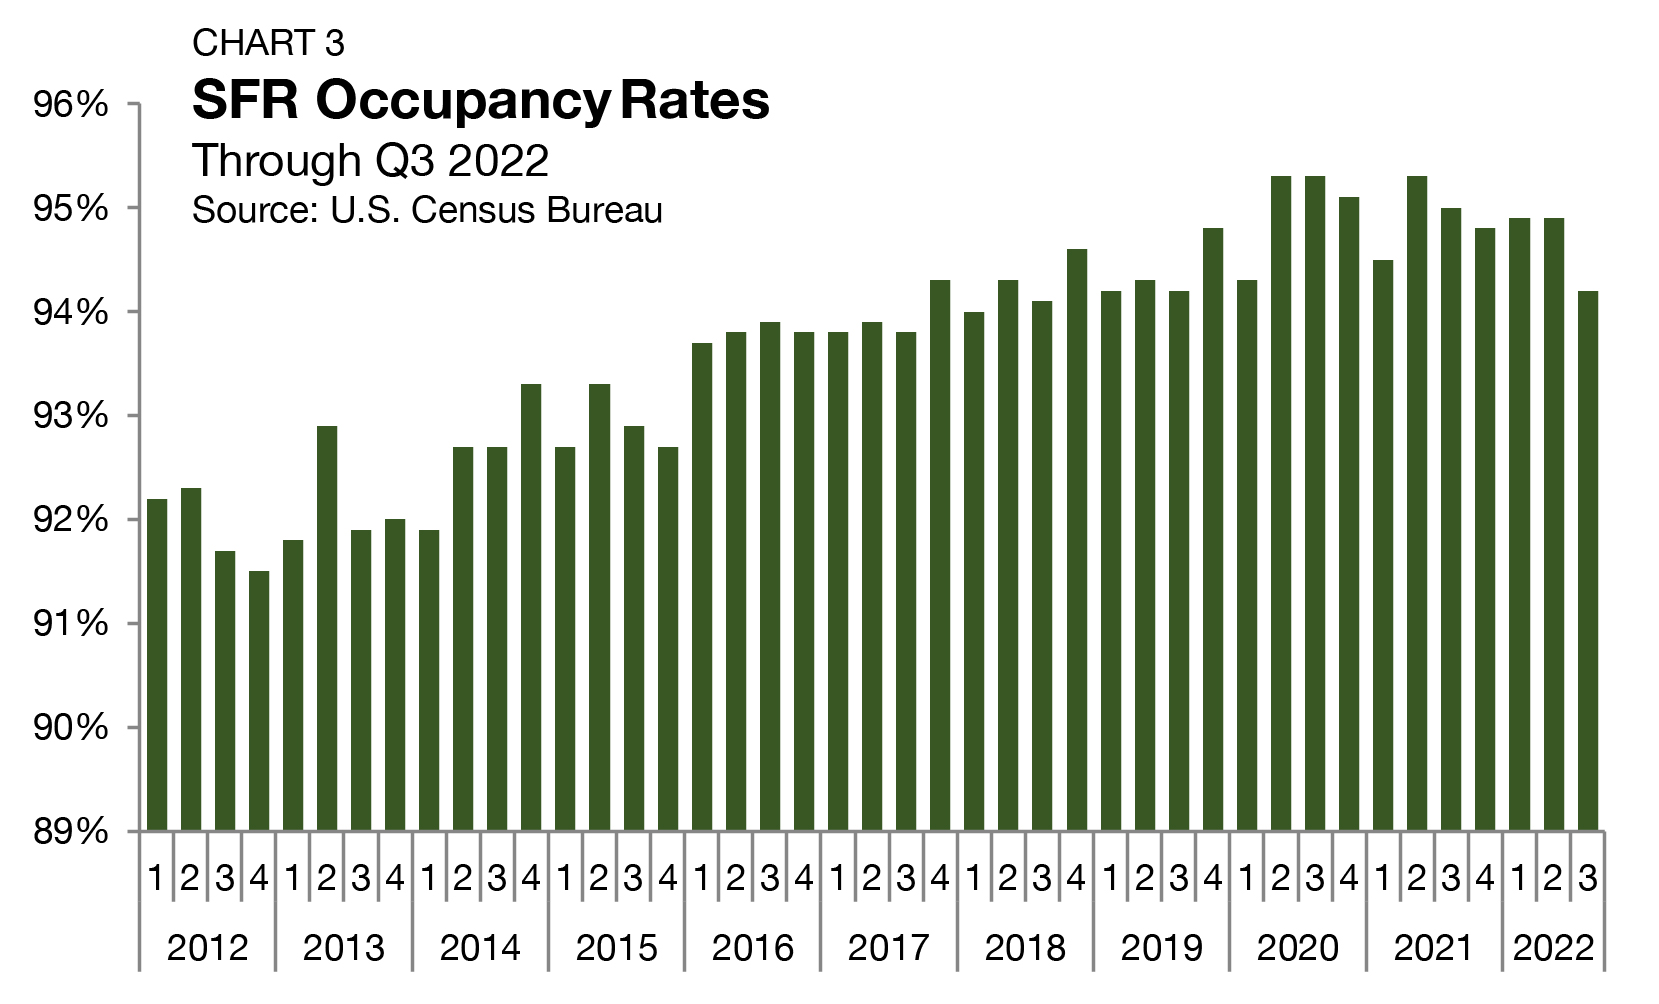
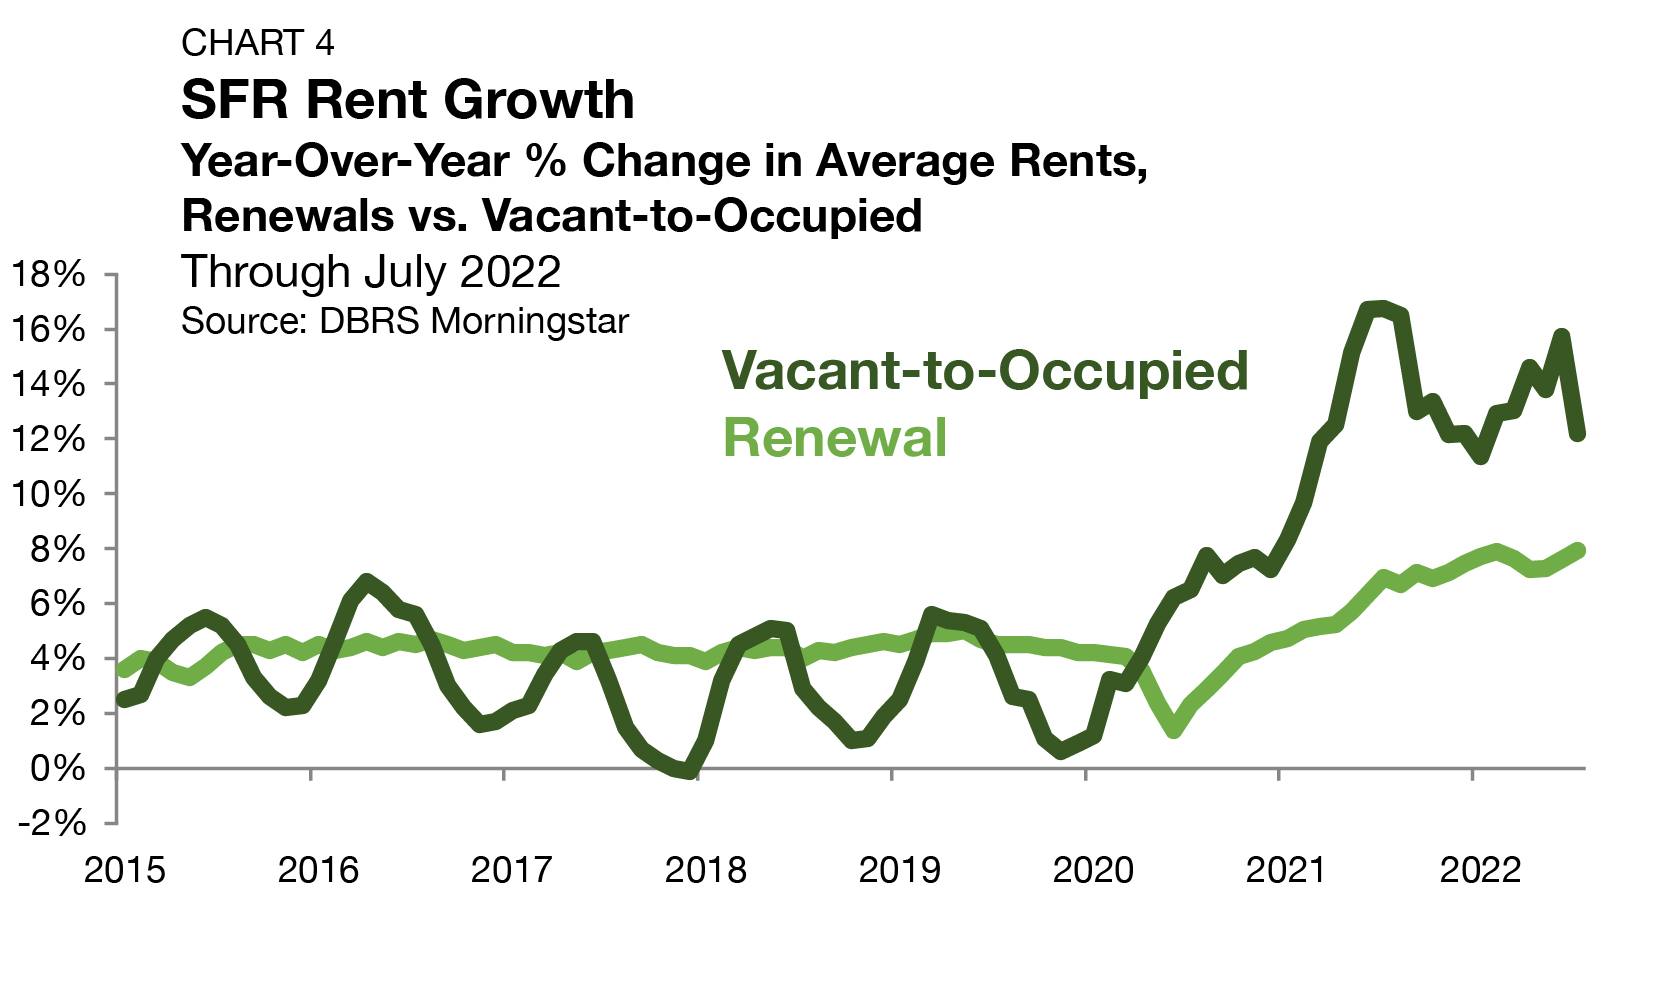
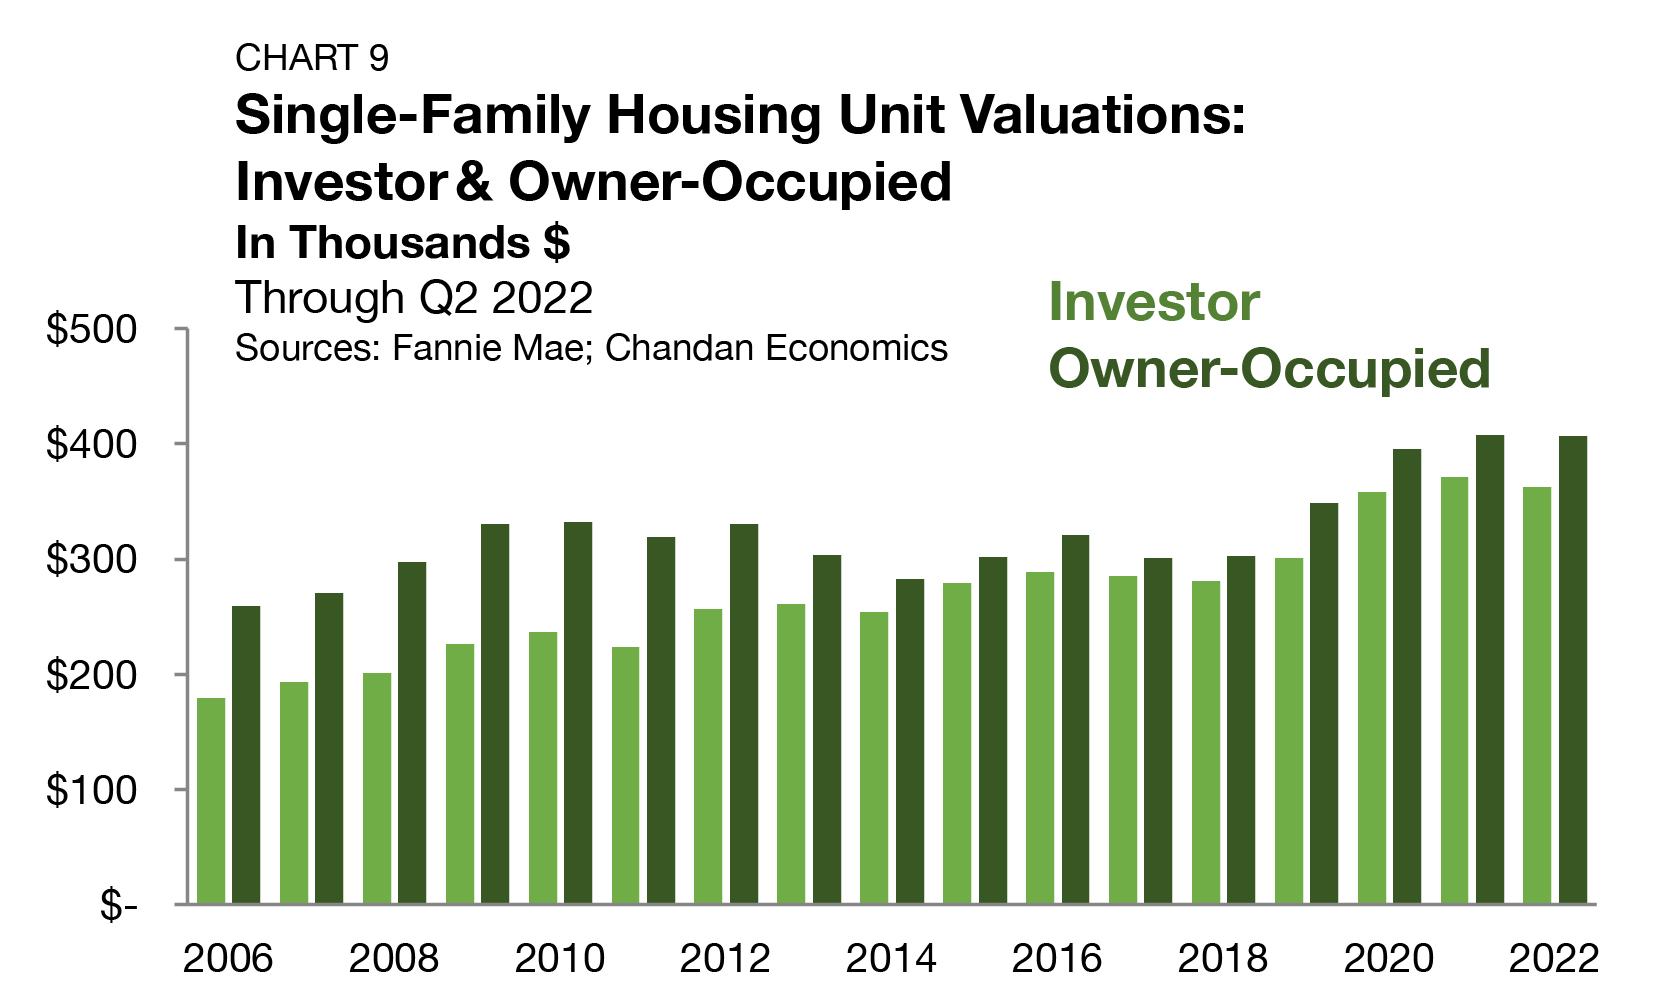
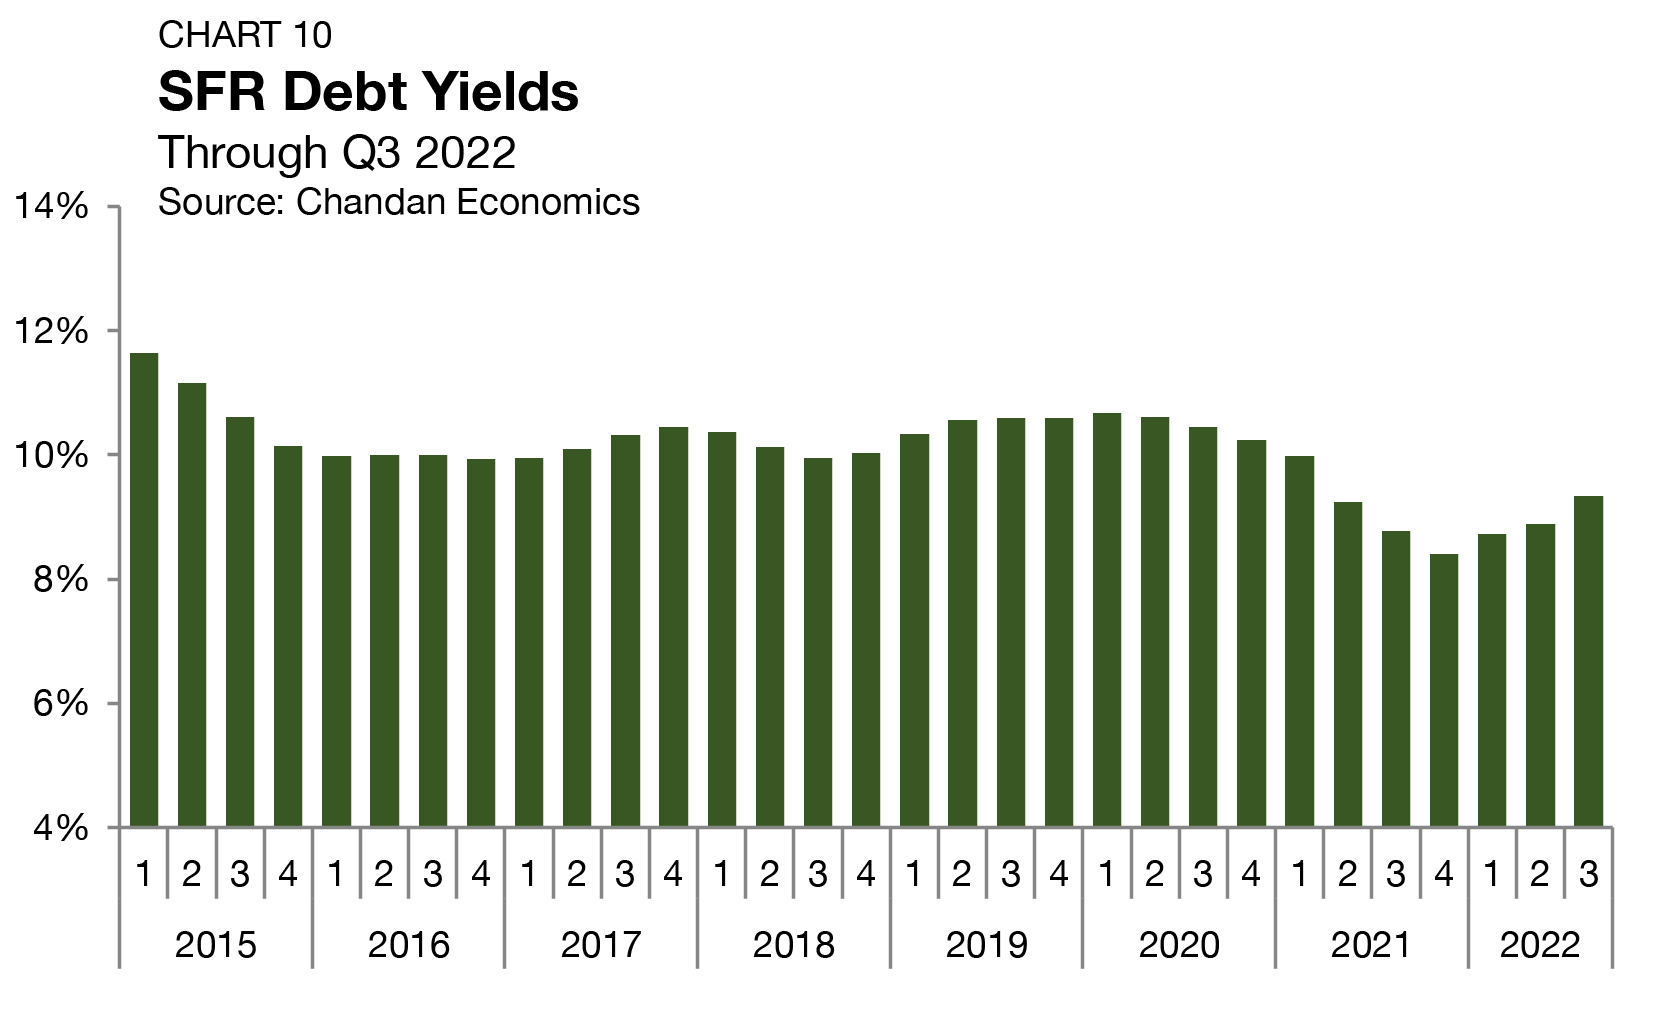
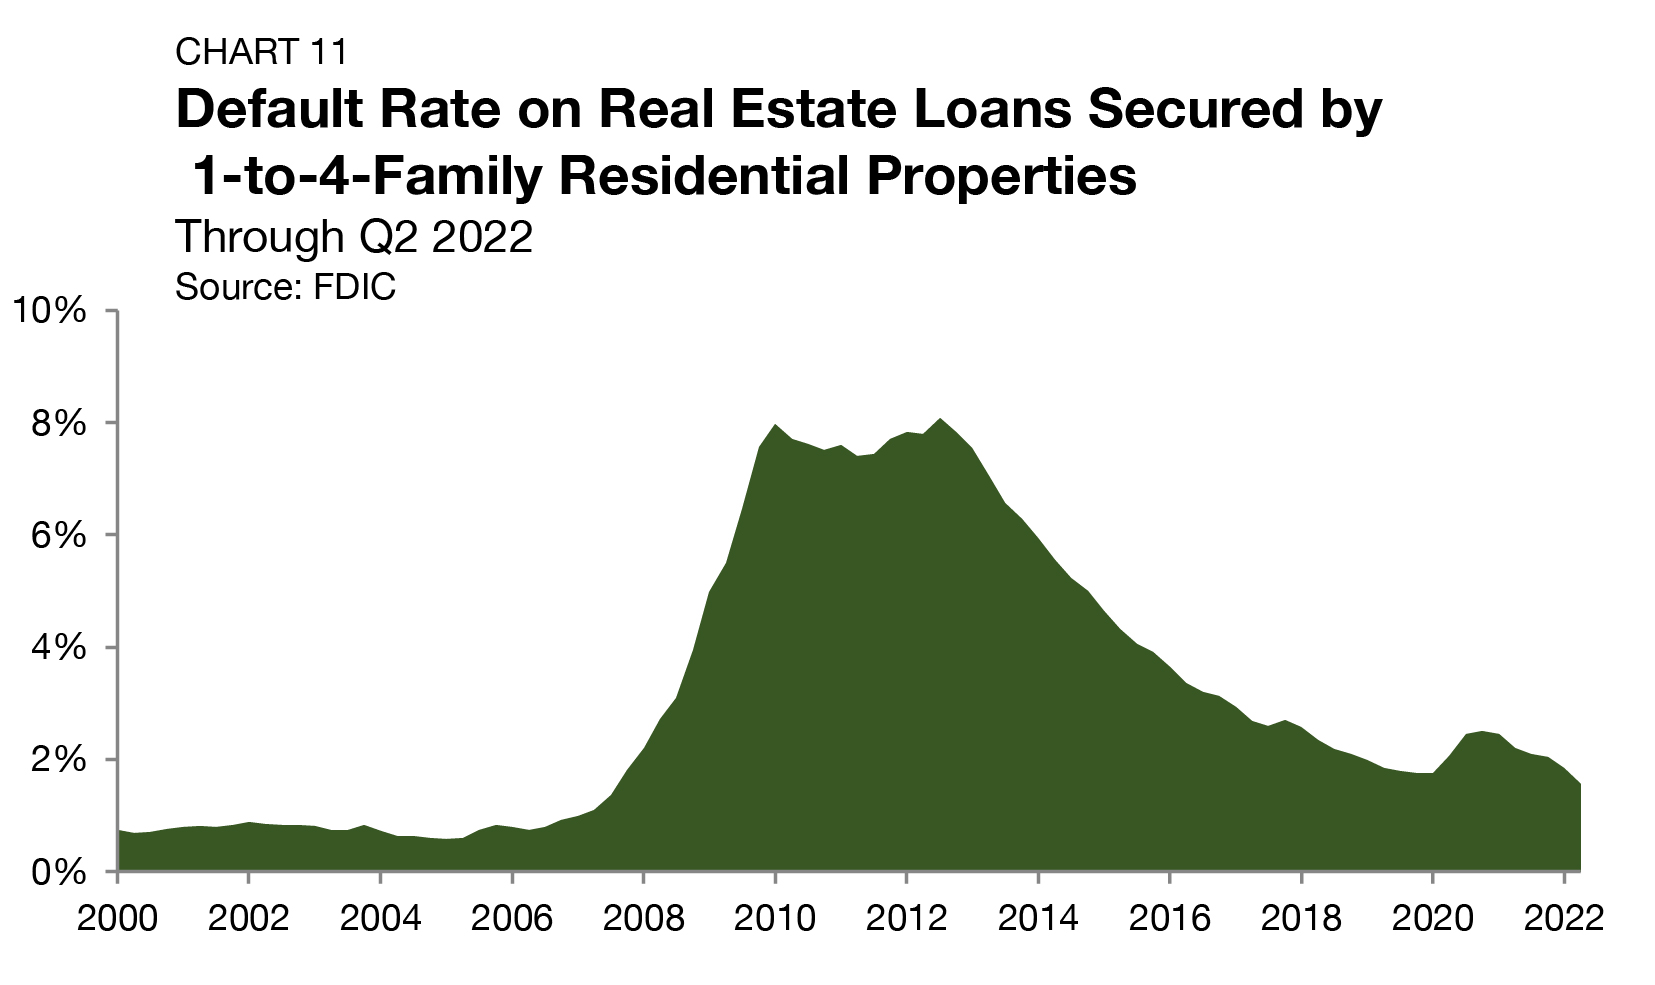
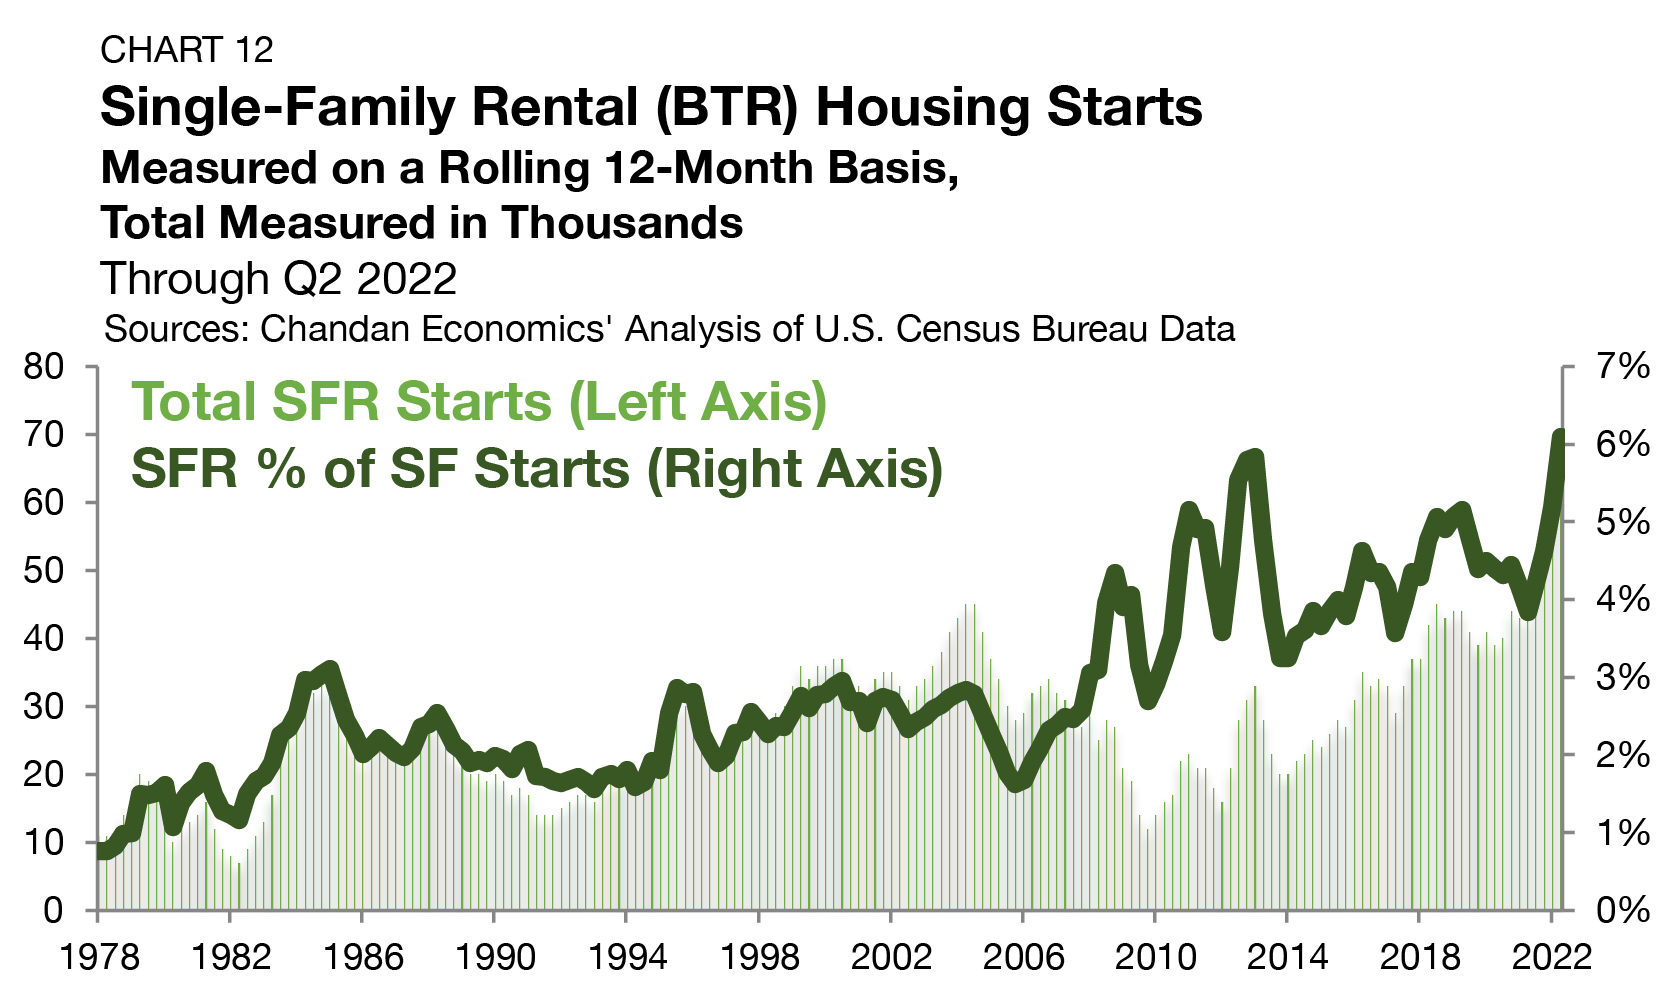
Bolstered by robust build-to-rent (BTR) activity, the single-family rental (SFR) sector continued to display strength even as the residential housing market moderated. Arbor’s Single-Family Rental Investment Trends Report Q2 2025, developed in partnership with Chandan Economics, provides original research and analysis of key performance metrics for investors to take a closer look at a sector on the rise.
Analysis
Amid ongoing macroeconomic uncertainty, the small multifamily sector remains favorably positioned for stability as the structural need for affordable housing in the U.S. has supported the strength of the sector’s demand profile.
Articles
As build-to-rent (BTR) demand rises, single-family rental (SFR) development has become more efficient in creating a distinct, community-focused experience for renters. Newly released U.S. Census Bureau data confirms that SFR/BTR development continues to be robust and stable, with its annualized pace of construction in the first quarter of 2025 matching the previous quarter’s tally.
Articles
Tenant retention is a valuable — though sometimes elusive — contributing factor to the strength of a multifamily property. Nationally, 29% of multifamily households signed a third lease for the same unit, according to an analysis of the U.S. Census Bureau’s American Community Survey. Locally, renter turnover was lowest in major coastal markets, like New York City, and highest in transient renter markets, like Charleston, SC.