Articles
In a new video, Dr. Sam Chandan, a leading commercial real estate scholar, expands on the findings of Arbor Realty Trust’s latest Special Report, developed in partnership with Chandan Economics. He shares his expert insight into the state of rental housing in spring 2026. Chandan notes that multifamily is moving toward a state of balance as supply pressures ease and growth trends turn positive. The result, he said, is that selective opportunities are emerging for well-positioned investors in a climate “defined less by dislocation” and “more by normalization.”
Articles
Homeownership has been an aspiration of generations of Americans, but elevated prices, mortgage rates, and financing hurdles are complicating the typical path to owning a home. According to the Federal Reserve Bank of New York’s 2026 Survey of Consumer Expectations Housing Survey, renters are continuing to experience difficulty with mortgage financing and have more measured views about homeownership’s current investment potential. As households reassess the housing market, rental housing demand is the beneficiary.
Current Reports
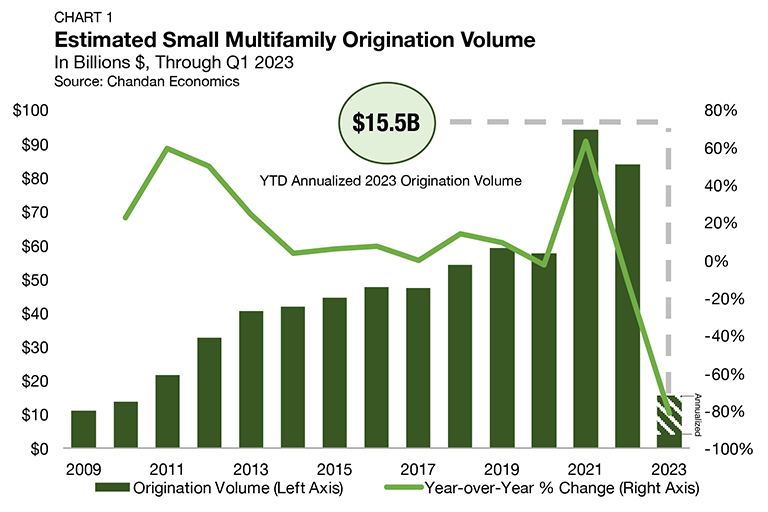
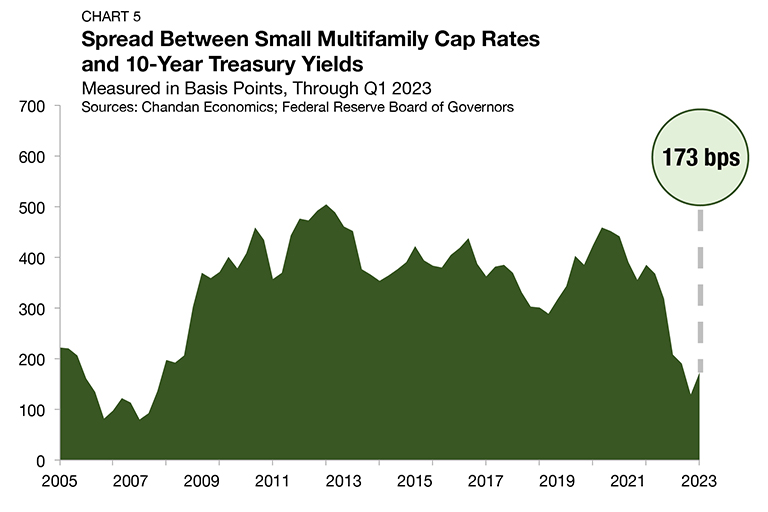
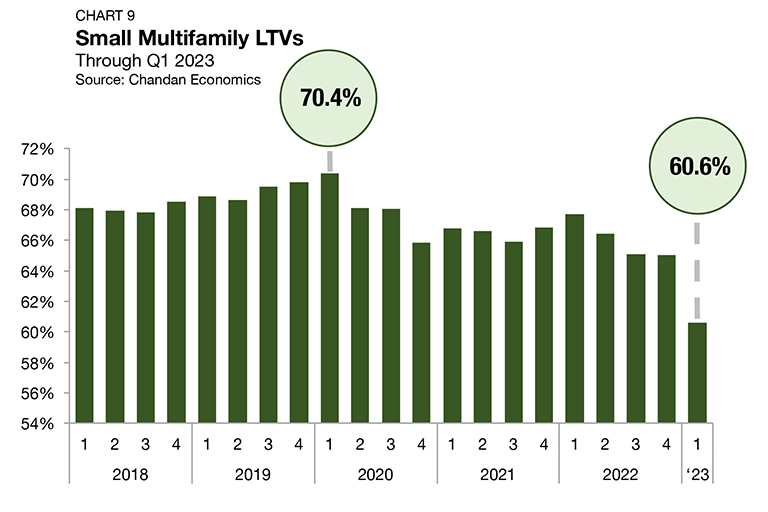
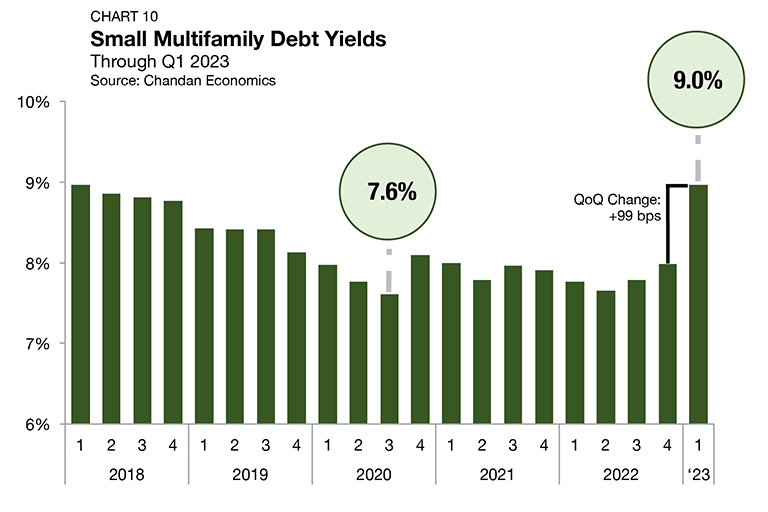
Arbor Realty Trust’s latest Small Multifamily Investment Trends Report, developed in partnership with Chandan Economics, evaluates what’s driving this sector’s ongoing stability as macroeconomic conditions remain mixed. Loan originations rose last quarter, and valuations are rebounding, signaling that normalization is taking hold.
Analysis
Over the past 12 months, the leading rent growth markets spanned multiple regions, each exhibiting distinct strengths and characteristics.
Articles
Labor market conditions are a foundational driver of rental housing demand, influencing tenant stability and household growth. While the national pace of hiring has moderated, the economies of many metropolitan areas continue to outperform. Expanding on Arbor’s latest Top Markets for Multifamily Investment Report, our research teams highlight the local dynamics supporting growth in several of the country’s strongest-performing multifamily markets.
Analysis
The U.S. multifamily sector continued to build momentum at the start of 2026. Rent growth moved into positive territory, and a moderating construction pipeline showed that vacancy may have reached its cycle peak.
Articles
Arbor’s track record of top finishes across multifamily agency rankings reflects the depth of our financing capabilities, the strength of our industry partnerships, and our disciplined, detail-driven approach to execution. Longstanding relationships with Fannie Mae, Freddie Mac, and the Federal Housing Administration (FHA) — built over many years of close collaboration — enable our team to deliver strong borrower outcomes across market cycles, reinforcing Arbor’s position as one of the top multifamily lenders in 2025.
Articles
Senior renters are increasingly choosing multifamily housing, with more than half now living in these rental properties, according to new data from the U.S. Census Bureau’s American Community Survey. Where they live — both by property type and by metropolitan area — provides insight into how housing preferences, local market conditions, and migration patterns shape rental housing demand.