Small multifamily assets have begun to settle into a consistent pattern of growth following two years of price corrections. Building on the findings of Arbor Realty Trust’s Small Multifamily Investment Trends Report Q4 2025, our research teams look more closely at recent pricing trends and the factors driving the turnaround.
Small Multifamily Investment Trends Report Q4 2022
Valuations Flatten as Cap Rates Start to Rise from Record Lows
Key Findings
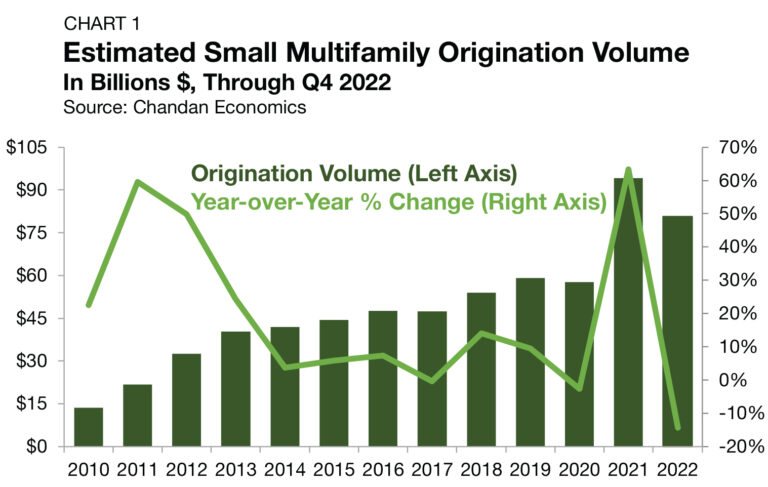
- Small multifamily originations reached $80.7 billion in 2022, the highest annual total after 2021’s record high.
- Cap rates inch higher from record lows, ticking up to 5.1%.
- Debt yields rise and loan-to-value ratios (LTVs) hold near post-pandemic lows as lending standards remain tight.
State of the Market
During a volatile 2022, the Federal Reserve’s ongoing monetary tightening cycle began to accomplish its intended goal. Inflation came down for six consecutive months through December 2022. Although slowing inflation has generated optimism, the central bank has stated that it may still need to raise interest rates again in 2023.
How changing economic conditions will impact the small multifamily sub-sector is only now beginning to become clear. The Mortgage Bankers Association’s 2023 forecast noted that cap rates appear “to be reflecting past market conditions that have changed significantly over recent months.” If elevated interest rates are sustained, commercial real estate pricing, including within the multifamily sector, is at risk of market fluctuations.
However, as noted in Arbor’s Special Report Spring 2023 by Arbor Chairman and CEO Ivan Kaufman and Sam Chandan, Founder of Chandan Economics, growing storm clouds in the multifamily sector are not reflective of any structural change in the profile of demand or supply but rather are a cyclical feature. Moreover, while multifamily and the small asset sub-sector are not immune from disruption, there are significant supporting factors that should limit distress. Debt underwriting standards have remained tight since the onset of the pandemic, which should curb the scope of mortgage defaults. Further, the structural undersupply of quality affordable housing options will continue to support tenant demand, and Fannie Mae and Freddie Mac will continue to buttress liquidity.
On balance, while the small multifamily sector remains in a fortified position entering 2023, it will likely feel reverberations from ongoing macroeconomic instability.
Lending Volume
The year-end 2022 estimate of new multifamily lending volume on loans with original balances between $1 million1 and $7.5 million — including loans for apartment building sales and refinancing — fell to $80.7 billion (Chart 1).
The 2022 estimate represented a 14.3% annual decline from 2021’s record high of $94.1 billion, which reached lofty highs on a wave of pent-up investment demand and the anticipation of monetary tightening. Looking ahead, Freddie Mac forecasts that overall multifamily origination volume will fall again in 2023, in the range of 4% to 5%.
Even as small multifamily originations came down significantly in 2022, they remained elevated compared to any year other than 2021. 2022’s originations total measured 40% higher than 2020’s mark and 36% higher than 2019’s pre-pandemic record high of $59.2 billion.
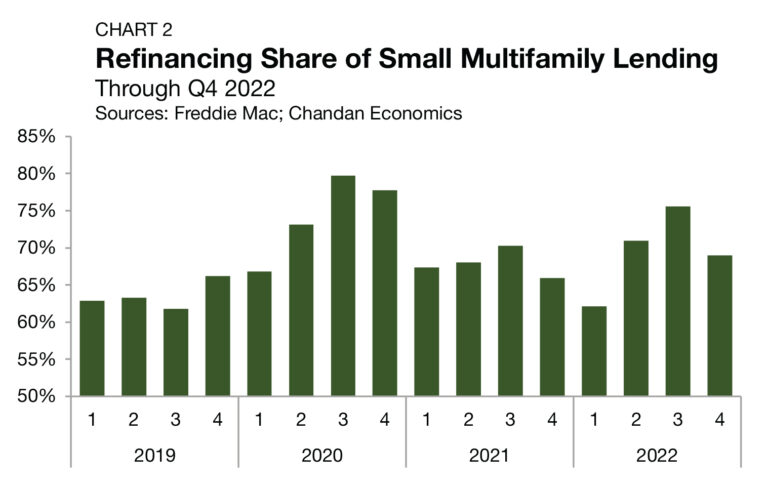
The resilience of refinancing activity is one factor that has kept small multifamily originations at an elevated level. During the fourth quarter, loans originated for the purpose of refinancing accounted for 69.0% of small multifamily lending activity (Chart 2), despite higher financing costs. For 2022 overall, refinancings accounted for 69.4% of small multifamily lending activity, up from 63.5% in 2021.
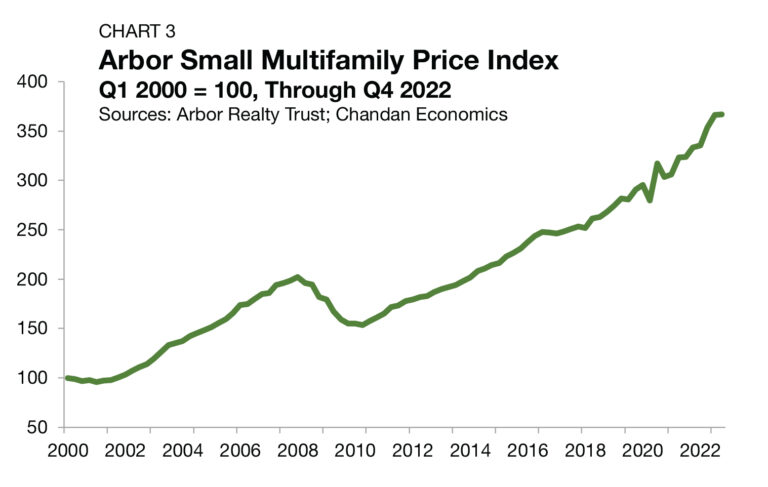
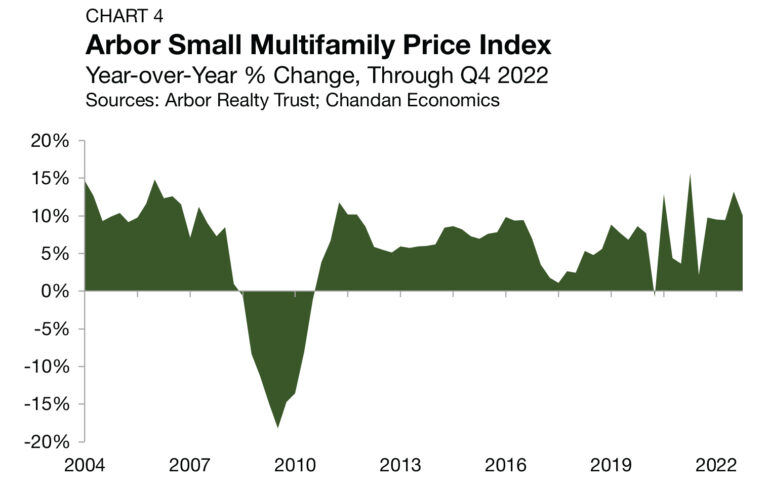
Arbor Small Multifamily Price Index
Multifamily properties, which have an average lease of one year, have demonstrated an ability to withstand inflationary pressures due to their positive cash flows. Still, benchmark interest rate increases in the year ahead will be critical for small multifamily pricing. If Treasury yields remain elevated, new multifamily buyers will increasingly require higher property-level yields — a condition that could be satisfied through either strengthening cash flows or declining asset values.
Cap Rates & Spreads
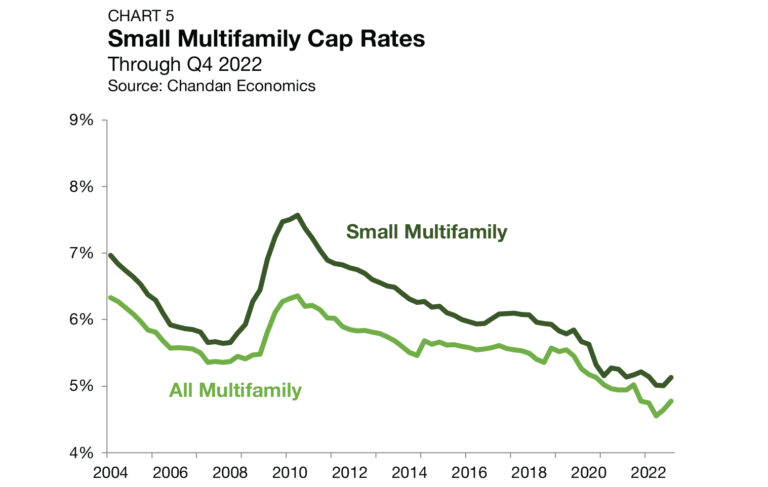
As benchmark interest rates climbed in 2022, an inflection in small multifamily cap rates seemed likely to follow. Even as the cost of capital reached its highest levels since before the 2008 financial crisis, small multifamily cap rates approached new all-time lows as recently as the third quarter of 2022. However, cap rates have now shown some sensitivity to softening economic conditions. National average cap rates for small multifamily properties climbed to 5.1% in the fourth quarter of 2022, rising 13 bps from the prior quarter (Chart 5). This was the largest single-period increase since 2009.
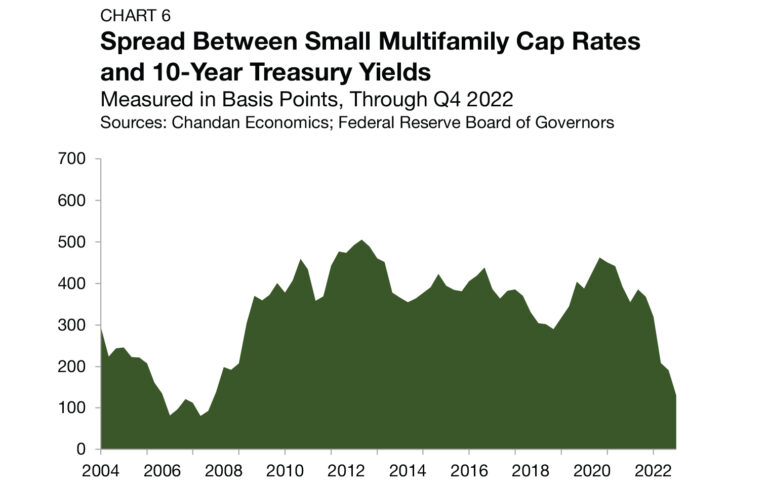
The small multifamily risk premium, a measure of additional compensation that investors require to account for higher levels of risk, is best measured by comparing cap rates to the yield on the 10-year Treasury. The average small multifamily risk premium fell in the fourth quarter of 2022, sliding down to 130 bps. Even as cap rates rose last quarter, Treasurys rose faster, causing this spread to narrow by a substantial 60 bps. At the end of the year, the small multifamily risk premium sat at its lowest level since the third quarter of 2007 (Chart 6).
Expense Ratios
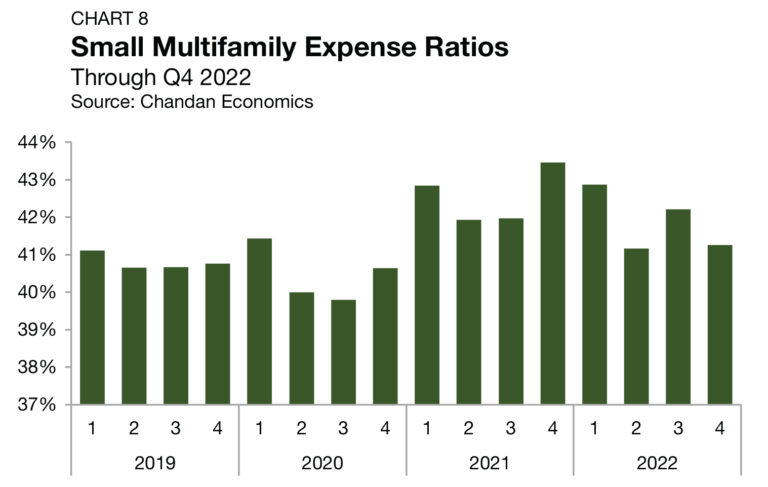
Expense ratios, measured as the relationship between underwritten property-level expenses and effective gross income, have increased over the past two years — reflecting that when operating costs surge, it still takes time for rent rolls to adjust. After rising to a high of 43.5% at the end of 2021, expense ratios improved in 2022, dropping 95 bps during the fourth quarter to finish the year at 41.3% (Chart 8).
Rent Collections
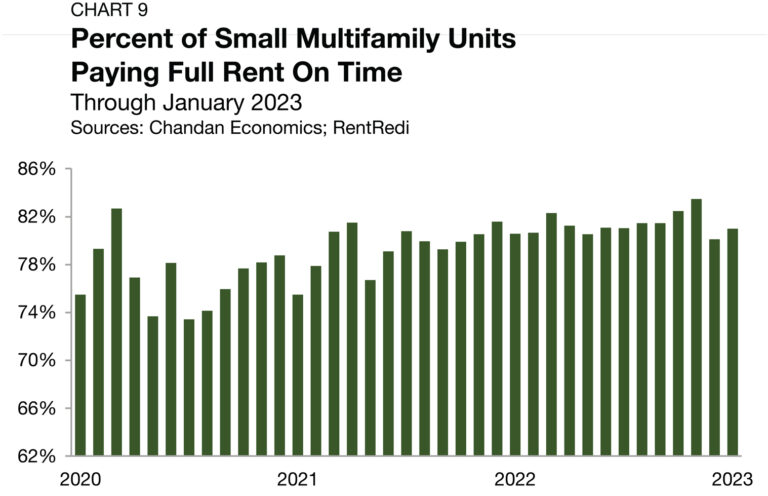
On-time rent payments in small multifamily properties remain at healthy levels. At the start of January 2023, an estimated 81.0% of units had paid their full rent on time — improving 89 bps from the month prior (Chart 9). After a brief dip during the pandemic, on-time payment rates have been above 80% for 15 consecutive months. Despite mounting economic anxiety and a bear market for equities, rental households have maintained their ability to pay rent. As a result, small multifamily owners’ property-level cash flows have built-in security.
Leverage & Debt Yields
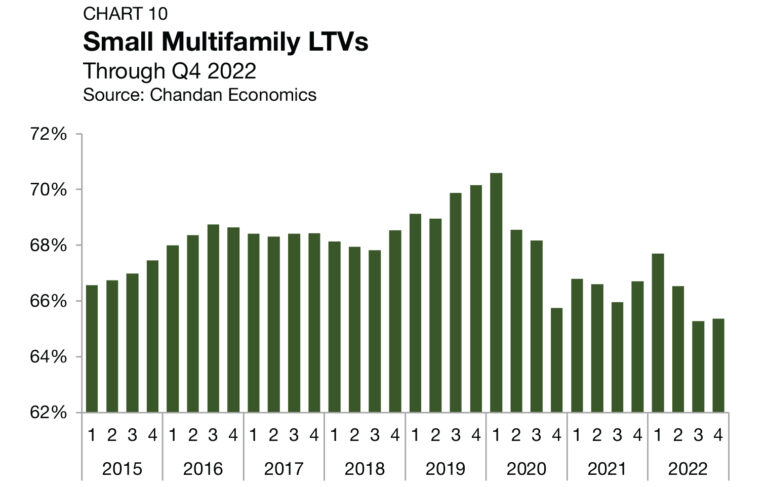
While the equity side of the capital stack is just now beginning to reflect the changing economic landscape, the debt side has been signaling the prudence of a conservative adjustment to risk-taking. LTVs have slid substantially this year as lenders have increased their risk requirements. While small multifamily LTVs did rise by 8 bps to land at 65.4% in the fourth quarter of 2022, they remain lower than at any point during 2020 and 2021 (Chart 10). Moreover, current small multifamily LTVs sit 234 bps lower than at the beginning of 2022 and 523 bps lower than their first-quarter 2021 peak (70.5%).
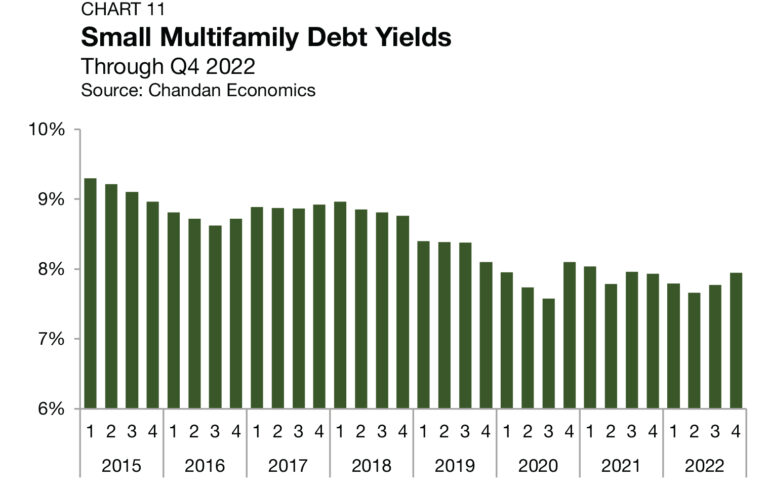
Debt yields for small multifamily loans averaged 7.9% in the fourth quarter of 2022, rising a substantial 17 bps from the previous period (Chart 11).
The inverse of debt yields, the debt per dollar of net operating income (NOI), fell for small multifamily loans. Small multifamily borrowers secured an average of $12.58 in new debt for every $1 of property NOI, down 28 cents from the previous quarter.
Outlook
The small multifamily sector remains in a resilient position heading into 2023, even as it faces cyclical challenges from a high-interest rate environment. The combination of a rent-by-necessity tenant base and declining access to affordable homeownership should continue to strengthen tenant demand. Balance sheet asset valuations are likely to show some sensitivity to higher interest rates. If Treasurys remain elevated, cap rates will need to rise to restore sufficient risk premiums. However, thanks to the strength of the labor market, renters have maintained their ability to pay their rent. As long as property-level cash flows remain stable, the scope of distress within the small multifamily sector should remain limited. While the year ahead may present challenges, the small multifamily sector boasts stabilizing fundamentals that should allow it to absorb business cycle headwinds.
For more small multifamily research and insights, visit arbor.com/articles
1 All data, unless otherwise stated, are based on Chandan Economics’ analysis of a limited pool of loans with original balances of $1 million to $7.5 million and loan-to-value ratios above 50%.
2 The Arbor Small Multifamily Price Index (ASMPI) uses model estimates of small multifamily rents and compares them against small multifamily cap rates. The index measures the estimated average price appreciation on small multifamily properties with 5 to 50 units and primary mortgages of $1 million to $7.5 million. For the full methodology, visit arbor.com/asmpi-faq.
Disclaimer
All content is provided herein “as is” and neither Arbor Realty Trust, Inc. or Chandan Economics, LLC (“the Companies”) nor their affiliated or related entities, nor any person involved in the creation, production and distribution of the content make any warranties, express or implied. The Companies do not make any representations regarding the reliability, usefulness, completeness, accuracy, currency nor represent that use of any information provided herein would not infringe on other third party rights. The Companies shall not be liable for any direct, indirect or consequential damages to the reader or a third party arising from the use of the information contained herein.


