Returns Fall and Volatility Rises Near U.S. Presidential Elections

- Monthly stock market returns fall an average of 0.72% to 0.32%.
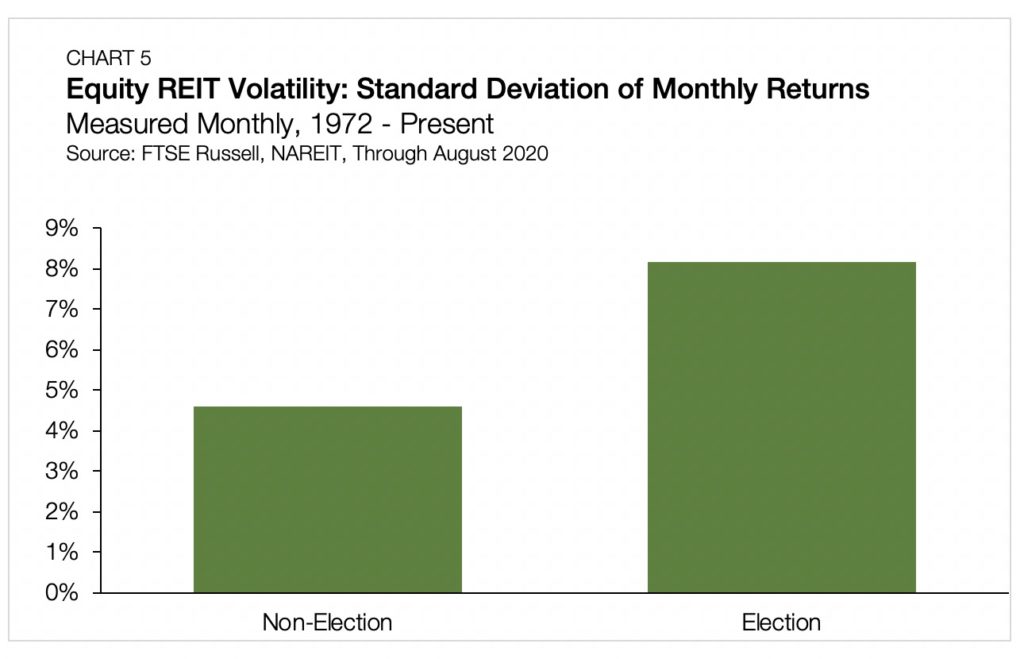
- Equity REIT monthly return volatility rises by approximately 77%.
- Monthly equity returns fall from an average of 1.06% to 0.55%.
Market Effects of U.S. Presidential Elections
The 2020 calendar year has already seen more than its fair share of volatility provoking events. Rising tensions in both trade and foreign policy relations provided markets with heightened anxiety even before the onset of the COVID-19 pandemic. Looking ahead to the upcoming U.S. presidential election, divisiveness and potential volatility seem likely to ensnare the country during the next few months.
This article attempts to quantify the observable market effects of the U.S. presidential elections throughout recent history. With specific attention to measures of volatility and returns across real estate and other public equities, this limited study finds evidence of lower average returns and higher levels of volatility in the immediate few weeks before and after general elections.
This inquiry looks at three indices: the CBOE’s VIX, the S&P 500 and NAREIT’s FTSE Equity REIT Index. To isolate the impact of a U.S. presidential election, which occurs on the second Tuesday of November, every four years, we assign a window of observation around the calendar month before, including and proceeding each qualifying date.
Extending the observation window to include these three months captures the most intense moments of national political attention, both leading up to and shortly following the general elections.
Chicago Board Options Exchange Volatility Index
The first measurement, and the most widely cited metric of stock market volatility, is the Chicago Board Options Exchange’s Volatility Index — or as it is more commonly known, the VIX. The VIX, which tracks the variance of options on the S&P 500, is a point-in-time forecast of near-term expected price fluctuations.
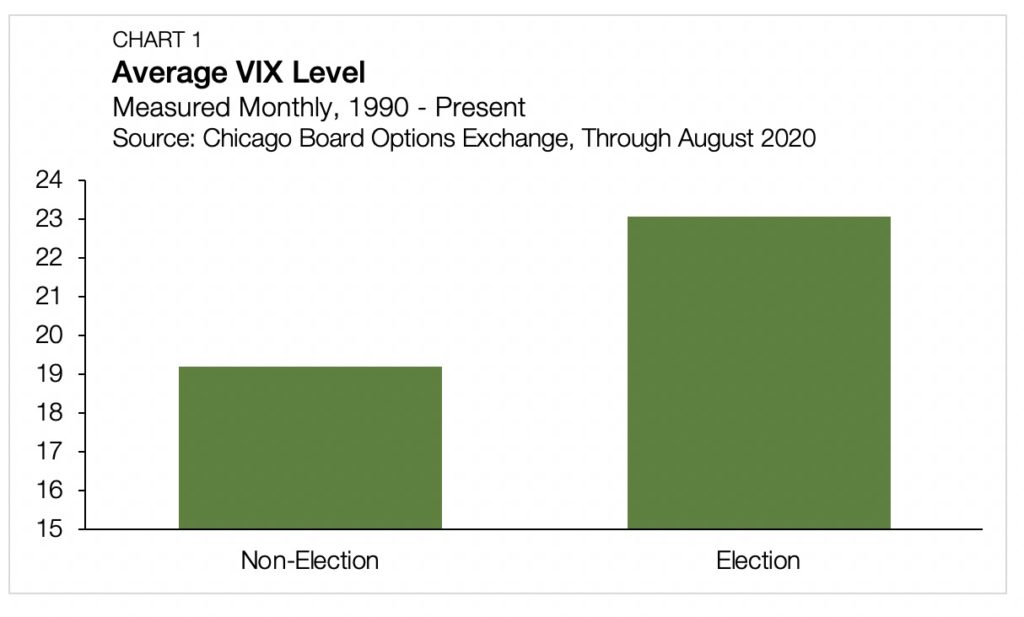
When the VIX rises, so do options prices, and the market expects more volatility. Dating back to 1990 when the CBOE first introduced the VIX, the index’s average level, excluding months near elections, stands at 19.2. Meanwhile, with near elections, the average VIX level rises to 23.0.
S&P 500 Index
Turning now to the S&P 500, we find that since 1972, the month-over-month index returns have averaged 0.72% during non-election periods. In the months surrounding a U.S. presidential election, these average returns are cut by half to 0.32%.
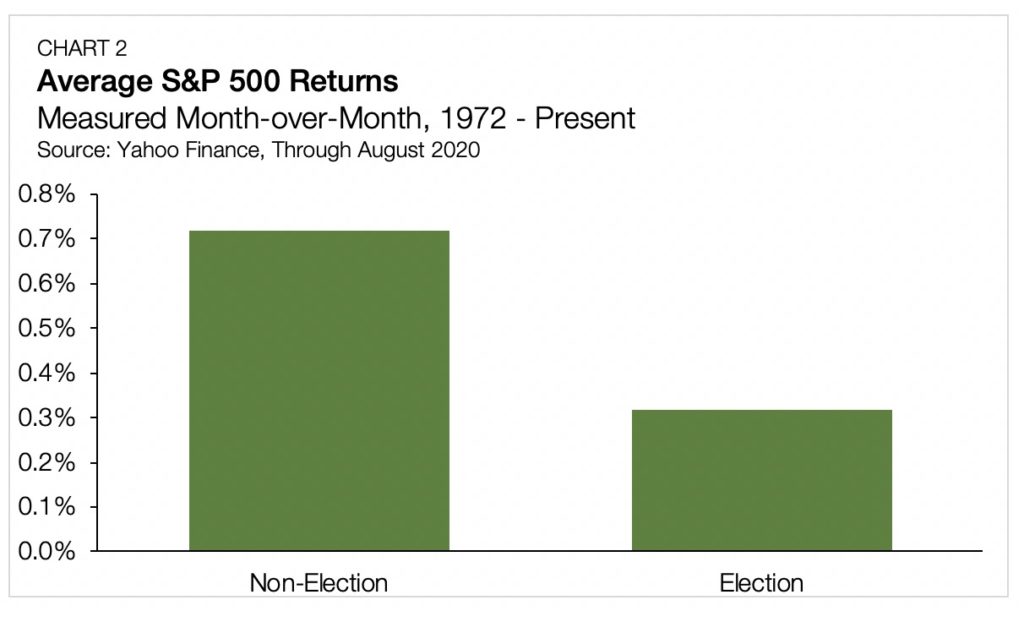
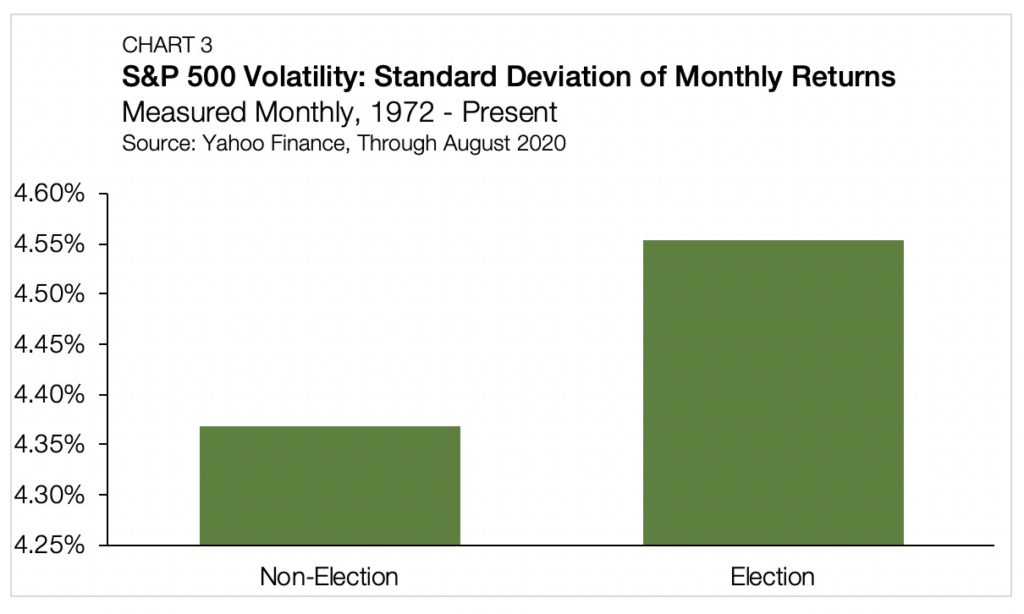
While the relative difference is significant, an important note to consider is how widely the observed returns vary around the mean. During non-election periods, there is a standard deviation of 4.37%.
In other words, while the average monthly return is 0.72%, roughly two-thirds of the observed monthly returns ranged between -3.65% and 5.09%. Given the variation that already exists absent the effect of an election, the 40 bps ballot box drop is slight in context and is well within the tolerance of expected price movements. At the same time, however, the standard deviation of returns during the election windows stands at 4.55%, suggesting that returns are not only lower near election dates, they also tend to be less predictable.
NAREIT FTSE All Equity REIT Index
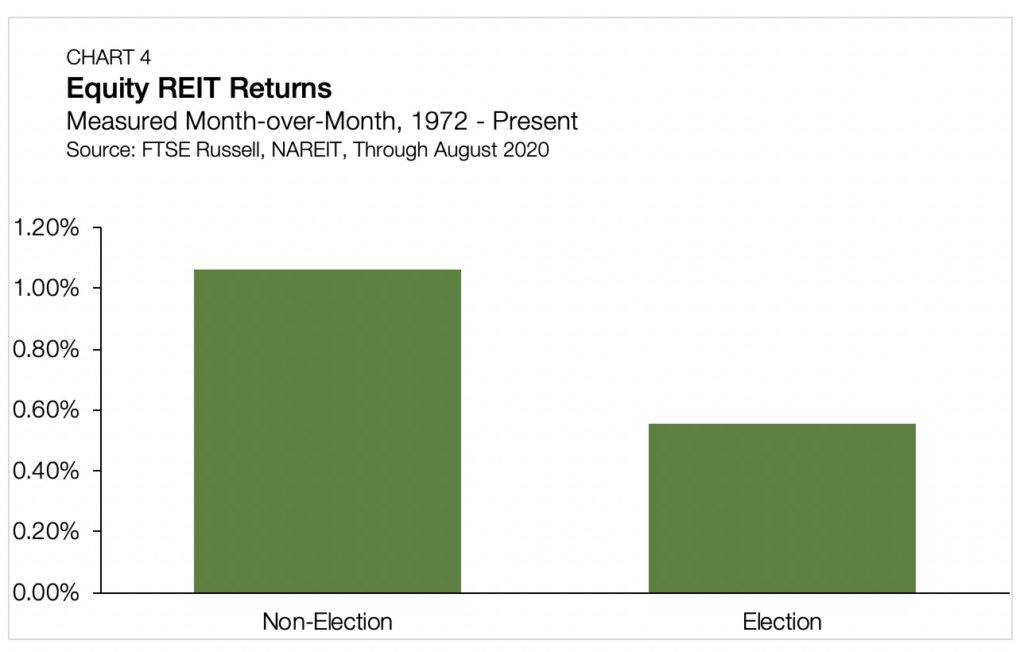
Narrowing in on the impact that elections have on commercial real estate, we utilize the NAREIT FTSE All Equity REIT Index. In months outside of our election observation window, monthly returns averaged a weighty 1.06%. During the election window, average monthly returns for REITs fall to 0.55%.
Once again, we utilize the standard deviation of the election and non-election returns, and we find familiar results. For equity REITs, monthly returns have a standard deviation of 4.61% when measured in a non-election period. As was the case for the S&P, the relatively low monthly returns for equity REITs during elections are within a single standard deviation of the mean from normal volatility levels. However, the equity REIT price volatility observed near elections sits in its own stratosphere, rising to 8.18% — an approximate jump of 77.4%.
In public equity markets where the valuations are assessed in real time, investors are continually gauging incoming news and amending their forward-looking expectations. Elections are a fulcrum in this regard. As competing visions of trade, tax and regulation become probabilistic future events, stock markets can swing on as much as a single pre-election poll.
Expect Lower Returns and Greater Volatility
These results suggest a tendency for returns in real estate and all public equities to trend lower while exhibiting more volatility near U.S. presidential elections. With election day rapidly approaching, market watchers may have to wait until 2021 for their stomachs to settle.
Read Arbor’s Chatter blog to stay informed on the multifamily investment market. Contact Arbor to speak with a specialist about our different loan programs to help you reach your business goals.

