Articles

LIHTC Program: An Impactful Affordable Housing Financing Resource

As renters face a national shortage of 7 million low-income rental homes, the U.S. Department of Housing and Urban Development’s (HUD) Low-Income Housing Tax Credit (LIHTC) program is pivotal in helping to close the affordability gap for renters. It is the nation’s most significant resource for affordable apartment housing construction, which gives state and local agencies approximately $10 billion in annual budget authority to issue tax credits for affordable housing development.

Articles

FHFA Loan Caps for 2025: What Multifamily Borrowers Need to Know

The Federal Housing Finance Agency (FHFA) announced a $3 billion boost to Fannie Mae and Freddie Mac’s volume cap for loan purchases in 2025 to $146 billion ($73 billion for each agency). This increase in FHFA loan caps for 2025 aligns with industry expectations, given the anticipation of improving market conditions and lending activity expected in a lower interest rate environment. Next year’s cap for the Government-Sponsored Entities (GSEs) is an increase of approximately 4% from the $140 billion limit set for 2024.

Analysis

U.S. Multifamily Market Snapshot — November 2024

The U.S. multifamily market held steady in a more normalized cycle through the first three quarters of 2024, following its skyrocketing recovery from the pandemic-related contraction. Rental demand remained strong, driven by the continued nationwide housing shortage and strong wage growth, while the high levels of new construction seen over the last two years appears to have peaked.

Current Reports

Small Multifamily Investment Trends Report Q4 2024

Small multifamily’s normalization pushed forward last quarter as the Federal Reserve made a long-awaited reduction to the target federal funds rate. Arbor’s Small Multifamily Investment Trends Report Q4 2024, developed in partnership with Chandan Economics, shows signs of stability have multiplied. Robust rental demand, a limited supply of quality affordable housing, and several other promising developments should support the subsector’s strength heading into 2025.

Analysis

Top U.S. Multifamily Rent Growth Markets — Q3 2024

The U.S. multifamily market held steady in a more normalized cycle during the third quarter of 2024. Rental demand remained strong, while new leaders emerged among the top markets for rent growth.

Articles

Top Markets for Wage Growth in 2024

One of the most essential factors multifamily investors need to consider before executing a transaction is the health of the local labor market. Wage growth and other trends are driven by a delicate, constantly adjusting balance of labor supply and demand. In some markets, an inflow of employers can cause wages to spike. In others, population outflows can create the same effect. In this deep dive, we expand on the data findings from the 2024 Top Markets for Multifamily Investment Report, exploring the unique conditions driving metro wage growth trends.

Press Contact

Press Contact If you are a member of the media and would like to arrange an interview with one of our knowledgeable multifamily and commercial real estate finance executives or if you have general media questions about Arbor, please contact us at [email protected] or through the below form.   Fill out the form to reach our press team.  

Current Reports

Top Markets for Multifamily Investment Report 2024

With interest rate pressure easing, quality multifamily investment opportunities have emerged from coast to coast, making identifying the optimal location essential. A roadmap for investors, Top Markets for Multifamily Investment Report 2024, developed in partnership with Chandan Economics, ranks the top 50 metropolitan markets found through an analysis of 10 key factors, including affordability, population growth, and climate risk.

General: 800.ARBOR.10

Affordable
Housing
Trends Report
Spring 2022

About This Report

First introduced in Fall 2021 and updated on a semiannual basis, the Arbor Realty Trust-Chandan Economics Affordable Housing Trends Report offers a wide-ranging lens into the critically important affordable and workforce housing sectors. The affordable housing market is a complex but vital part of the housing industry. 

This report series provides timely research and analysis that connects the many disparate data points into a single source for multifamily investors, owners, developers, and other industry stakeholders. The aim of the series is to provide a comprehensive and digestible primer for readers to better understand the major trends shaping the affordable housing market.

This series focuses on Affordable housing supported by government subsidies or tax incentives like the Low-Income Housing Tax Credit (LIHTC), and the Naturally Occurring Affordable Housing (NOAH) segment. It will address some of the significant changes observed both in terms of policy decisions and market dynamics, and describe some of the opportunities for investment and financing in the space. 

As Affordability Crisis Deepens, Policies and Market Shift in Support of Affordability

Key Takeaways

  • The Housing Choice Voucher program is receiving increased attention and funding. The proposed 2023 federal budget calls for a 17.4% increase in program allocations, and bipartisan lawmakers are pushing legislation to retain private landlords.
  • States are increasingly adopting new measures to encourage the development of affordable supply, including supplemental state-level low-income housing tax credits and updates to zoning codes to allow for higher-density residential construction.
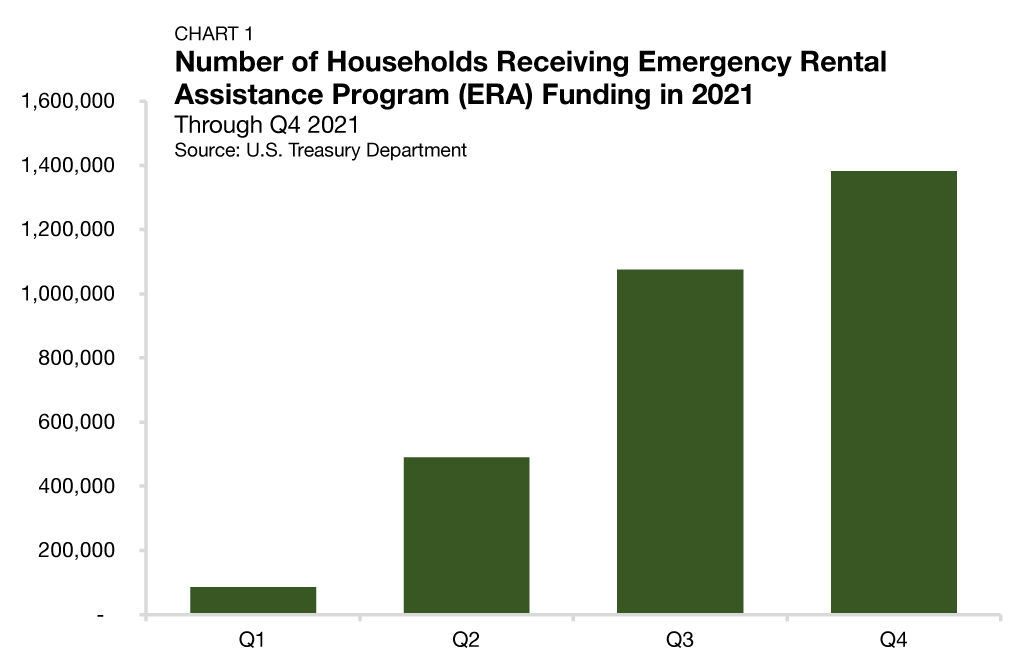
  • After the CDC’s eviction moratorium was struck down in August, evictions remained well below their pre-pandemic averages as Emergency Rental Assistance funding saw an accelerated rollout, supporting 1.4 million households in Q4 2021.

State of the Market

To understand the affordable housing market in Spring 2022, one needs to first assess how the sector weathered the pandemic and then assess the current state of housing affordability across the country.

Terms and Definitions
Source: U.S. Department of Housing and Urban Development; Tax Policy Center; Chandan Economics

When it comes to the pandemic response, federal policymakers proved effective at defusing a largescale increase in homelessness from financially insecure households. The Center for Disease Control and Prevention’s (CDC) eviction moratorium, while unpopular among industry advocates, prevented an estimated 1.6 million evictions, according to an analysis by Eviction Lab. After the Supreme Court struck down the federal moratorium in August 2021,1 the wave of evictions that many were forecasting did not immediately materialize. Nationally, tracked eviction filings ticked up but remained well below their prepandemic averages, according to Eviction Lab. A key reason why many at-risk renters have remained in their homes is the deployment of funds allocated in the Emergency Rental Assistance Program (ERA)— a funding pool designed to assist households that are unable to pay rent or utilities. The ERA Program was established as part of the Consolidated Appropriations Act of 2021, where it recived $25 billion in funding (ERA1), and then was reinforced with a second round of nearly $22 billion of funding (ERA2) in the American Rescue Plan. Through Q4 2021, ERA funding was supporting 1.4 million households, according to the U.S. Treasury Department (Chart 1)2

Despite expanding public and public-private responses focused on addressing affordable housing initiatives, including federal Affordable program expansions in the Consolidated Appropriations Act of 2022 and a growing level of lender participation, a structural affordability crisis still exists. The National Low Income Housing Coalition estimated that the U.S. had a shortage of 6.8 million affordable rental homes in 2021. According to U.S. Department of Housing and Urban Development (HUD), rental affordability took a significant hit due to the pandemic. Even as conditions have started to improve over the past year, the pace of rent increases around the country has kept HUD’s Rental Affordability Index well below where it entered 2020. 


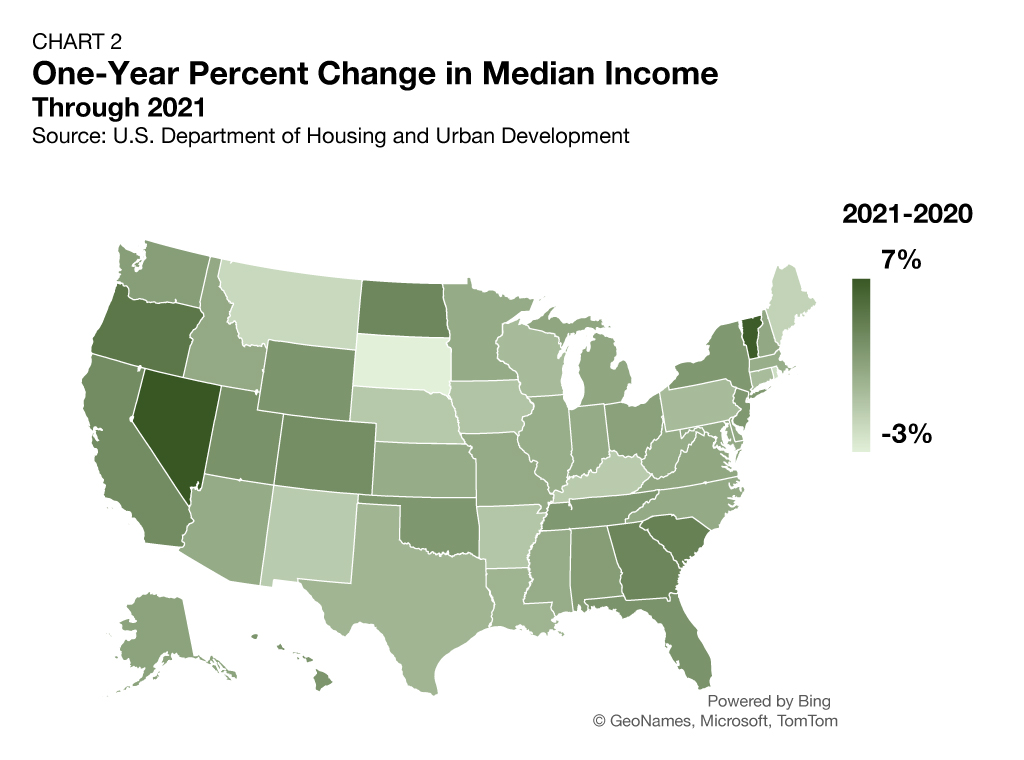
Housing affordability advocates are increasingly calling for an all-hands-on-deck approach to easing affordability. In their America’s Rental Housing 2022 Report, the Joint Center of Housing Studies of Harvard University (JCHS) outlined federal, state, and local policies needed to address the growing affordability gap. On the federal level, JCHS noted that policy “must not only support expansion of the subsidized stock, but also make it possible for private developers to build affordable units.” Large increases in area median incomes (AMI) across the country should offer some relief to Affordable developers, allowing for increased project feasibility on the margin (Chart 2). However, increased public support for the private creation of new affordable housing supply is necessary. According to the National Low Income Housing Council, “without public subsidy, the private market is unable to produce new rental housing affordable” to low income households as the rents in these units are unable to cover development costs.

Affordable housing policy is growing in both scope and ambition. The enacted 2022 Federal Budget allows for an 8.9% increase in HUD funding, and the 2023 budget proposal released March 28th calls for another aggressive expansion (+9.4%). The bipartisan Choice in Affordable Housing Act of 2022, which was introduced in the U.S. House of Representatives this past March offers a mechanism for retaining private landlords in the Housing Choice Voucher program. Additionally, many states are increasingly turning to updates in zoning codes to allow for more naturally occurring affordable housing development. All else equal, policy responses across all levels of government are ramping up as the market need is both substantial and growing. 

Number of LIHTC Units in Service Declining

The single-largest Affordable housing program that directly addresses supply is the LowIncome Housing Tax Credit (LIHTC). It comes in two forms: a 9% tax credit to incentivize new Affordable development and a 4% tax credit for the rehabilitation and preservation of Affordable supply. According to the National Housing Preservation Database, LIHTCs collectively support roughly 2.5 million rental units.


The number of new low-income units placed into service under the program topped out at 126,796 in 2007. Since then, the number of new units placed into service fell in nine of the next 12 years, gradually sliding to 42,895 new units through 2019 — a 66% drop from its peak (Chart 3).3

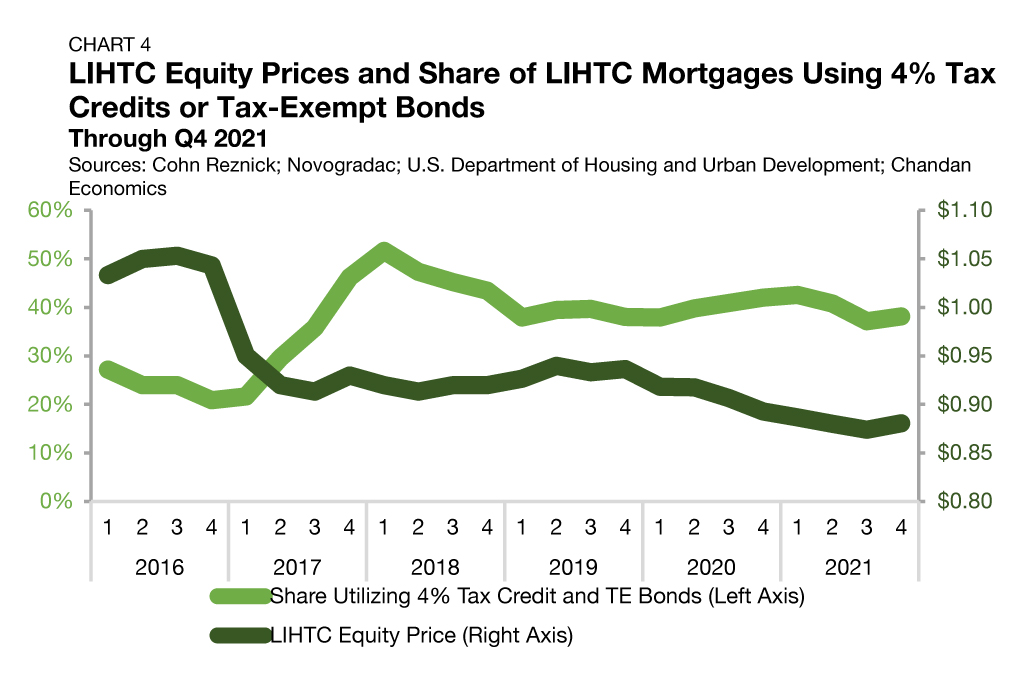
After the 2016 election, the LIHTC equity price per credit dropped from $1.04 to $0.95, as investors anticipated and eventually received a decrease in tax liabilities (Chart 4).4  After stabilizing near $0.93 between 2017 and 2019, LIHTC equity prices started gradually compressing again in early 2020. Through the fourth quarter of 2021, LIHTC equity prices averaged $0.88 per credit, according to Cohn Reznick’s LIHTC Equity Pricing Trends data.

The dropoff in LIHTC equity prices between fourth-quarter 2016 and third-quarter 2017 meant that Affordable developers could not raise as much project capital by trading their tax credits. As a result, the adoption of a 4% LIHTC for rehabilitation became more attractive than the 9% LIHTC for ground-up development.


Between the first quarter of 2017 and the first quarter of 2018, the share of new mortgages on LIHTC properties utilizing the 4% tax credit surged from 22% to 52%. The tax credit became more attractive after the December 2020 passage of the Consolidated Appropriations and Recovery Act, which established a minimum 4% floor on the applicable federal tax credit rate for tax-exempt multifamily housing private activity bonds (PABs). The minimum floor made the 4% tax credit more valuable and increases how much funding developers can raise to finance Affordable construction. Through fourth-quarter 2021, the share of LIHTC mortgages utilizing the tax credit was 38%. While this share represents a retrenchment from the first-quarter 2018 of 52%, but still elevated from the levels seen through all of 2016 and much of 2017.


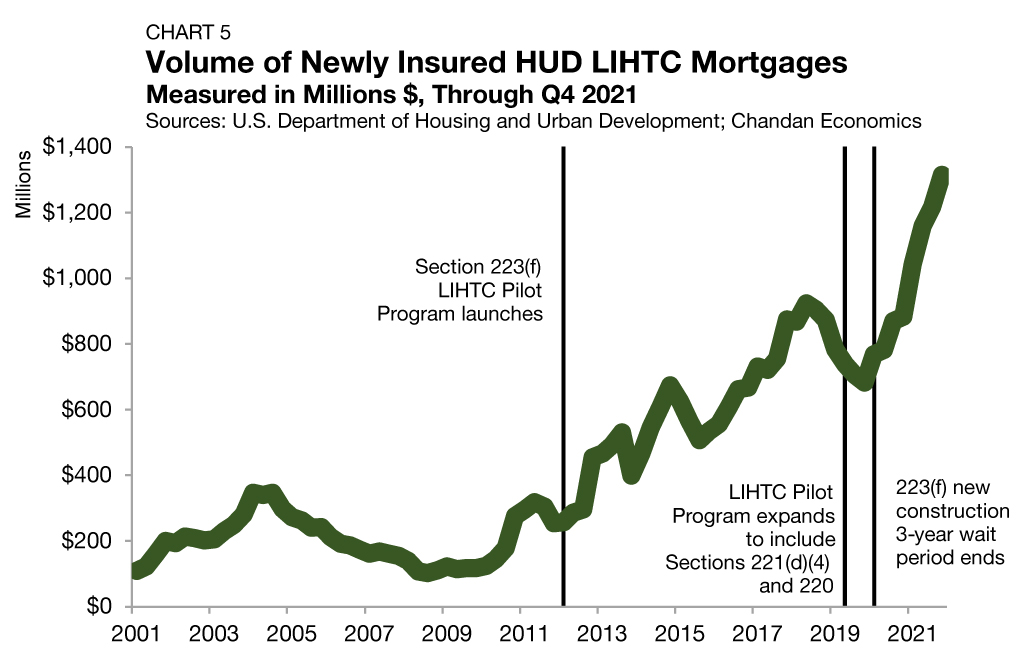
Despite the slowdown in new units placed in service utilizing LIHTC, the dollar volume of newly issued mortgages utilizing LIHTC covered under insurance from the U.S. Department of Housing and Urban Development (HUD) is accelerating. According to HUD’s Insured Multifamily Mortgages Database, the dollar volume of newly HUD insured LIHTC mortgages grew substantially post-Great Recession, from a quarterly average of $254.7 million in 2011 to $1.3 billion in 2021 (Chart 5).As of the rolling four quarter period ending in fourth quarter 2021, the volume of HUD insured LIHTC mortgages grew by 49%. Directionally, these data line up with Cohn Reznick’s tracking of the LIHTC market’s annual equity volume, which reached an estimated $22.4 billion in 2021—a 22% increase from the year before.

The increase in total mortgage volume has been driven, in part, by structural forces, namely HUD’s policy and procedures. HUD’s most substantial change was the launch of its LIHTC Pilot Program in 2012. The Pilot Program initially allowed for higher per-unit rehabilitation costs under Section 223(f) and streamlined mortgage application requirements, resulting in quicker approval timelines. From 2012 to 2018, HUD’s loan volume of LIHTC transactions increased from 5% to 34%, according to Novogradac. Updates to the program in 2019 included allowing substantial rehabilitation and new construction (9% LIHTC) under the 221(d)(4) and 220 loan programs. These changes made a majority of LIHTC transactions eligible for HUD insured mortgage financing.


With investor demand for LIHTCs dramatically exceeding the supply of available credits, states are increasingly adopting supplemental tax credits for new Affordable construction to fill the void. Last year, Arizona became the 23rd state to introduce a state-level low-income housing development program. Five other states (Iowa, Kansas, Kentucky, North Carolina, and Ohio) currently have pending legislation to introduce similar versions of the program.


In addition to the supplemental tax credits at the state level, there is growing support for increasing the program’s reach by adjusting the current law. Under current law, the owner of a development project is generally eligible to claim tax credits that do not count towards a housing agency’s LIHTC volume cap, so long as the new development is being financed by 50% or more with tax-exempt private activity bonds. Lowering this “financed-by” threshold to something lower than 50% allows for more development projects to qualify for these credits. The National Council of State Housing Agencies conducted an analysis with Novogradac and found that by lowering this threshold, up to 1.5 million additional affordable rental homes could be created this way if the threshold were halved.

Housing Choice Voucher Program Accounts for Majority of Units

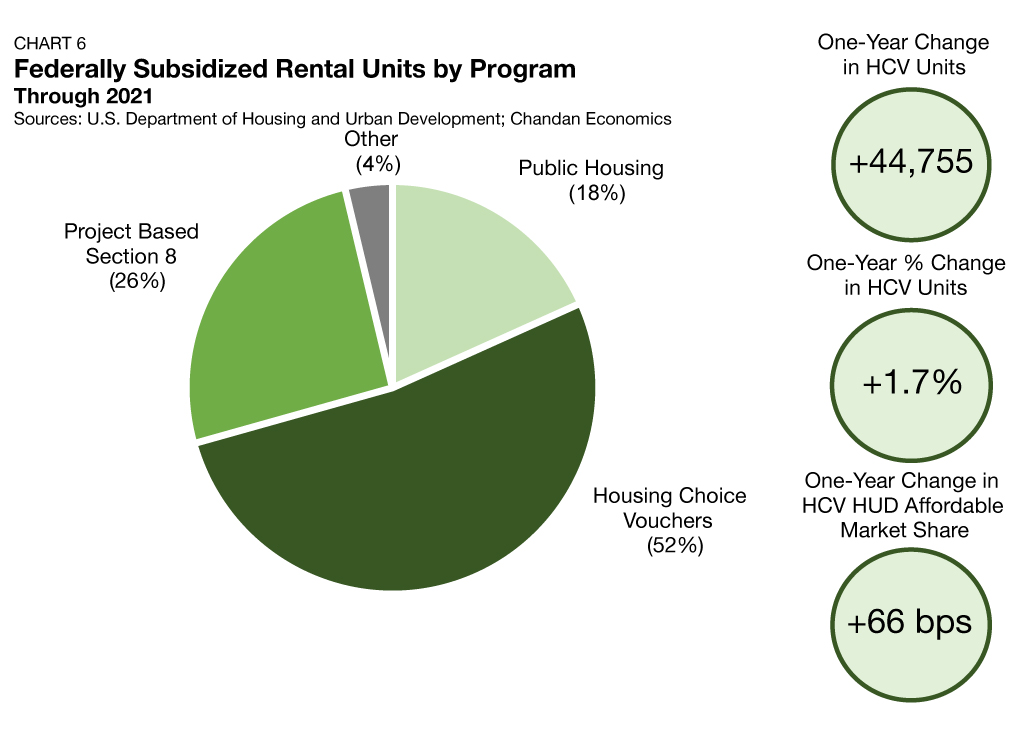
While LIHTC is the largest supplyside affordable housing program, the Housing Choice Voucher (HCV) program is the largest overall, accounting for 2.7 million units.6 As a share of all federally subsidized rental units, the HCV Program accounted for 52% last year, a rise of 66 basis points (bps) from 2020 (Chart 6). The next largest program by unit count, Project Based Section 8, is a distant second, accounting for 26% of federally subsidized units.

The HCV program is primarily a form of tenant-based rental assistance, where renter families spend 30% of adjusted monthly income on rent, and the balance is covered through subsidy. The policy focus of the HCV program is on assisting very low-income households. The average household income for HCV renters in 2021 was just $15,577—increasing a slight 2.4% year-over-year, though failing to keep pace with inflation by a significant margin.


HUD’s policy guidelines dictate that 75% of new families admitted into the program must earn at most 30% of the local area median income (AMI). The balance of admitted families may earn up to 80% of AMI. HCVs are widely supported by private-market advocates. Unlike tools such as rent control that place the burden of the subsidy on the landlord, HCVs interact openly in a market setting. Moreover, a renter household retains their subsidy should they choose to move, encouraging positive housing mobility.


While the HCV program is the majority of the federally subsidized rental universe, it has expanded slowly in recent years, failing to keep pace with growing market needs. Between 2015 and 2020, the number of units covered under the program expanded annually between 0% and 2%. However, some meaningful progress is underway. While Congress failed to authorize the full $68.7 billion for HUD’s annual budget requested by the Biden Administration, it did greenlight a significant $5.34 billion increase (+8.9%) from the 2021 appropriations, bringing HUD’s 2022 budget up to $65.7 billion. The HCV program will receive an additional $1.6 billion (+6.2%) in funding this year compared to 2021, accounting for 30% of the total HUD budget increase.


On March 1, 2022, a group of bi-partisan congresspersons, introduced a bill titled the “Choice in Affordable Housing Act.” The resolution focuses on the HCV program, and seeks to address declining private-landlord participation. According to a press release from Representative John Katko (R-NY), who introduced the bill with Emanuel Cleaver (DMO), the Act would reform the HCV program “by providing grant funding that allows local Public Housing Agencies […] to offer landlords strategic incentives to accept vouchers and conduct recruitment efforts with local property owners. The bill would also remove burdensome property inspection regulations and allow more vouchers to be used in higher-opportunity neighborhoods.” Both the National Multifamily Housing Council and the National Apartment Association are firmly supportive of the house resolution, claiming it has the power to move the needle for the efficacy of the HCV program.

Naturally Occurring Affordable Housing Units Climb Above 80%

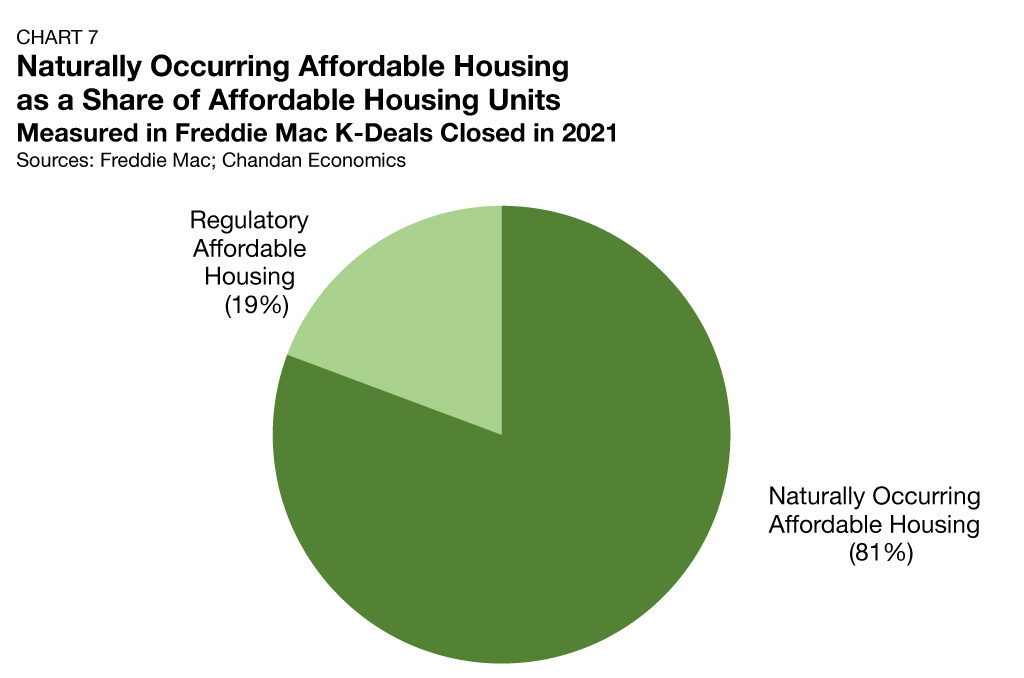
While most of the attention paid to the affordable housing sector focuses on regulation and policy intervention, the naturally occurring affordable housing (NOAH) supply is proportionally more significant. For Freddie Mac multifamily loans originated in 2021, 81% of the units affordable at 80% or below of local AMI are NOAH properties (Chart 7).7 These data align with previous estimates that suggest NOAH units account for about three-quarters of all of the affordable housing supply.

Increasingly, state governments are grappling with the use of zoning codes as a policy tool to influence the creation of NOAH supply. Many states are taking approaches similar to that of Oregon, which in 2019, moved to codify the allowance of duplexes in cities with more than 1,000 residents and four-family dwellings in all cities with more than 25,000 residents. Arizona is the latest state to push a zoning overhaul, introducing legislation in February 2020 that, if passed, would override some stringent local codes, allowing for more residential construction.


Conversely, the use of rent control policies at the state and local levels continues to be popular— a tool that industry housing advocates and economists strongly oppose because of its supply-limiting effects. St. Paul, Minnesota passed rent control legislation in November 2021, and new construction in the metro has declined by more than 80% in the lead up to its implementation. According to a January 2022 NMHC Survey, 58% of multifamily investors are actively reducing or avoiding investments in rent control markets and another 15% are considering reducing their investments.

What to Watch

As we move further into 2022, attention will increasingly shift to the White House’s proposed 2023 budget. According to a Novogradac analysis, the proposal calls for raising HUD’s annual budget to $71.9 billion— a $6.2 billion increase from the enacted 2022 budget. A majority of the proposed increase in funding would be earmarked for a sizable 17.4% (+$4.8 billion) expansion of the Housing Choice Voucher program.


Beyond the anticipated discretionary budget request, the 2023 proposal also calls on a one-time spend of $40 billion for housing and community development requests to be overseen by HUD and the U.S. Treasury’s Community Development Financial Institutions Fund.


Elsewhere in Washington, D.C., there are pending legislative reforms with the potential to strengthen the country’s ability to maintain and add affordable rental housing. In addition to the previously discussed “Choice in Affordable Housing Act,” on March 28th, 2022, Senators John Thune (R-SC) and Jerry Moran (R-KS) introduced the “Housing Supply Expansion Act.” The bill, which could ease both labor and administrative costs in the construction process if passed has gained the support of industry groups.


According to a 2021 Pew Research Survey, 49% of all Americans believe that affordable housing in their local area is a major problem— up from 39% in 2018.8 Further, there is a growing sense of priority tracked across all age groups, races, genders, income brackets, education levels, geographies, and political affiliations. With home prices and apartment rents pressing to new highs, it is likely that the affordability crisis will continue to get worse before it gets better. At the same time, 2022 marks a unique moment where policymaking priorities, public sentiment, and investment appetites are aligned— providing some hope that this year could be a true turning of the tides.

For more affordable housing research and insights, visit arbor.com/blog

1 While the CDC’s eviction moratorium was lifted, many states still had state-wide moratoria in place in and after August 2021.

2 The Displayed Number of Households displays include both ERA1 and ERA2 funding.

3 These data are released by the U.S. Department of Housing and Urban Development (HUD) and can be retrieved here. According to HUD, 2020 data are scheduled for release in Spring 2022.

4 LIHTC Equity Pricing Trends are calculated as a quarterly series by Chandan Economics. 4% LIHTC usage is displayed as a four-quarter moving average. Novogradac data are utilized from Q1 2016 through Q4 2019. Cohn Reznick data are utilized Q1 2020 through Q4 2021.

5 Data presented in Chart 5 are displayed as a four-quarter moving average based on the date of initial endorsement.

6 Total is based on data retrieved from HUD’s Office of Policy Development and Research; Data are through 2021.

7 According to a Chandan Economics analysis of Freddie Mac K-Deals

8 An additional 36% of respondents in 2021 indicate that affordable housing is a minor problem in their local area.

Disclaimer All content is provided herein “as is” and neither Arbor Realty Trust, Inc. or Chandan Economics, LLC (“the Companies”) nor their affiliated or related entities, nor any person involved in the creation, production and distribution of the content make any warranties, express or implied. The Companies do not make any representations regarding the reliability, usefulness, completeness, accuracy, currency nor represent that use of any information provided herein would not infringe on other third party rights. The Companies shall not be liable for any direct, indirect or consequential damages to the reader or a third party arising from the use of the information contained herein.