From the Ground Up: How Development Costs Shape the SFR Sector’s Geography
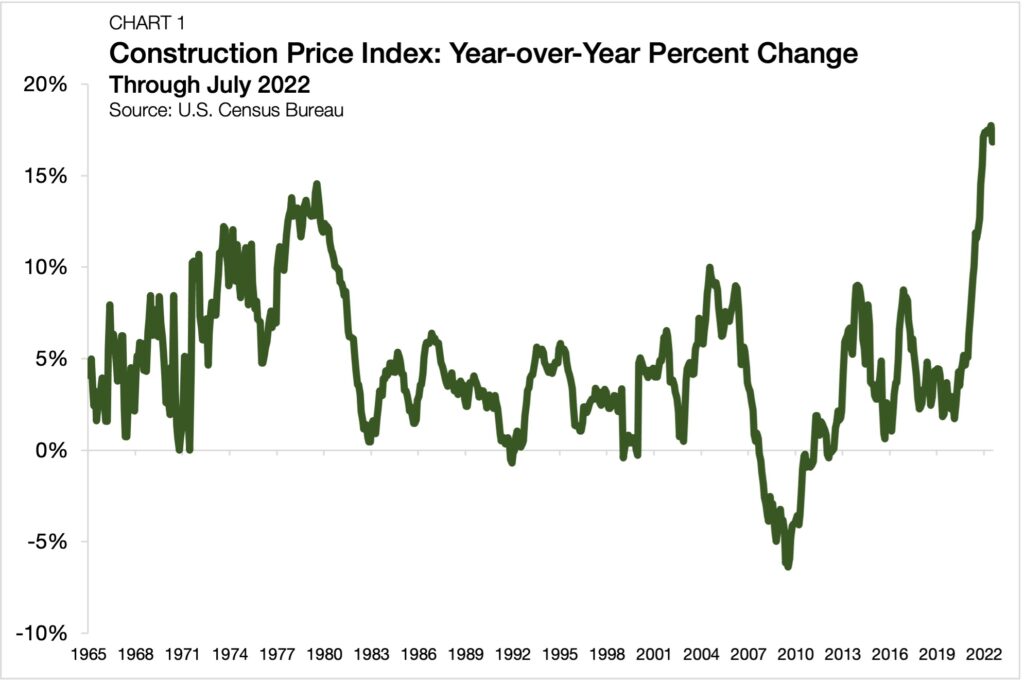
- Construction prices for single-family homes are up nearly 17% from a year earlier.
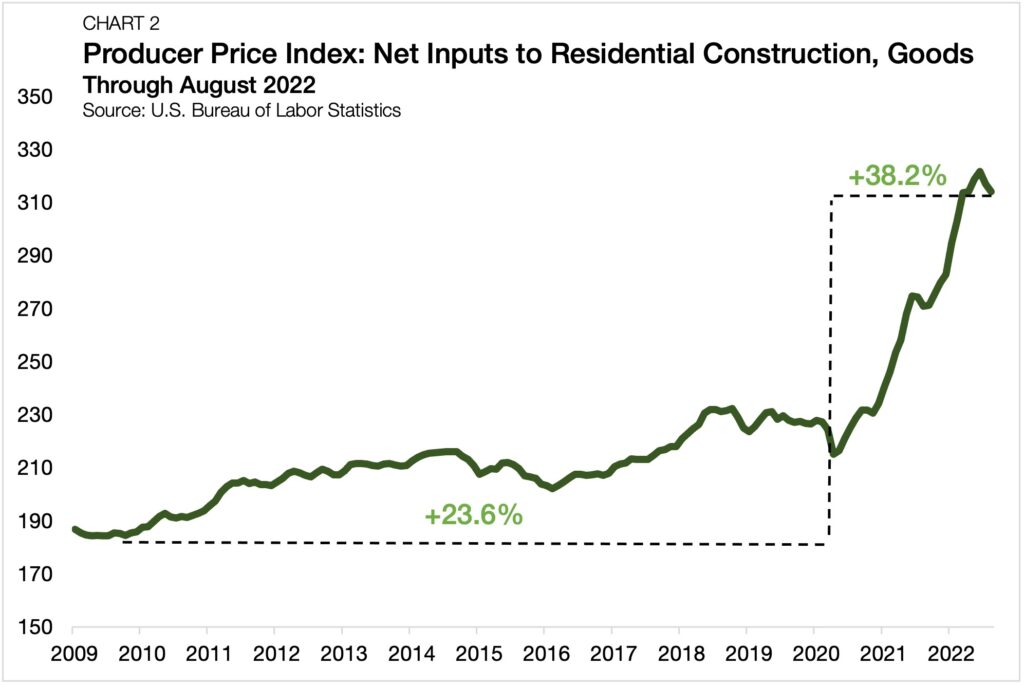
- Prices of physical inputs for construction have risen by more since 2020 than they did in all of the 2010s.
- Land and labor costs vary widely by region, so SFR developers are utilizing market selection and small property buildouts to manage costs.
In the aftermath of the 2008 financial crisis, investors scooped up large portfolios of distressed single-family homes, kicking off a wave of institutional investment that has continued through today. However, as the housing market recovered, investors building portfolios of single-family rental (SFR) assets faced stiffer buyer competition. As a result, new construction has enabled the single-family rental sector to grow at scale. For the 12 months ending in March 2022, SFR starts were up 33% from a year earlier, reaching a new all-time high. But with homebuilding prices on the rise, SFR developers have begun to adopt new strategies, such as market site selection and smaller property buildouts, to curb construction costs.
SFR Construction Costs Climb to Record Levels
Construction cost price growth reached unprecedented levels over the past year. According to U.S. Census Bureau’s new construction price index for single-family properties, costs were up 16.8% from one year ago, as of July 2022 (Chart 1). Between 1965 and 2020, single-family construction prices never grew by more than 15% annually. Since November 2021, price growth has registered above 15% in every month.
A Perfect Storm of Pressures Push Costs Higher
The past year has seen a perfect storm of unique pressures, causing residential construction prices to soar. The three major costs by category, land, labor, and materials, all saw significant increases.
For the 12 months ending August 2022, 1.3 million new private single-family homes started construction. Before 2021, the last time that there was as much new single-family construction was in 2007. The run-up in development activity has exerted upward pressure on the price of developable land. According to a National Association of Home Builders (NAHB) analysis of U.S. Census Bureau data, the median price of a development lot rose to $55,000 in 2021 — a new all-time high.
Driven by supply-chain disruptions, materials backlogs and shortages have also caused the price of new development to rise. The volatility of lumber prices has garnered a lot of attention in the past year, but other key construction inputs, including concrete, gypsum, and electrical components, are still pushing historic annual increases. According to the U.S. Bureau of Labor Statistics Producer Price Index, the cost of physical inputs used in residential construction are up by 38.2% from their pre-pandemic levels (Chart 2). These figures compare substantially higher than price changes during the past cycle. Between the end of the Great Recession in 2009 and the start of the pandemic, these physical input prices grew by 23.6% in total. Further, single-family development labor costs are up 32.0% since the start of the pandemic.
All these factors together have brought the median sale price of a new home in the U.S. to $439,400 through July 2022, up 8.2% from one year ago and 32.4% since the start of the pandemic.
SFR Developers Identify Cost-Cutting Efficiencies
When it comes to the development of new homes, there are several ways that large-scale SFR developers achieve cost-cutting efficiencies in construction. Some of these include lower financing costs, economies of scale using vertical integration, smaller unit buildouts, and an adherence to a strict site selection criterion.
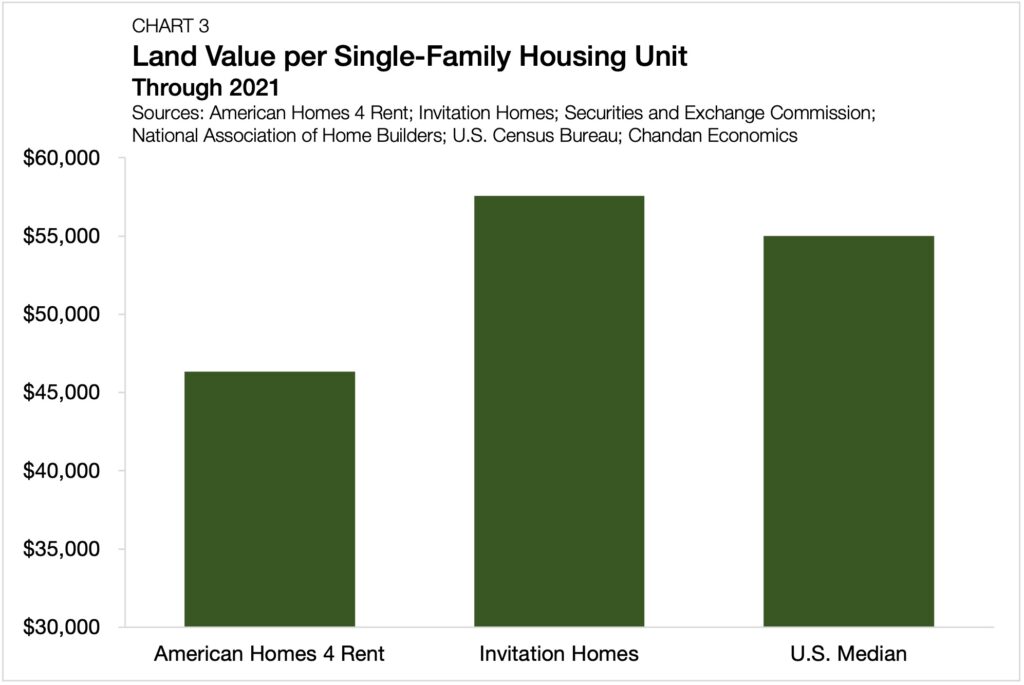
According to SEC filings for American Homes 4 Rent and Invitation Homes, large-scale SFR operators that engage in ground-up development have been achieving critical efficiencies. American Homes 4 Rent, the nation’s largest public SFR operator that builds dedicated rental communities, had an average land value per unit of $46,331, 16% less than the NAHB reported median (Chart 3). Meanwhile, Invitation Homes, the nation’s largest non-developer single-family operator, had an average land value per unit of $57,568, only slightly above the NAHB median estimate.
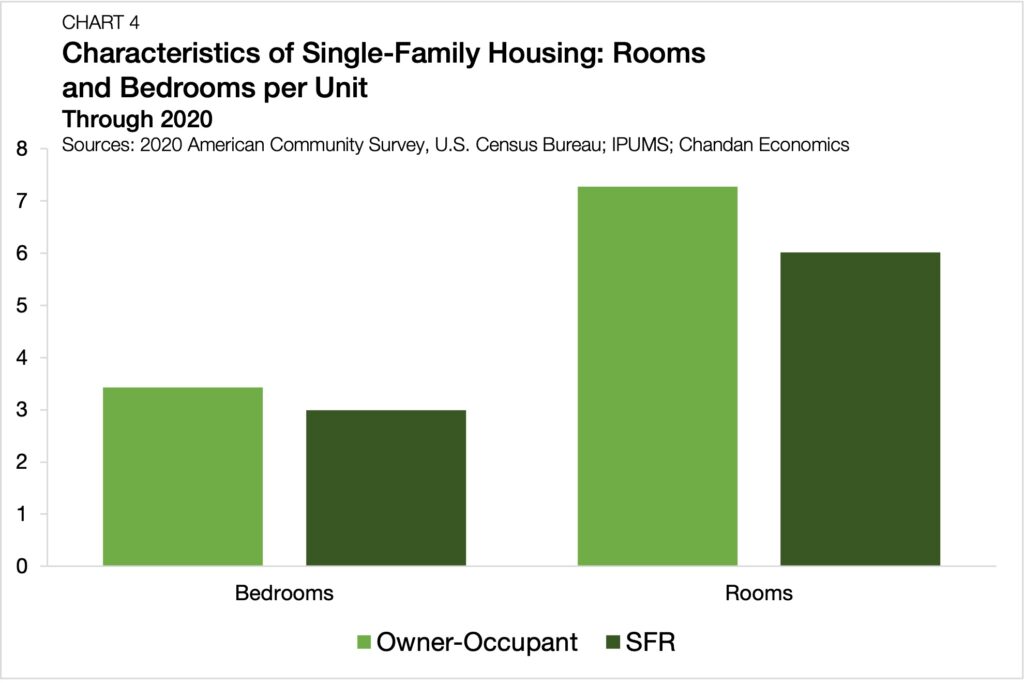
Beyond the value of land, there is also evidence that single-family properties that are used as rentals have smaller buildouts than units with owner-occupants. According to the 2020 American Community Survey, SFRs had an average of 0.4 fewer bedrooms and 1.3 fewer rooms in the home overall compared to owner-occupied units (Chart 4).
Regional Development Costs Differ Dramatically
One of the more significant advantages institutional operators have in the development process is the ability to adhere to a strict market selection process. Unlike local or even regional developers, developers with national footprints have the ability to mobilize resources and build networks, making strategic site selection possible.
It is no secret that the Sun Belt, specifically the Southeast, has become the epicenter for institutional investment in the SFR sector. More than 80% of America Homes 4 Rent’s portfolio is in the Sun Belt, with Atlanta (5,498 units), Dallas (4,320 units), and Charlotte (3,897 units) standing as the most prominent hotspots.[1] Tricon Residential, another major SFR operator, is concentrating its purpose-built communities in ten MSAs, all in the Sun Belt.
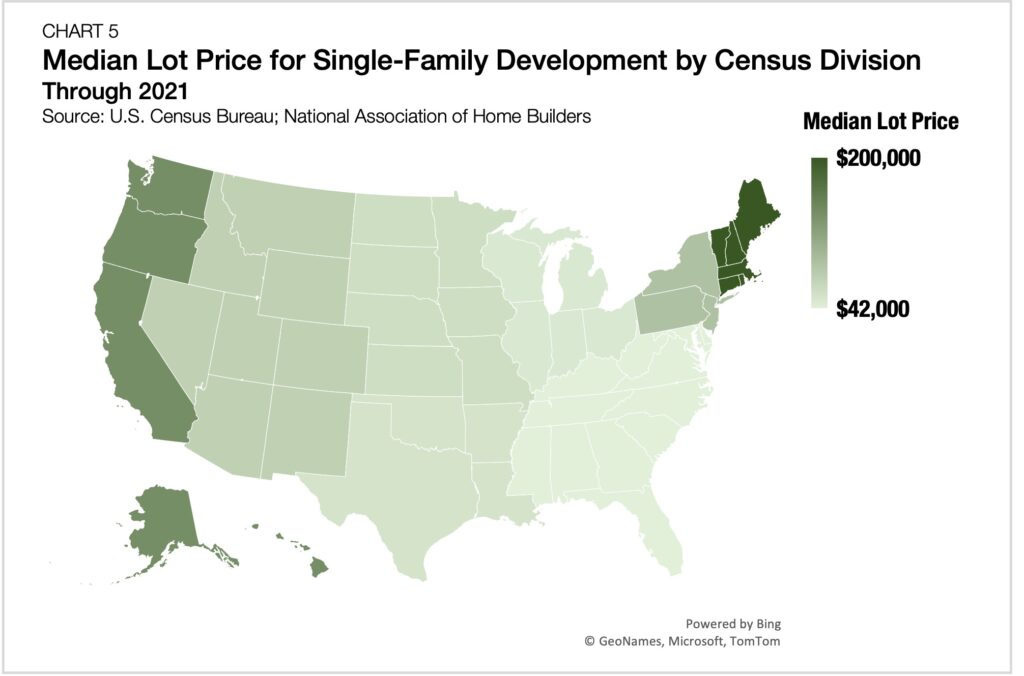
The reason why SFR construction has taken off more in the Sun Belt than other parts of the country is simple: development costs. In 2021, the median lot price was $55,000. However, these totals varied widely by region. The South Atlantic and East South Central Census Divisions had the lowest land costs in the country, where the median lot price was $42,000 (Chart 5). The Pacific Division had median lot prices totaling $143,000. The most expensive development site real estate could be found in New England, where median lot values reached $200,000 — more than four times higher than the least expensive areas.
[1] California is excluded from the Sun Belt designation for this analysis.
These regional trends look similar when considering the cost of construction labor. SFR development hotspots, such as Florida, Texas, Alabama, Georgia, and the Carolinas, all benefited from some of the lowest construction labor costs in the country. The average in each of these states was below $30 per hour. On the other side of the spectrum were California, New York, New Jersey, Massachusetts, Washington, and Illinois, where construction labor costs all averaged above $39 per hour.
The SFR Sector Sets its Sights on the Sun Belt
The past two years have encompassed a period of rising construction costs unrivaled in recent history. The pandemic triggered an increase in demand for single-family housing while also making the sourcing of materials needed for construction more difficult. As a result, development costs and home prices have been squeezed to new highs. While price pressures were felt nationally, bottom line prices paid by developers continued to vary according to geographic location. Large-scale SFR developers continue to concentrate their purpose-built communities in the Sun Belt, where local land and labor costs benefit the economics of new development.
Interested in the multifamily real estate investment market? Contact Arbor today to learn about our array of multifamily and single-family rental financing options and view our other market research and multifamily posts in our research section.

