Multifamily Permitting Activity Rebounds in Q1 2021

- Annualized new multifamily permits totaled 502,000 in March 2021 and have averaged 530,000 through the first three months of the year.
- At the current rate, multifamily permit totals are on track to exceed the 416,000 measured throughout all of 2020.
- In March 2021, multifamily permits accounted for 28.5% of all new residential permits, 4.4% below the 10-year average set between 2010 and 2019.
- Smaller metro areas are posting high growth totals while gateway markets remain far below pre-pandemic norms.
Key Findings
Residential building permits, a leading indicator of near-term construction activity, tend to see a high degree of cyclical variability. Permits often fall during recessions as there is less aggregate demand for new housing. In turn, developers become more risk-averse, and construction lenders tighten underwriting. While permits did indeed crater in the spring 2020, the COVID-induced recession has proven to be anything but ordinary. New multifamily permitting activity has rebounded sharply in recent months, and the multifamily share of new residential permits is progressing back to pre-pandemic normality.
Nationwide Multifamily Permitting Activity
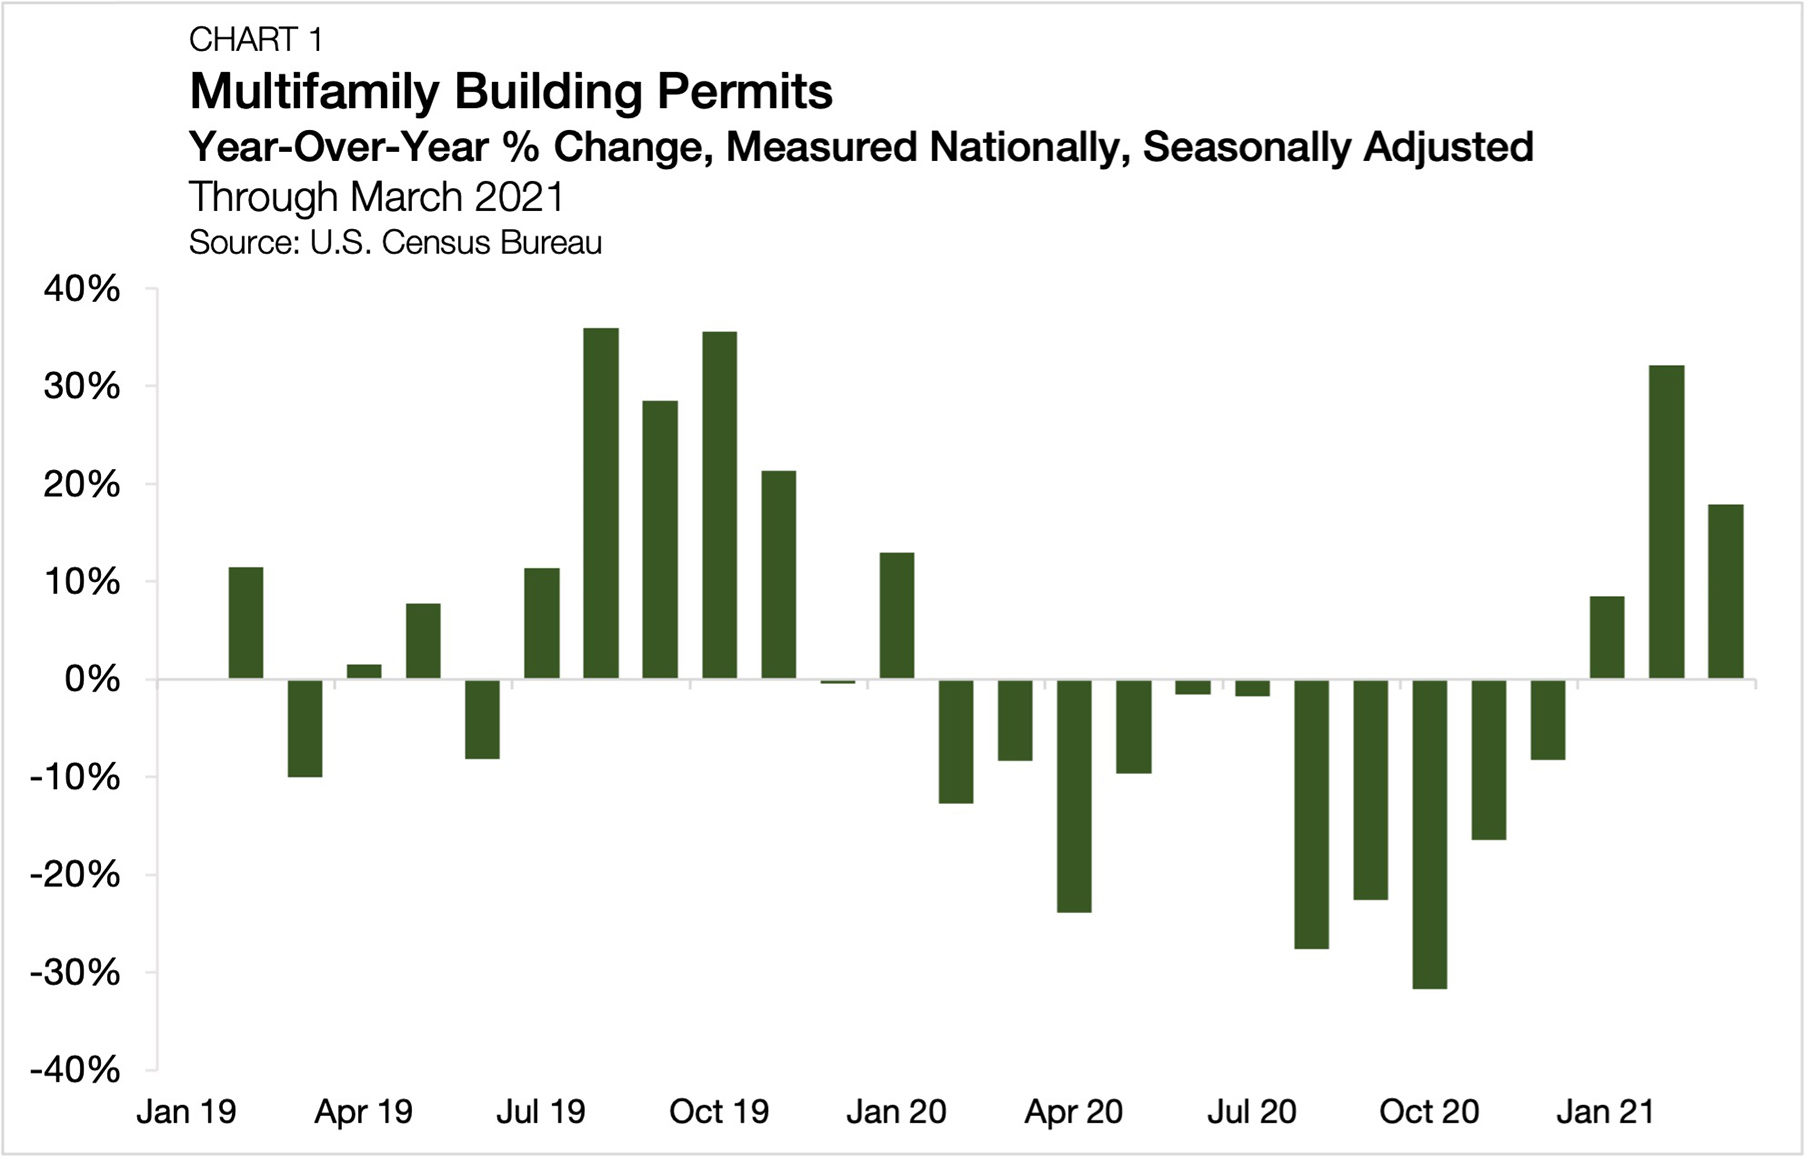
For the month of March 2021, seasonally adjusted annualized permit activity[1] totaled 502,000, an increase of 17.8% from the March 2020 reading. While the improvement is a welcomed sign, it comes with a modest grain of salt (Chart 1). March 2020 marked the onset of the domestic outbreak of COVID-19, and incoming 2021 data compared to last year’s acute economic contraction will appear atypically robust. Still, there is evidence that nationwide permitting activity has rounded the curve; March marks the third consecutive month where annualized totals are up on a year-over-year basis.

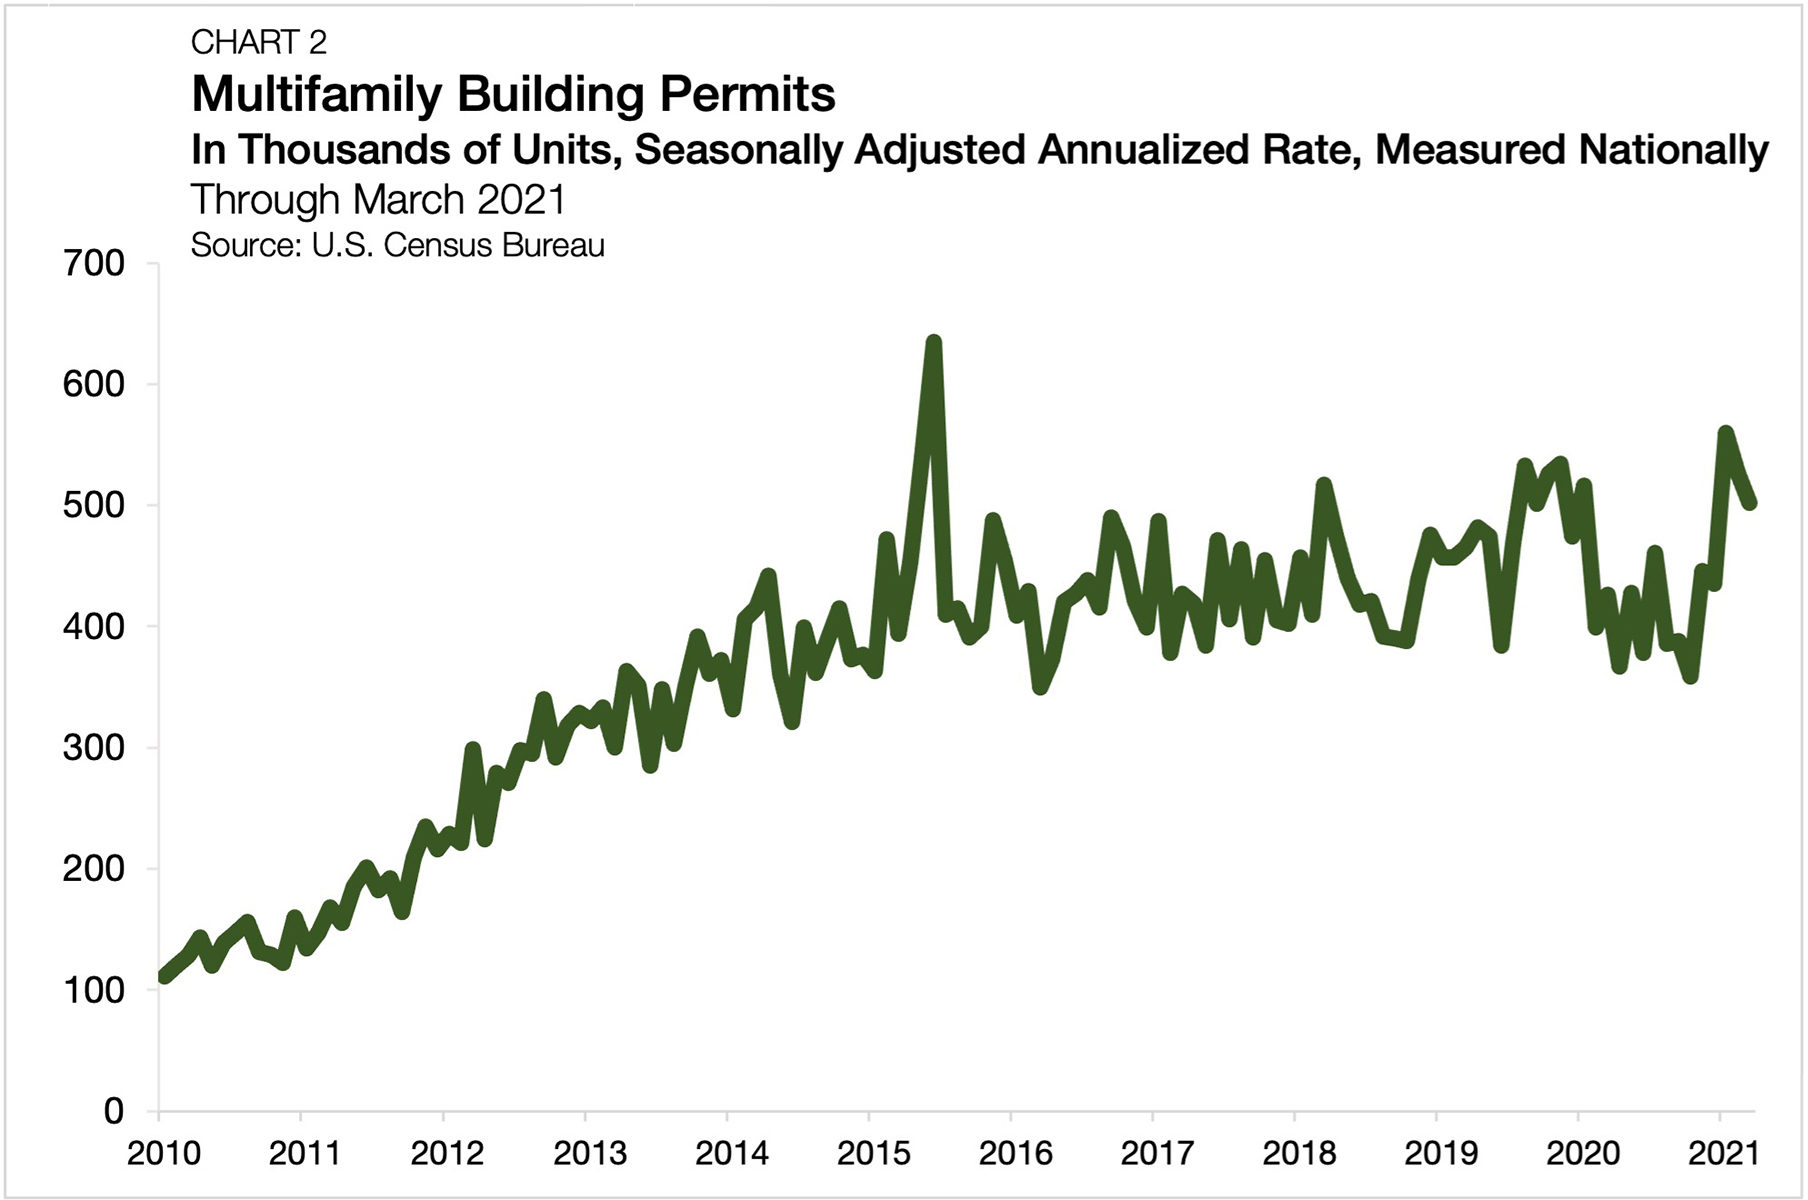
The pace of new activity for overall annualized permit counts has fully rebounded and surpassed its pre-pandemic level. In 2019, a total of 480,000 multifamily units were authorized for construction (Chart 2). In 2020, this total sank to 416,000, reaching a seasonally adjusted annualized low of 359,000 in October. Through the first three months of 2021, seasonally adjusted annualized multifamily permits have averaged 530,000 units, on pace to exceed the 2019 and 2020 totals by 10.4% and 27.4%, respectively.

Migration Trends Impact Multifamily Permitting
Last year, warnings of an impending urban exodus were everywhere. Many emerging signs and data suggest that the severity of this migration away from the big cities may be less than initially expected in 2020. That said, the marginal impact of renters migrating from cities and into suburban and smaller urban markets does show in the permit data.
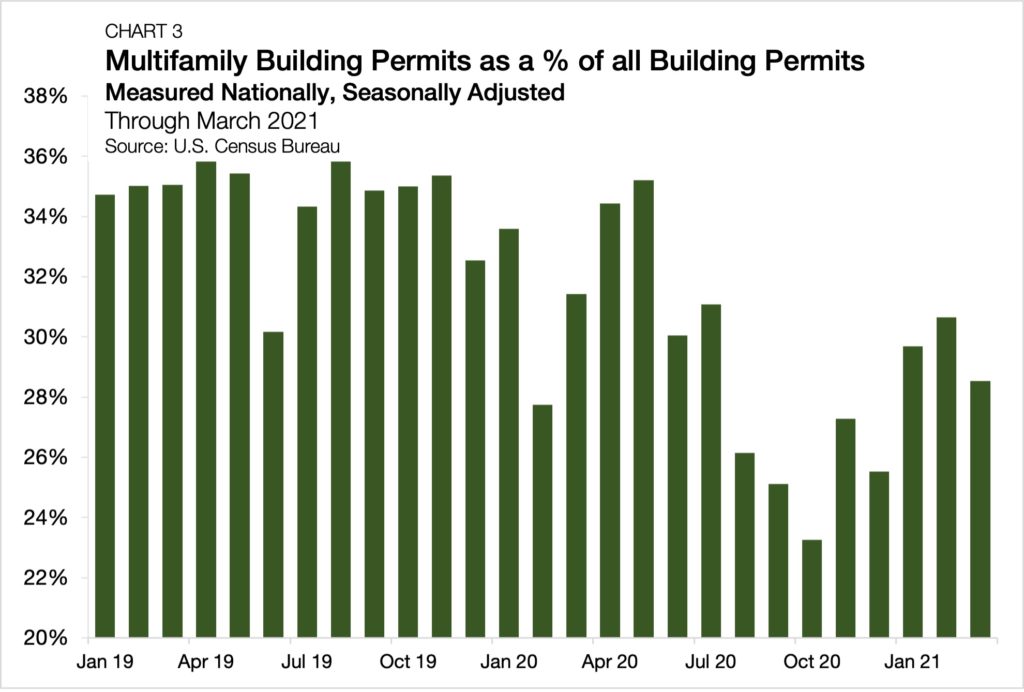
Between May and October 2020, the multifamily share of all building permits fell from 35.1% to 23.2%, its lowest allocation since November 2010 (Chart 3). Here, the pandemic proved to be a double-edged sword. On the one hand, it led to material supply shortages and permitting delays. According to NMHC’s Construction Survey, a more than three-fourths majority of multifamily developers have reported permitting delays throughout the entirety of the pandemic to date.[2] On the other, it shifted the demand for housing away from high-density neighborhoods and larger metropolitans.
According to Justin MacDonald, chairman of NAHB’s Multifamily Council, “the eviction moratorium and other restrictions on owners of rental properties are making developers cautious about starting new multifamily projects in certain parts of the country.” Still, as the U.S. economy moves past its pandemic-era distortions, the multifamily sector has started to recover back to a pre-pandemic normal share of permitting activity. As multifamily authorizations rebounded this past winter, so did its share of new market-wide permits. Its share has now increased in three out of the past five months and is 5.3% higher than its October 2020 low, settling at 28.5%. This rate is just 4.4% below the average set between 2010 and 2019.[3]

Metro-Level Permit Activity
Many U.S. metro areas are now posting high multifamily permit totals, aligning with the national trend. Of the largest 50 metros, 26 have authorized more multifamily units in the 12 months ending in March 2021 than in the 12 months ending March 2020. Through March 2021, Oklahoma City outpaced all other metros in multifamily permitting growth. The level of activity rose by more than 1,000% compared to the 12 months ending in March 2020 (Table 1). Birmingham came in second, climbing by 103% year over year. While both metros charted just 395 and 299 permits over the past 12 months, respectively, the relative growth reflects how smaller and medium-sized metros have benefited from recent migrational shifts.
Of the top 10 fastest-growing metros for multifamily permitting activity, only Philadelphia was also in the top 10 by population. Major cities were generally in a permitting recession for the past year. Atlanta recorded the steepest decrease in multifamily authorizations, with the 2,232 units permitted over the past 12 months falling 60% below the total observed in the preceding year (Table 2). Chicago experienced the second largest percentage decline, dropping by 51%, while Portland (OR) fell by 50%.


[1] Annualized multifamily permitting data are seasonally adjusted and can be retrieved at: https://fred.stlouisfed.org/series/PERMIT5.
[2] The first round of the NMHC’s Construction Survey spanned from March 27, 2020 until April 1, 2020. The sixth (and most recent) round of the survey spans from February 10, 2021 until March 5, 2021. Over the life of the survey, a minimum of 76% of respondents reported permitting delays (Round 1). A maximum of 90% reported delays (Round 5).
[3] Between January 2010 and December 2019, multifamily permits accounted for 32.9% of all privately owned housing units authorized permit issuing places.
For more multifamily research, visit the Chatter blog.

