Q1 2021 Small Multifamily Metro Area Cap Rate Trends

- Through first-quarter 2021, smaller metros experienced more cap rate compression for small multifamily properties than larger gateway markets.
- Los Angeles maintained the lowest average small multifamily cap rates, with several California metros following closely behind.
- Las Vegas measured the most cap rate compression of any metro over the past year.
Key Findings
Despite an unrelenting series of headwinds over this past pandemic-stricken year, the small multifamily sector has performed favorably. According to the Q1 2021 Arbor Small Multifamily Investment Trends Report, cap rates for smaller-scale apartment properties[1] averaged 5.3% through the first three months of 2021, declining by 34 basis points (bps) from a year earlier.
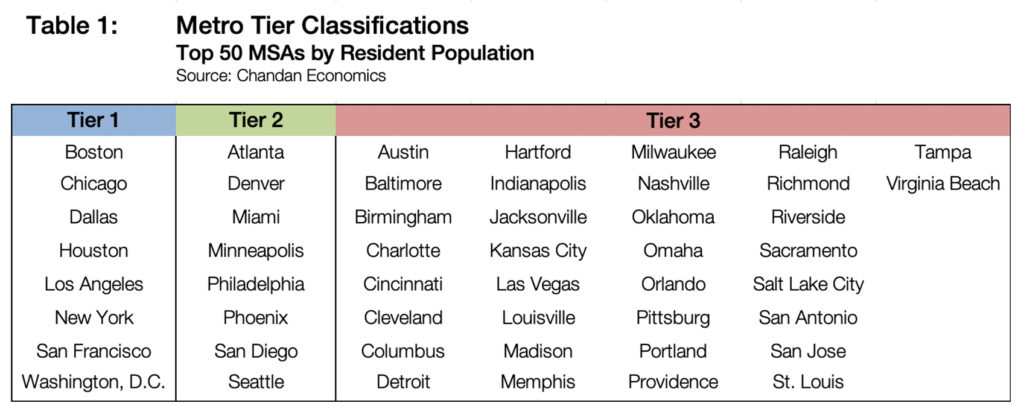
For this briefing, data are explored at the Metropolitan Statistical Area (MSA) level, reported individually and aggregated into like-kind metro tiers. Evidence suggests that assets located in less populated, though rapidly expanding, metro areas tended to perform better over the past year as residential demand flowed out of gateway markets and into more affordable and spacious alternatives.
Q1 2021 Small Multifamily Metro Trends By Tier
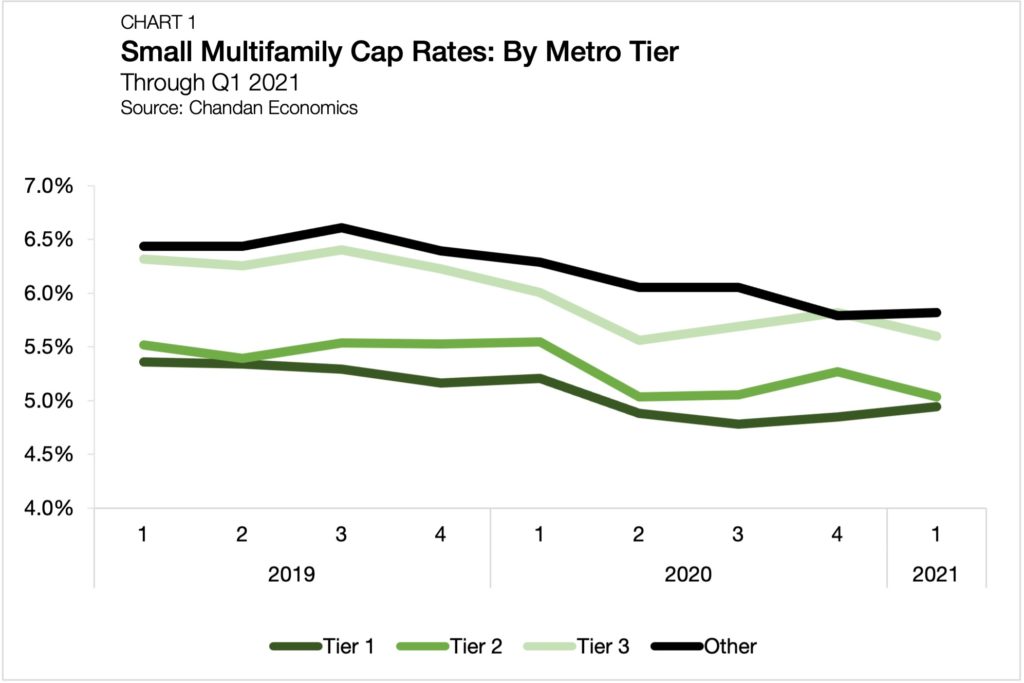
Tier 1 metros maintained the lowest average small multifamily cap rates through the first quarter of 2021, averaging 4.9% (Chart 1).[2] Tier 2 and Tier 3 metros followed with 5.0% and 5.6%, respectively. Cap rates in metro areas outside of the top 50 (“Other”) averaged 5.8% through first-quarter 2021.
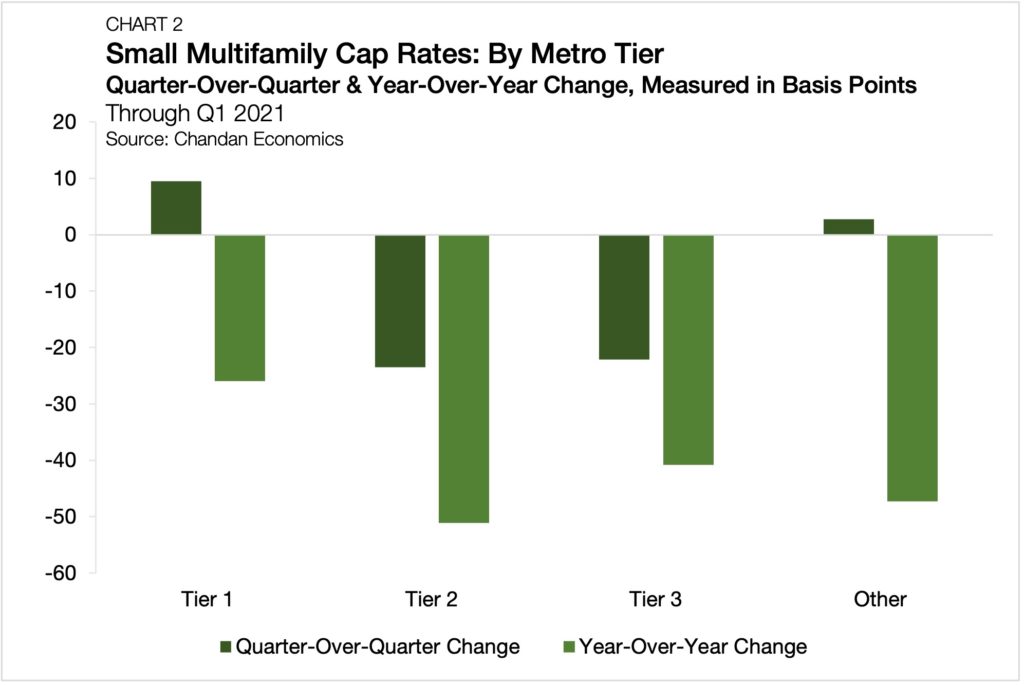
Measured quarter over quarter, cap rates fell the most in Tier 2 metros, declining 24 bps from the end of 2020 (Chart 2). Tier 3 metros followed closely behind, ticking down 22 bps. Meanwhile, Tier 1 and Other metros both saw cap rates rise from the previous quarter, nudging up by 9 bps and 3 bps, respectively.
Measured year over year, all tiers saw declining cap rates. Tier 2 metros again led the pack, with cap rates in these metros falling by an average of 51 bps. Other and Tier 3 metros followed next, declining by 47 bps and 41 bps year over year, respectively. Tier 1 metros saw the least annual cap rate compression, falling by just 26 bps.
Trends By Metropolitan Statistical Area (MSA)
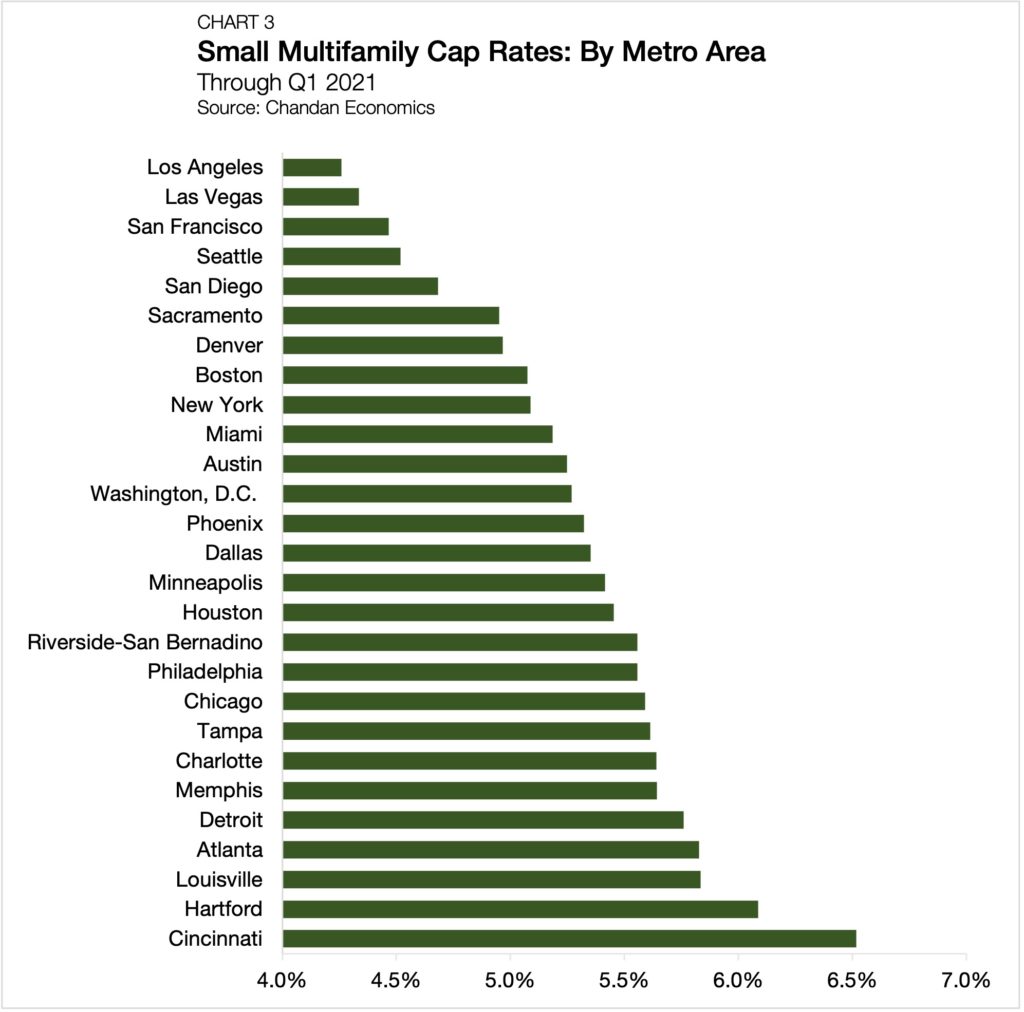
Of the 27 metros tracked by Chandan Economics, Los Angeles held the lowest average small multifamily cap rate, coming in at 4.3% through the first three months of the year (Chart 3). Several other California metros follow closely behind, with San Francisco (4.5%), San Diego (4.7%) and Sacramento (5.0%) all posting some of the lowest property-level yields in the country. At the other end of the spectrum, Cincinnati and Hartford are among the metros areas with the highest tracked small multifamily cap rates, averaging 6.5% and 6.1% in the first quarter of 2021, respectively.
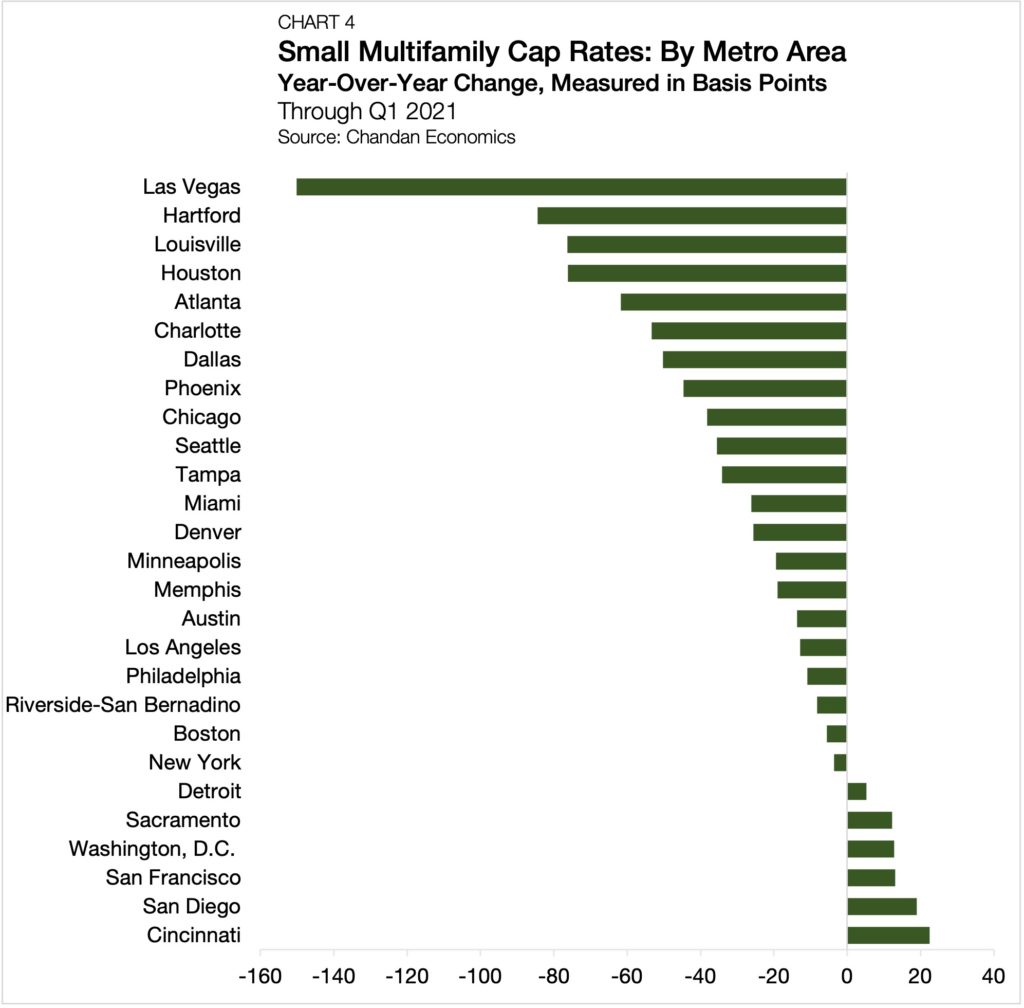
Measuring changes in cap rates year over year, Cincinnati once again made an appearance at one end of the list, expanding 22 bps over the past four quarters (Chart 4). San Diego followed, with Q1 2021 small multifamily metro cap rates edging up by 19 bps over the same period.
Leading the country in cap rate compression over the past 12 months was Las Vegas, shaving off 150 bps from the same time last year — a symptom of rising residential demand in and around Sin City. Between 2010 and 2019, the residential population in Las Vegas exploded by 16%, nearly tripling the U.S. residential growth rate over the same period (6%), according to the U.S. Census Bureau.
[1] For the purpose of this analysis, small multifamily properties are assets with valuations less than $15 million.
[2] All data are based on a Chandan Economics analysis of a sample of multifamily mortgages with original balances less than $7.5 million. Metro-level data, especially when reported individually, are subject to smaller sample sizes and have a higher margin of error.
For more small multifamily research, read our Q1 2021 Small Multifamily Investment Trends Report.

