The Leading U.S. Markets for Multifamily Building Permitting in 2023

- Despite multifamily permits dropping more than 20% nationally in 2023, many markets continued to experience multifamily sector growth.
- Austin, TX, issued the highest number of multifamily permits per capita.
- Riverside, CA, and Louisville, KY, posted the largest annual growth totals last year.
As borrowing costs rose and rent growth slowed, multifamily developers pulled back the reins in 2023. Nationally, the number of multifamily building permits sank 20.3% last year, according to the latest data from the U.S. Census Bureau. However, there are many metropolitan markets where activity has not slowed. In this deep dive, our research teams show which metros led the nation in multifamily permitting activity in 2023.
Permits Per Capita
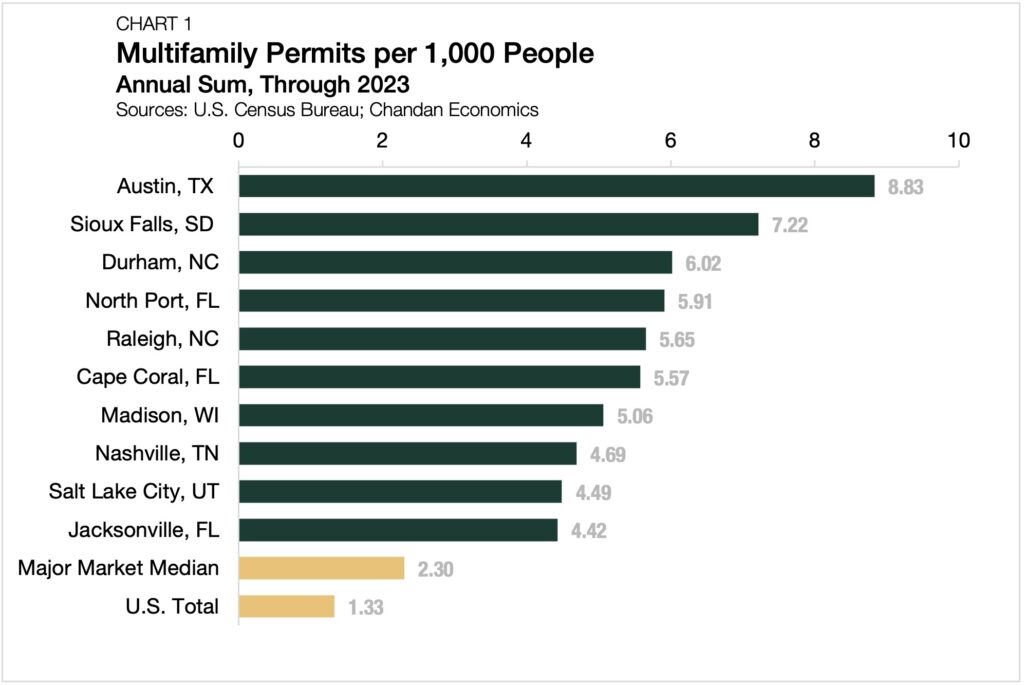
An analysis of multifamily permits in absolute terms will typically return a predictable collection of major population centers, such as New York and Los Angeles. Instead, our research team examined multifamily permitting activity in proportion to each metro’s population to pinpoint smaller markets with high growth potential. Among the 60 major markets included, the median metro issued 2.3 multifamily permits per 1,000 residents.
Austin, TX had the most multifamily permitting activity per capita in 2023 (Chart 1). For every 1,000 residents, the Texas metro issued 8.8 new multifamily building permits. Austin’s housing supply boom has caused rents to fall. However, the negative effect of the supply imbalance should prove temporary as it continues to see strong population inflows, especially among young renters.

Perhaps surprisingly, Sioux Falls, SD, follows closely behind Austin, with 7.2 permits issued per 1,000 people. Sioux Falls is — by a considerable margin — the smallest market captured in this analysis, with a resident population of 289,592 people. Nevertheless, its growth trajectory is impossible to ignore. Between 2010 and 2022, Sioux Falls’ population swelled by 26.4% — more than tripling the national growth rate of 7.7% over the same period.
Rounding out the top three is Durham, NC, with 6.0 permits per 1,000 people. Durham’s labor market, heavily tied to professional services, life sciences, and health care, is an economic growth engine. Compared to the pre-pandemic peak, the number of jobs in the Durham metro area has jumped by an impressive 6.9%, more than doubling the national expansion rate of 3.2%.
Annual Growth
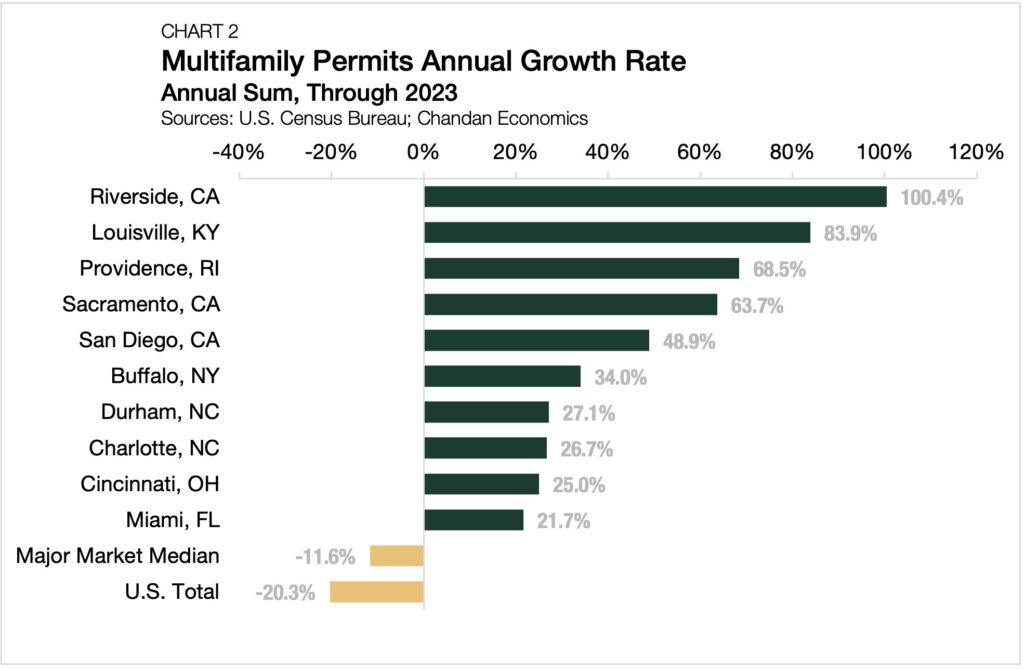
In terms of year-over-year multifamily permitting growth, Riverside, CA, stands above the rest of the pack. Multifamily permitting here more than doubled, accounting for 7,329 new units authorized for construction (Chart 2).

Riverside’s proximity to Los Angeles is a driving force behind its multifamily sector expansion. According to ApartmentList, 59.5% of new rental demand in Riverside is arriving via Hollywood Boulevard. The adjacency to Los Angeles has also super-charged Riverside’s industrial and logistics sector, providing the metro a stable base of economic support.
Louisville, KY, experienced the second-largest permitting uptick in 2023, climbing 83.9%. Last year, Louisville was one of the tightest rental markets in the country, driven by high occupancy and strong rent growth. According to the Waller, Weeks and Johnson Rental Index, annual rent growth in Louisville remains at 6.1%, nearly twice the national average of 3.3%.
A popular destination for Boston movers, Providence, RI, rounded out the top three, with a 68.5% increase in the number of multifamily permits issued in 2023. As migration flows in recent years have ebbed away from gateway cities, markets like Providence have seen uncharacteristically high levels of growth.
The Outlook
Last year proved to be a reset for the multifamily sector at the national level, with originations, transactions, and construction all hitting the breaks. Still, there were many metropolitan markets across the country with strong local economies supporting multifamily growth — a trend that will assuredly continue in 2024.
Methodology
All markets in this analysis are measured at the metropolitan statistical area (MSA) level. All markets included have met at least one of two criteria:
1) Top 50 MSA by population in 2022
2) Top 50 MSA by number of multifamily permits in both 2022 and 2023
In total, 60 markets were included in this analysis.
Interested in the multifamily real estate investment market? Contact Arbor today to learn about our array of multifamily, single-family rental, and affordable housing financing options and view our other market research and multifamily articles in our research section.

