
Top Markets for Multifamily Building Permits
- Multifamily permitting increased 2.6% in 2025, while metro-level trends diverged sharply.
- Madison, WI, North Port, FL, and Fayetteville, NC, were the national leaders in multifamily permits per capita, highlighting the continued intensity of development in several high-growth regional markets.
- Year-over-year fluctuations in permits issued were pronounced, with several mid-sized metropolitan areas posting triple-digit gains and others pulling back sharply.
Multifamily permitting trends indicate continued national stability amid local recalibration. Across the country, issuances were steady, rising just 2.6% in 2025. At the metropolitan level, trends diverged sharply, with some markets accelerating and others pulling back. Per-capita leaders continued to cluster around high-growth Sun Belt and regional hubs, while year-over-year market-level fluctuations suggest that more pipelines have become increasingly selective and, in some cases, more concentrated in large-scale projects.
Permits Per Capita
The intensity of multifamily development, relative to population, varied widely across metro areas in 2025. Among the 100 largest U.S. markets, the median metro issued fewer than two permits for buildings with five or more units per 1,000 residents last year.
Madison, WI, which posted roughly 7.2 multifamily permits per 1,000 residents, led all large metro areas (Chart 1). The city’s elevated pipeline reflects sustained rental demand and represents a sizable share of multifamily construction activity.
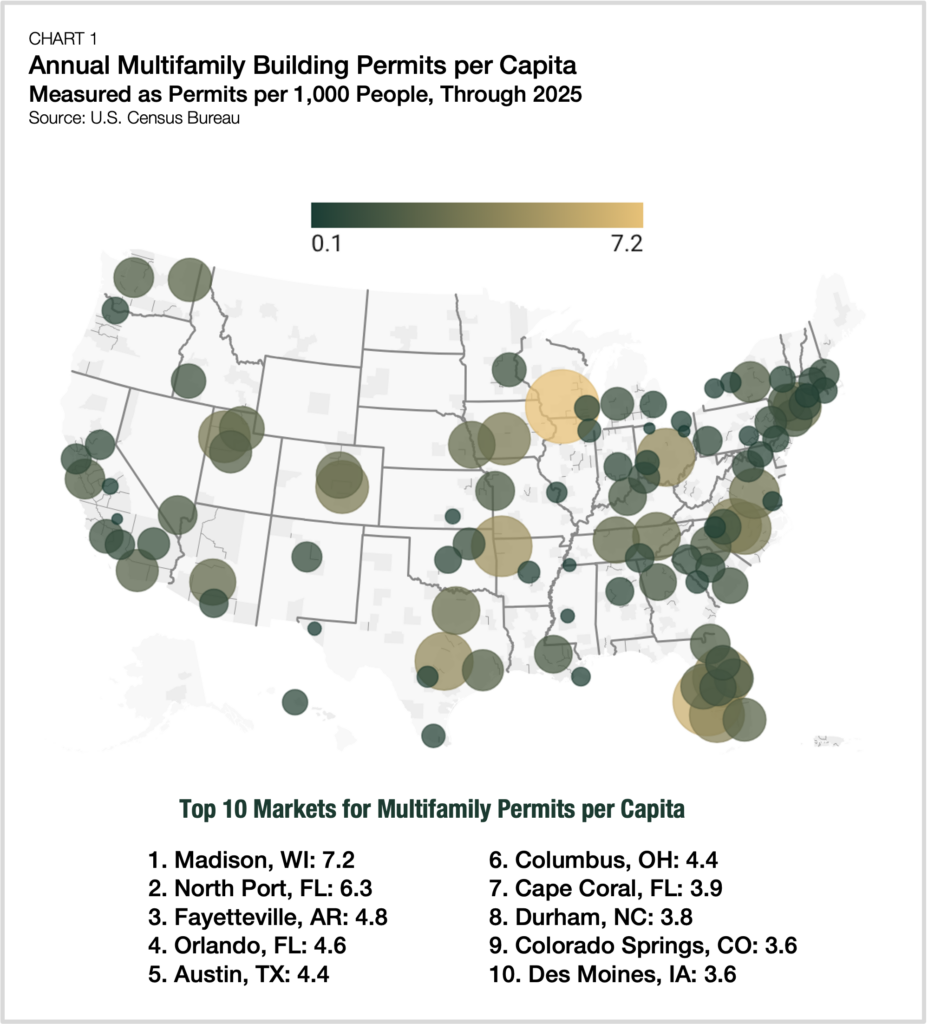
Madison’s high concentration of multifamily permitting is the result of steady population growth, a large university-driven renter base, and sustained job gains in government, healthcare, and life sciences, which all support relatively resilient rental demand.
Florida markets feature prominently in the top 10. North Port, FL, issued approximately 6.3 permits per 1,000 residents, while Orlando, FL, delivered 4.6 permits per 1,000 residents, reflecting the market’s response to local population growth.
High-growth Texas and Mountain West markets remained active multifamily permit issuers. Austin, TX, recorded approximately 4.4 permits per 1,000 residents, while Salt Lake City, UT, and Colorado Springs, CO, each recorded roughly permits per 1,000 residents in 2025.
By contrast, large gateway markets showed more measured intensity of development. New York issued roughly 1.7 permits per 1,000 residents; Los Angeles just over 1.0; and Chicago under 0.6, another illustration of how development activity often skews toward faster-growing Sun Belt and regional markets.
Year-Over-Year Change
While per-capita rankings highlight development intensity, year-over-year change reveals where permitting momentum shifted most in 2025. Market-level patterns were volatile, with multifamily permitting rates in 80 of the 100 largest metro areas either up or down by at least 10% year-over-year.
Several mid-sized markets recorded outsized gains, in some cases rebounding from comparatively modest permitting totals a year earlier. Jackson, MS (+677%), Syracuse, NY (+290%), and Baton Rouge, LA (+237%) led the nation in percentage growth (Chart 2).
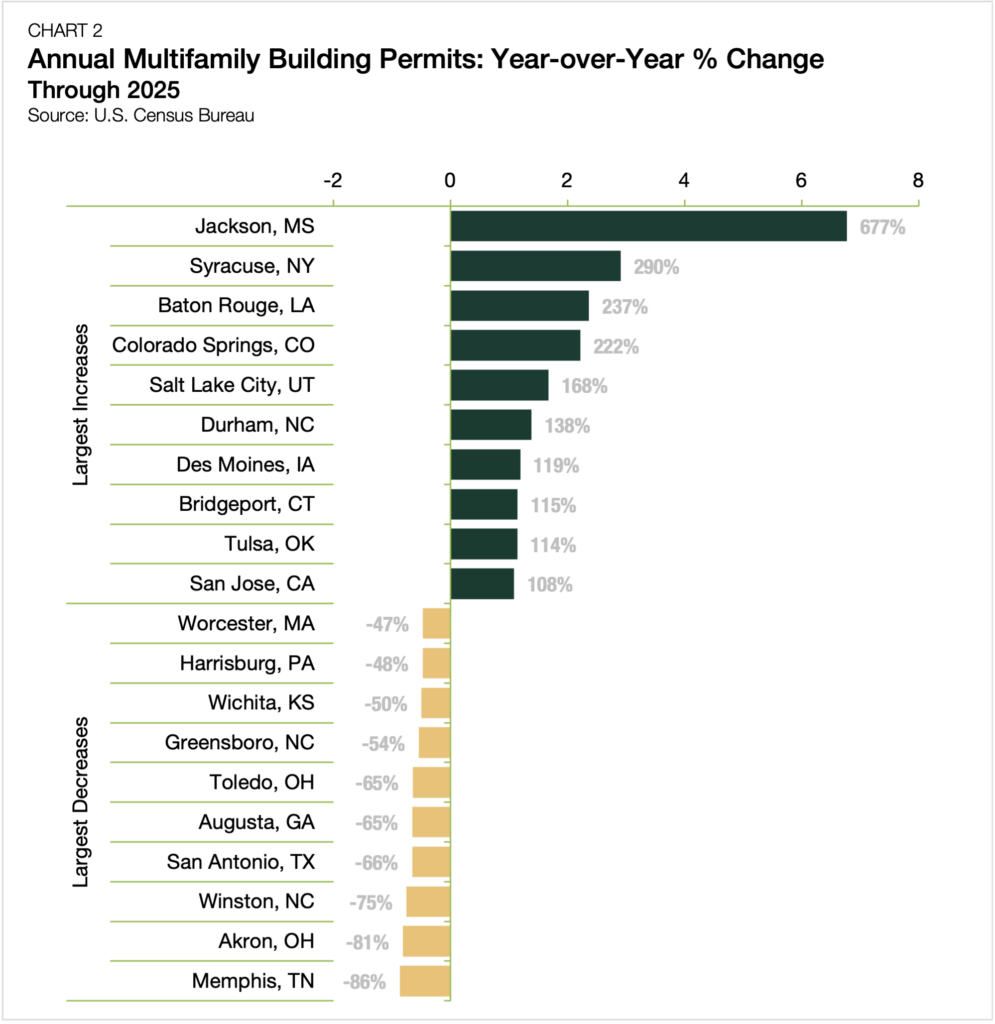
In some markets, the surge in units did not correspond to a comparable increase in multifamily structures. In markets such as Baton Rouge, total units increased even as the number of permitted structures declined, indicating that activity was concentrated in fewer, larger-scale projects.
Elsewhere, gains were more widespread. For example, Colorado Springs, CO, and Salt Lake City, UT, posted strong increases in both units and structures, indicating that pipeline growth was more generalized.
At the lower end of the spectrum, several Sun Belt markets experienced sharp pullbacks in permitting. Memphis, TN (-86%), Akron, OH (-81%), and San Antonio, TX (-66%) had notable contractions, reflecting how quickly multifamily pipelines can recalibrate.
The Bottom Line
Recent permitting patterns illustrate a multifamily market moving beyond post-pandemic extremes and into a more selective phase of the cycle. While aggregate volumes remained relatively steady, market-level fluctuations highlight how development is increasingly shaped by local fundamentals.
Looking ahead, Fannie Mae forecasts a modest pullback in multifamily development in 2026, followed by a return to growth in 2027. Beyond the national picture, the uneven distribution of supply suggests that performance will hinge on the durability of local rental demand. As new supply is delivered into markets with varying demand conditions, market-level fluctuations are likely to continue, revealing localized opportunities for investors.
Interested in the multifamily real estate investment market? Contact Arbor today to learn about our array of multifamily, single-family rental, and affordable housing financing options or view our multifamily articles and research reports.