Top Markets for Multifamily Investment Growth
- The Midwest multifamily market experiencing under-the-radar success during 2021, with Detroit, Indianapolis, and St. Louis all posting some of the strongest investment growth in the country.
- Sun Belt metros continued to be a hotbed of investment, led by Las Vegas, Houston, and Miami.
- Strong economic recovery and population growth supported residential demand in the Sun Belt.
When uncertainty gripped the U.S. in 2020, it had the effect of pushing investors to the sidelines. As a result, investment volumes sank considerably even in more liquid segments of the real estate market like the multifamily sector. In 2021, investors rushed back and contributed to the most active year of apartment transactions by dollar volume on record. According to Real Capital Analytics (RCA), more than $335 billion in apartment asset value changed hands last year— a total that is nearly equivalent to the volume recorded in 2019 and 2020 combined.
Here, the research teams at Arbor and Chandan Economics explore where U.S. apartment investment volumes are growing the fastest and where the recovery is still trailing behind.
Market-Level Transaction Volume
While the Sun Belt region remains entrenched in a decade-long boom, the U.S. metro market that saw the most growth in apartment transaction volume last year was one that is hardly known for its temperate weather: Detroit. According to RCA, apartment transaction volumes reached $1.8 billion in Detroit last year, rising 446% above its 2020 total (Chart 1). While the relative growth rate appears inflated due to subdued transaction volumes in 2020, comparing last year’s total to the last full year before the pandemic tells an equally impressive story. Compared to 2019, Detroit’s apartment transaction volumes in 2021 were up by 236%.
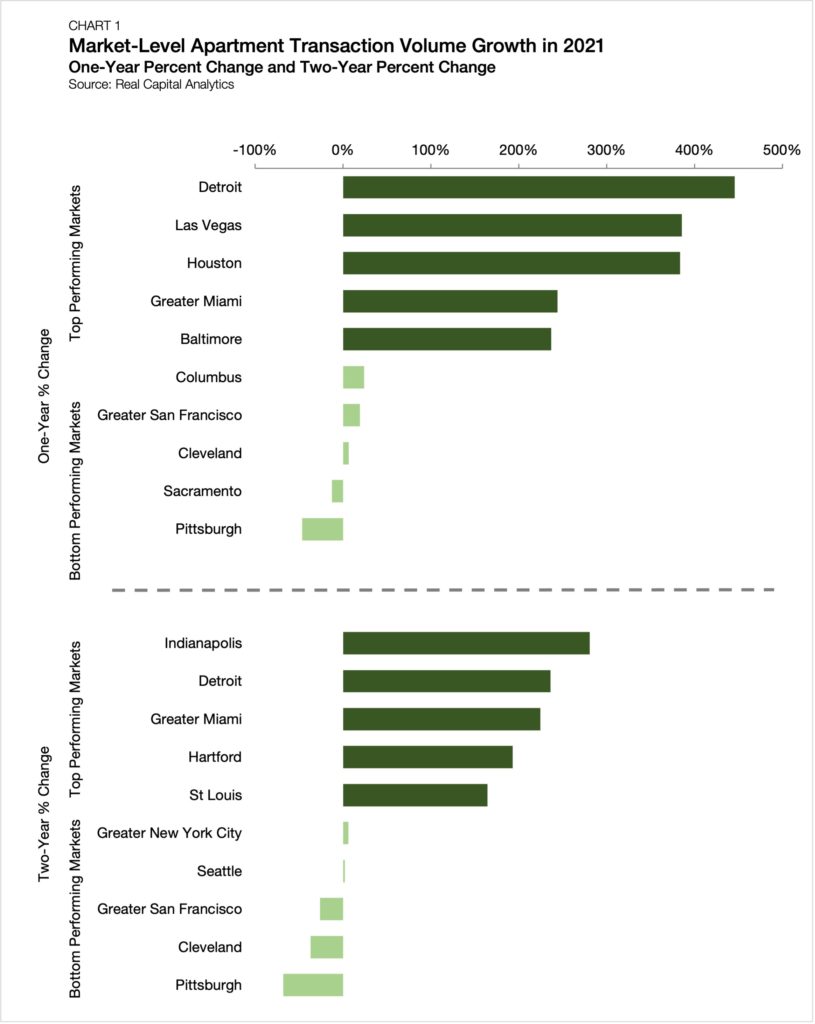
Detroit was quietly building momentum in the lead-up to the pandemic, and the activity in 2021 shows that the area looks to be making significant progress beyond its recovery. Moreover, success is being felt throughout the Midwest region. Indianapolis saw the largest increase in apartment transaction volumes of any market in the U.S. between 2019 and 2021, surging by 281%. Similarly, nearby St. Louis saw a 164% increase over the same period.
While parts of the Midwest are shining bright, so is the Sun Belt. Of the ten markets to see the largest single-year jumps in apartment transaction volume, seven were in the southern portion of the country. Las Vegas led the Sun Belt with transaction volumes rising 385% year-over-year. Following closely behind were the Houston, Greater Miami, and Orlando metro areas, which saw transaction volumes rise by 383%, 244%, and 219%, respectively.
On the other end of the spectrum, Pittsburgh had a tougher time than any other U.S. metro. As noted by Yardi Matrix, the Pittsburgh multifamily sector has lagged in its recovery compared to the national trend, though its strong tech sector offers hope of improved performance on the horizon.
The list of markets sluggish in their recovery also includes a few coastal Gateways. The Greater San Francisco area is one of three markets in the U.S. to not eclipse its 2019 level of transaction activity in 2021. Moreover, Greater New York and Greater Washington, D.C. displayed mediocre growth, with 2021 totals rising 6% and 22% over 2019 totals, respectively.
Even as some markets lagged, the overall 2021 year-end data reflects a landscape where the recovery of most U.S. markets is underway. All but two U.S. markets saw apartment transaction volumes rise in 2021— a stark contrast from 2020 when four-out-of-every-five markets were in decline.
Drivers of Growth: Population
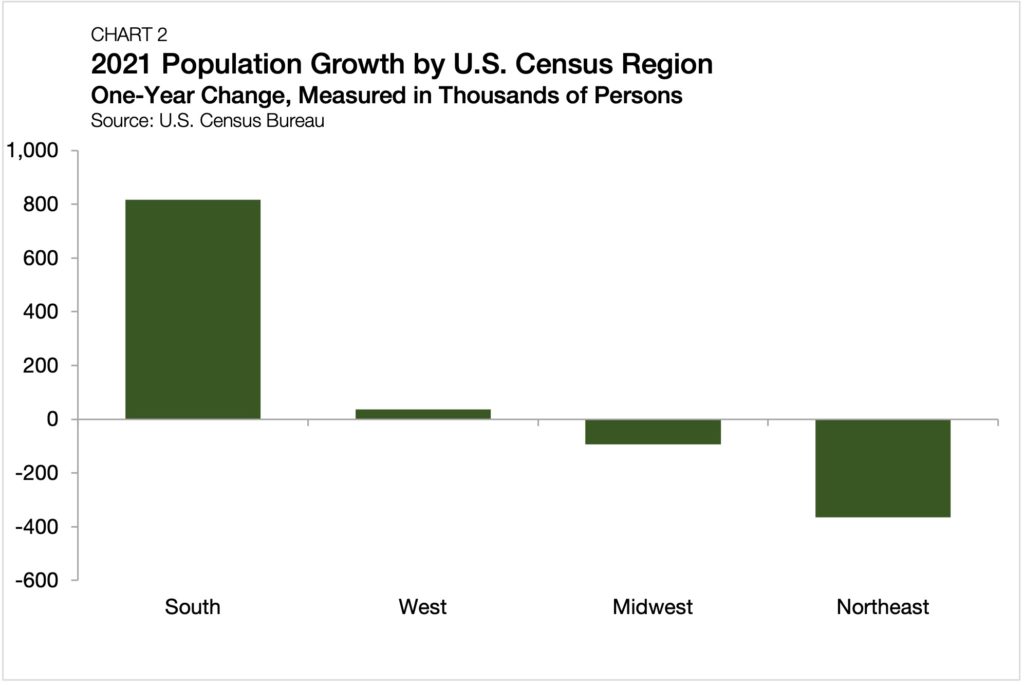
A key driver for why the Sun Belt continues to see an abundance of top-performing markets has been the ability to attract new residents. Simply put, where people move, investment capital will follow. According to the U.S. Census Bureau, the South was the only region to see meaningful growth during 2021. The region saw its population grow by 0.65%— a growth rate that translates to an additional 816,000 residents (Chart 2). The only other region in the U.S. to see growth was the West, which grew by a paltry .04% or 35,000 new residents. Both the Northeast and Midwest lost residents in 2021. The relative affordability of Sun Belt markets compared to coastal alternatives continues to be a selling point that is attracting new residents to the area.
Drivers of Growth: Labor Market Resiliency
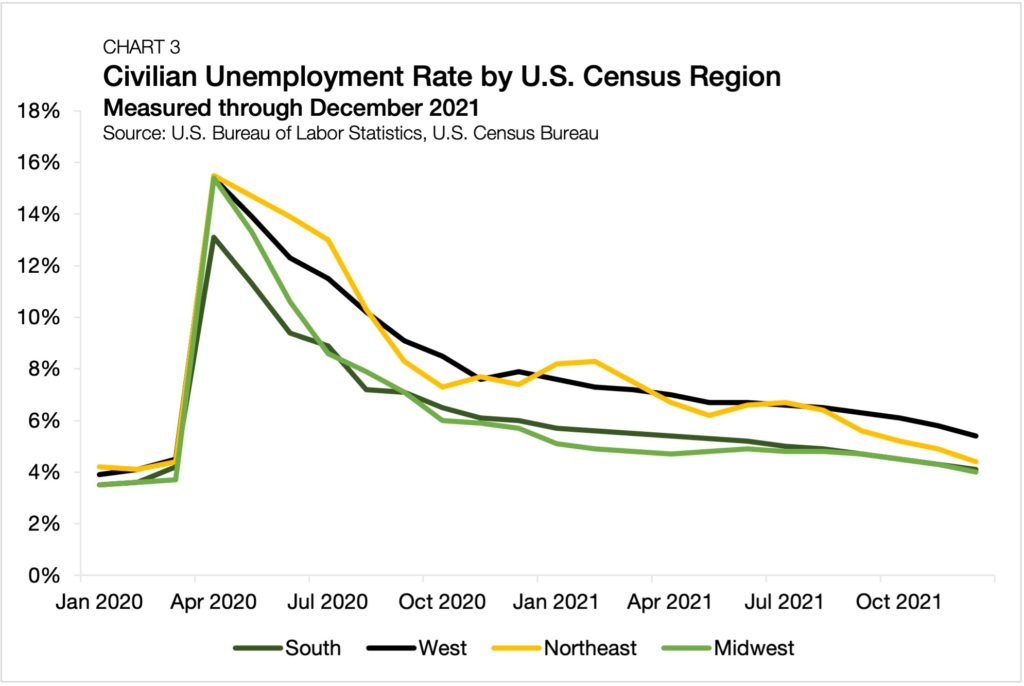
In addition to population growth, the labor market in the Sun Belt has also proven resilient during the pandemic, allowing the region to maintain economic success in the face of macro adversity. According to the U.S. Bureau of Labor Statistics, the unemployment rate in the South never reached higher than 13.1% during the recession, which was 230 bps lower than any other U.S. region (Chart 3). While the Midwest and Northeast have made headway and have started to catch up in their labor market recoveries, the South still boasted one of the lowest unemployment rates at the end of 2021, at 4.1%.
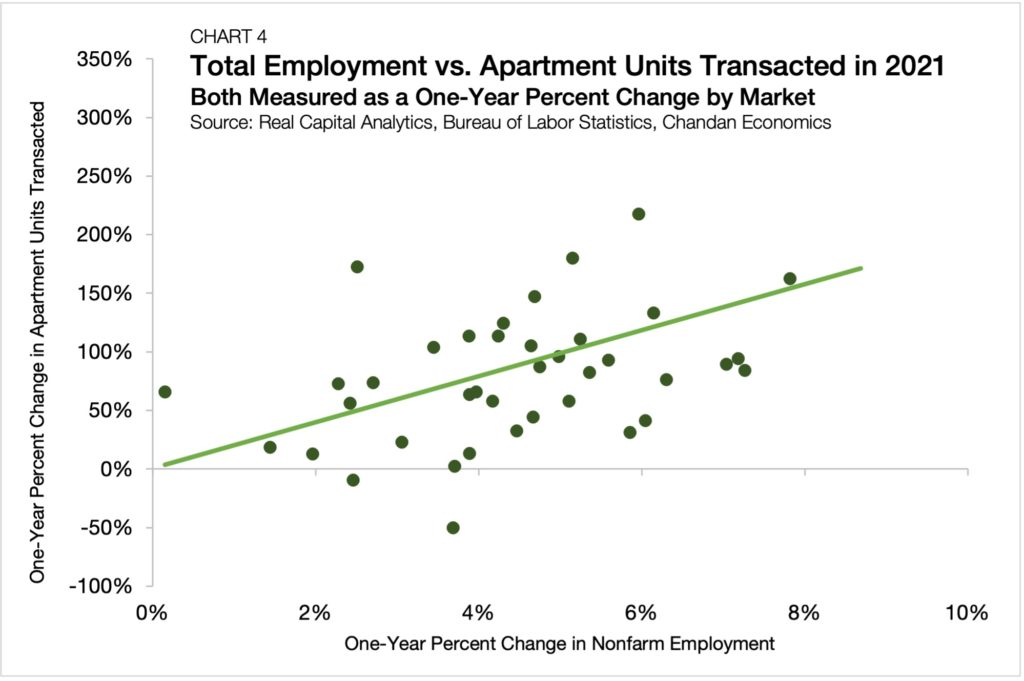
Looking at metro-level labor market data, there was a statistically significant relationship between employment growth and multifamily investment in 2021. On average, for every 1-percentage point increase in the number of jobs added in a metropolitan area during 2021, there was a 22-percentage point increase in apartment transactions by dollar volume and a 20-percentage point increase in the number of apartment units traded (Chart 4).
Summary
After the pandemic held down investment sales during 2020, pent-up investment demand came rushing back in 2021— especially in the second half, which accounted for more than 70% of the year’s total dollar volume. Monetary policy, shifting household preferences, and the continued undersupply of affordable housing units are all factors likely to have an impact on multifamily investment during 2020. Industry experts and housing economists generally agree that U.S. currently has a shortage of housing units, with some suggesting that it could total as many as 1.8 million units. Over the medium term, the gap between existing supply and market demand should continue to support capital deployment into the sector and bolster investment sales.
Notes on Methodology:
- Greater New York City (NYC): Includes Manhattan, NYC’s outer boroughs, Northern New Jersey, Long Island, Stamford, and Westchester.
- Greater Los Angeles: Includes Los Angeles, Orange County, and Inland Empire.
- Greater Washington, D.C.: Includes D.C. and the surrounding suburbs in Maryland and Virginia.
- Greater San Francisco: Includes San Francisco, San Jose, and East Bay.
- Greater Miami: Measured by Miami-Dade County, Broward County, and Palm Beach County
Data as of February 4, 2022

