Workforce Rental Demand Growing Faster in Smaller Metros

Workforce rental housing demand has increased the most in the smaller metros where apartment properties, both small and large, are increasing their shares of this demand segment.
Workforce Segment Size by Metro Markets
In this companion note to our recent blogs, we delve deeper into workforce rental demand1 in the Top 50 metro markets by comparing the share of this segment in the overall rental stock to shares within different rental property types at the metro-level.
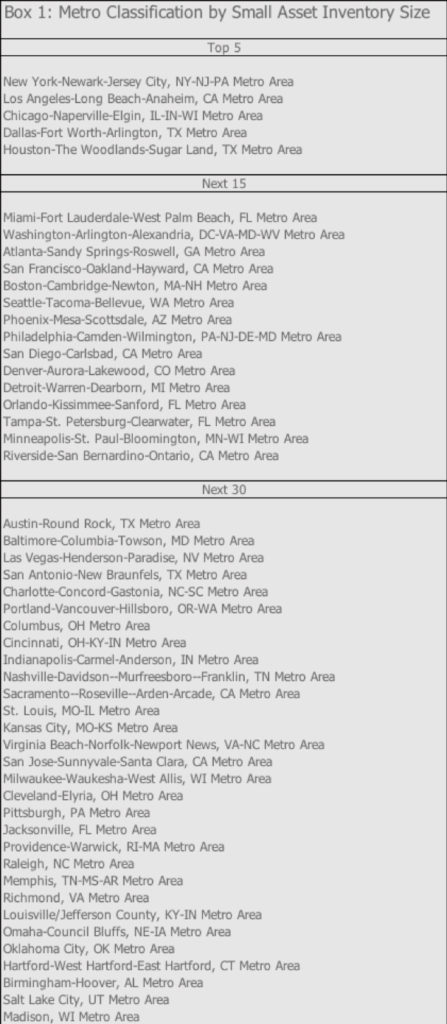
As shown below, in 2016, workforce rental demand across the overall rental stock increased steadily from 29% in the Top 5 metros (see Box 1 for definition) to slightly below 31% in the Next 15 and over 31% in the Next 30 metros1.
In comparison, the share of workforce households within small asset multifamily is consistently higher compared to the metro segment averages, reaching 32% in the Next 30 segment.
Outside of the Top 5 metros, single-family rentals have a slightly higher share of workforce households than small apartment buildings.
Workforce Share in Smaller Metros Increasing Faster
Due to a combination of housing affordability and steady job growth over the economic expansion, workforce rental demand has made significant gains in the smaller US metro areas.
As shown below, workforce households as a share of overall rental occupancy grew by 137 basis points (bps) over 2014-16 in the Next 30 metros, compared to only a 36 bps increase in the Top 5 and a 52 bps increase in the Next 15.
The share of workforce demand increased by 194 bps within small asset multifamily in the Next 30 segment, while also registering strong gains in the Top 5 metros.
Notably, the workforce share in large assets increased by 134 bps in the Next 15 metros and 145 bps in the Next 30 segment.
For small apartment property operators and investors, the above findings indicate that while workforce rental demand presents a stable long-term growth opportunity, close attention needs to be paid to the geographical spread of this demand, especially in the smaller metros.
1 Workforce households, assumed to rent at prevailing market rates, are typically defined as those falling within a range of 60% to 120% of area median income (AMI), and this is specific to metropolitan and micropolitan areas due to wage differences across the US.
2 All data is sourced from the American Community Survey (ACS), unless otherwise stated. ACS statistics are sample-based estimates of the compositional profile of the total population in the given year of data collection and include a margin of error.


