Articles

LIHTC Program: An Impactful Affordable Housing Financing Resource

As renters face a national shortage of 7 million low-income rental homes, the U.S. Department of Housing and Urban Development’s (HUD) Low-Income Housing Tax Credit (LIHTC) program is pivotal in helping to close the affordability gap for renters. It is the nation’s most significant resource for affordable apartment housing construction, which gives state and local agencies approximately $10 billion in annual budget authority to issue tax credits for affordable housing development.

Articles

FHFA Loan Caps for 2025: What Multifamily Borrowers Need to Know

The Federal Housing Finance Agency (FHFA) announced a $3 billion boost to Fannie Mae and Freddie Mac’s volume cap for loan purchases in 2025 to $146 billion ($73 billion for each agency). This increase in FHFA loan caps for 2025 aligns with industry expectations, given the anticipation of improving market conditions and lending activity expected in a lower interest rate environment. Next year’s cap for the Government-Sponsored Entities (GSEs) is an increase of approximately 4% from the $140 billion limit set for 2024.

Analysis

U.S. Multifamily Market Snapshot — November 2024

The U.S. multifamily market held steady in a more normalized cycle through the first three quarters of 2024, following its skyrocketing recovery from the pandemic-related contraction. Rental demand remained strong, driven by the continued nationwide housing shortage and strong wage growth, while the high levels of new construction seen over the last two years appears to have peaked.

Current Reports

Small Multifamily Investment Trends Report Q4 2024

Small multifamily’s normalization pushed forward last quarter as the Federal Reserve made a long-awaited reduction to the target federal funds rate. Arbor’s Small Multifamily Investment Trends Report Q4 2024, developed in partnership with Chandan Economics, shows signs of stability have multiplied. Robust rental demand, a limited supply of quality affordable housing, and several other promising developments should support the subsector’s strength heading into 2025.

Analysis

Top U.S. Multifamily Rent Growth Markets — Q3 2024

The U.S. multifamily market held steady in a more normalized cycle during the third quarter of 2024. Rental demand remained strong, while new leaders emerged among the top markets for rent growth.

Articles

Top Markets for Wage Growth in 2024

One of the most essential factors multifamily investors need to consider before executing a transaction is the health of the local labor market. Wage growth and other trends are driven by a delicate, constantly adjusting balance of labor supply and demand. In some markets, an inflow of employers can cause wages to spike. In others, population outflows can create the same effect. In this deep dive, we expand on the data findings from the 2024 Top Markets for Multifamily Investment Report, exploring the unique conditions driving metro wage growth trends.

Press Contact

Press Contact If you are a member of the media and would like to arrange an interview with one of our knowledgeable multifamily and commercial real estate finance executives or if you have general media questions about Arbor, please contact us at [email protected] or through the below form.   Fill out the form to reach our press team.  

Current Reports

Top Markets for Multifamily Investment Report 2024

With interest rate pressure easing, quality multifamily investment opportunities have emerged from coast to coast, making identifying the optimal location essential. A roadmap for investors, Top Markets for Multifamily Investment Report 2024, developed in partnership with Chandan Economics, ranks the top 50 metropolitan markets found through an analysis of 10 key factors, including affordability, population growth, and climate risk.

General: 800.ARBOR.10

Small Multifamily Investment Trends Report Q2 2022

Cap Rates Compress as Buyers Seek Inflation Protection via Multifamily Assets

Key Findings

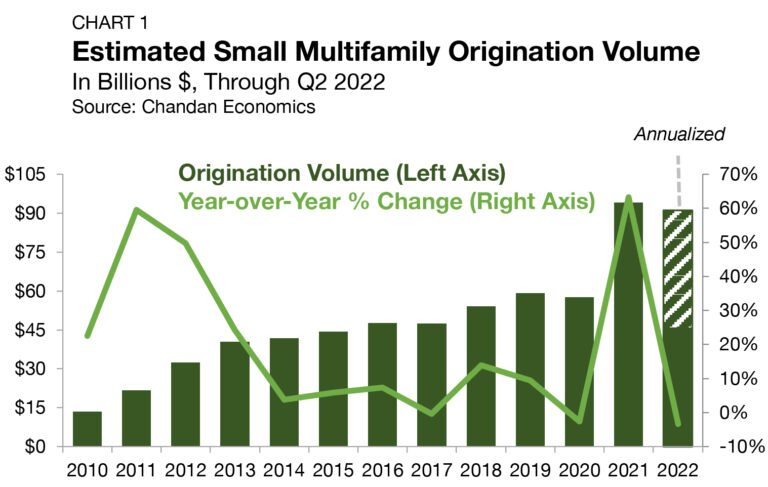
  • Small multifamily originations are on pace to hit $91.1 billion in 2022, just shy of 2021’s record high.
  • Cap rates reached a new record low in the second quarter, declining to 5.0%.
  • Amid surging rents and property-level incomes, expense ratios have returned to pre-pandemic levels.

State of the Market

Storm clouds continue to gather for the U.S. economy and advanced economies around the world. After the U.S. gross domestic product shrank at a 1.6% seasonally adjusted annualized rate in the first quarter of 2022 and current forecasts anticipate another contraction in the second quarter, talks of an impending recession are omnipresent.


Headlining the list of concerns impacting the U.S. economy is inflation. According to the U.S. Bureau of Labor Statistics (BLS) Consumer Price Index, prices of goods and services increased 9.1% from one year ago through June — the highest mark since 1981. As a result, the financial markets are betting that the Federal Reserve will need to keep its foot on the gas at upcoming policy meetings, raising the cost of capital via hiking its Federal Funds rate.


While the macroeconomic landscape has caused stock market investment returns to sink negative thus far in 2022, multifamily real estate has maintained its resiliency. As has historically been the case, during periods of rising interest rates, would-be homeowners tend to re-engage with the rental market as mortgage costs rise, placing upward pressure on rental housing demand.


The multifamily sector and small asset sub-sector continue to benefit from a unique set of circumstances. Residential commercial real estate continues to attract new buyer demand as investors seek assets that can quickly absorb inflationary pressures. Small multifamily prices continued to press higher at a double-digit annual rate in the second quarter of 2022 and cap rates sank to new all-time lows. According to First American, cap rates may be poised to shift higher in the coming months, particularly if benchmark interest rates and property-level incomes keep ascending. All else equal, small multifamily remains to be a sector buttressed by a favorable balance of tenant and investor demand, a sign of stability during a period of heightened business cycle volatility.

Lending Volume

The year-end 2021 estimate of new multifamily lending volume on loans with original balances between $1 million and $7.5 million[1] — including loans for apartment building sales and refinancing — surged to $94.1 billion (Chart 1). The record total represented both a wave of pent-up investment demand that sat on the sidelines during the pandemic uncertainty of 2020 and the anticipation of monetary tightening. 2021’s originations total represented an annual increase of $35.6 billion (up 63.3%) from the year prior.

Through 2022’s halfway mark, small multifamily originations are on pace to reach $91.1 billion. While 2022’s year-to-date pace would reflect a slight 3.3% annual decline, the fact that origination totals remain in the same stratosphere as the 2021 record is noteworthy.


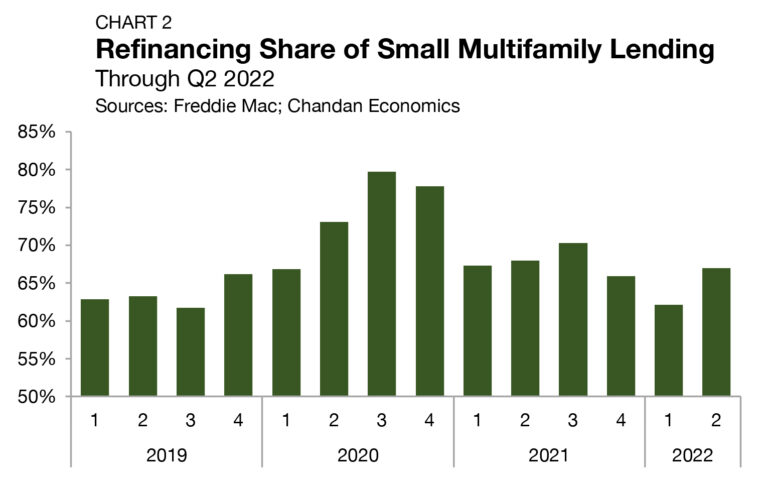
A key factor that led to an unprecedented surge in origination volume last year was a wave of refinancing activity ahead of the Federal Reserve initiating its interest rate hikes. However, even as interest rates rose off of their record lows, refinancing activity did not appreciably fall. In the second quarter of 2022, the refinancing share of small multifamily originations jumped up by 488 bps to land at 67.0% — the highest share since the third quarter of 2021 (Chart 2). Beyond stability in refinancing, a growing investor appetite for multifamily properties in a high inflation environment is the other causal factor keeping originations near record levels.

Arbor Small Multifamily Price Index

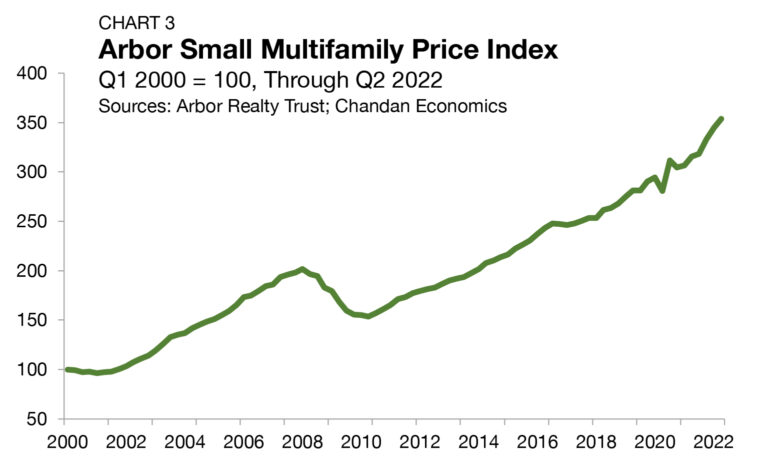
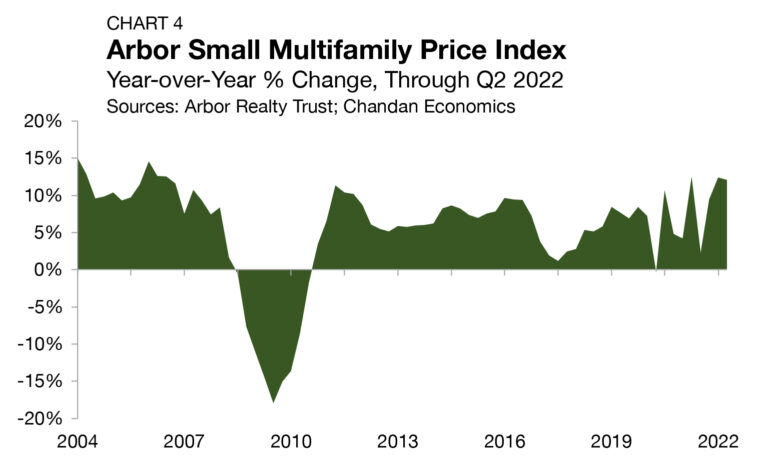
As measured by the Arbor Small Multifamily Price Index[2], small multifamily asset valuations continued to grow at a robust rate in the second quarter of 2022, notching quarterly and annual gains of 2.6% and 12.1%, respectively (Chart 3 and Chart 4). Compared to the pandemic low point (in the second quarter of 2020) asset valuations are up by 26.0%. Moreover, valuations are up by 21.6% over where they were before the start of the pandemic.

Cap Rates & Spreads

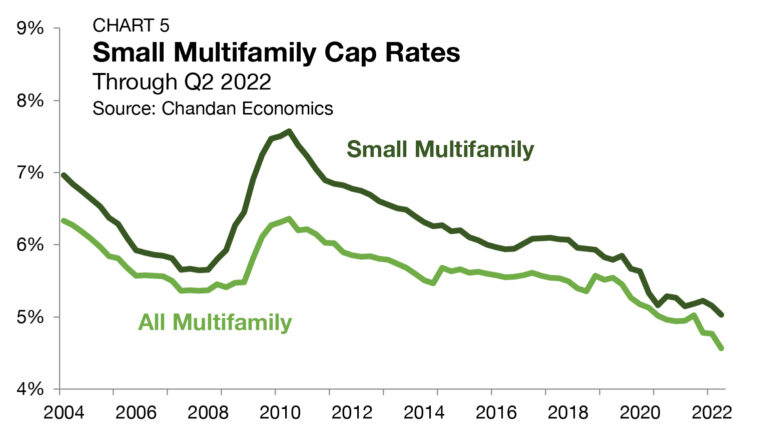
National average cap rates for small multifamily properties declined to a new all-time low in the second quarter of 2022, dropping 12 bps to land at 5.0% (Chart 5). Small multifamily cap rates had held near 5.2% for four consecutive quarters before the second quarter’s compression.

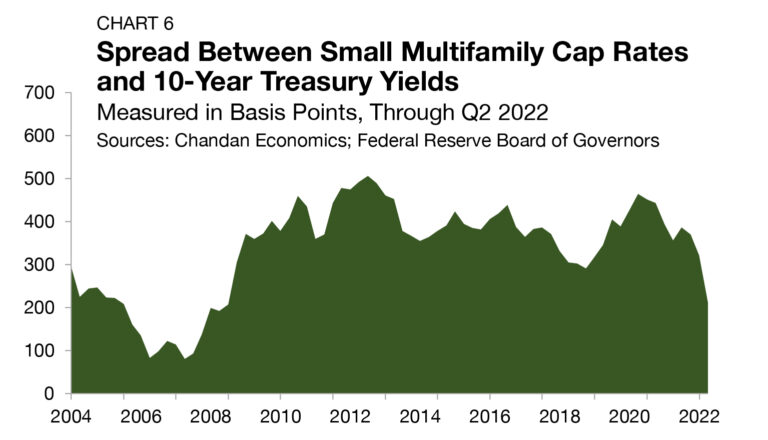
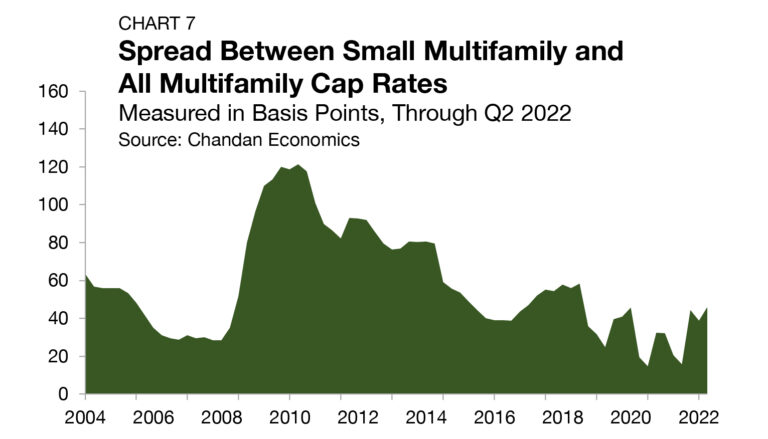
The small multifamily risk premium — a measure of additional compensation that investors require to account for higher levels of risk — is best measured by comparing cap rates to the yield on the 10-Year Treasury. The average small multifamily risk premium cratered in the second quarter of 2022, falling from 320 bps to 210 bps — its lowest level since 2008. (Chart 6). The narrowing spread comes as cap rates have fallen and Treasury yields have soared by nearly a full percentage point amid monetary tightening and increasing inflation. The cap rate spread between small multifamily assets and the rest of the multifamily sector — a measure of the risk unique to smaller properties — increased slightly by 7 bps during the second quarter of 2022, settling at 46 bps (Chart 7).

Expense Ratios

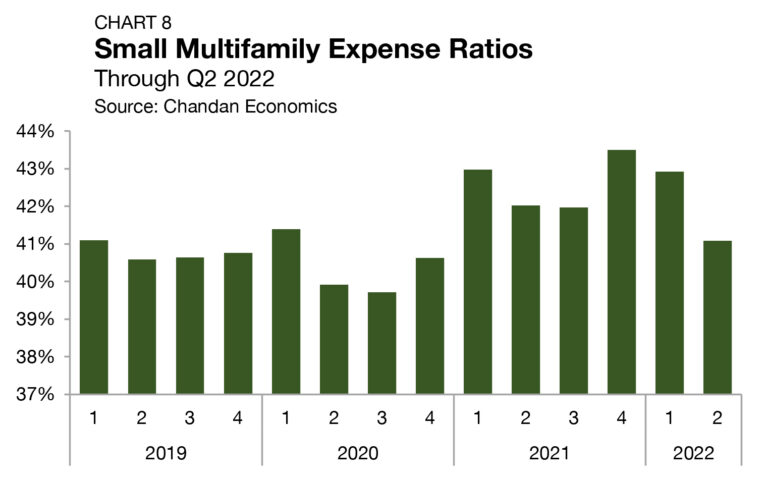
Expense ratios, measured as the relationship between underwritten property-level expenses to effective gross income, surged for small multifamily properties in 2021 — averaging 42.6% for the year, up from 40.7% and 40.4% in 2019 and 2020, respectively (Chart 8). Growing expense ratios last year were likely due to several factors, including abrupt increases in operating costs and higher than average collection losses. An analysis by the National Apartment Association pegs rising insurance premiums and an increase in ‘wear-and-tear’ from tenants who spent more time in their homes as two of the main reasons for the increase.
Further, according to a Chandan Economics analysis of RentRedi data, on-time rental payments were still in recovery in 2021, averaging 78.9% for the year — 228 bps lower than the 2022 average through June (81.2%). Small multifamily expense ratios came back in line with pre-pandemic levels, declining 183 bps between the first and second quarter, landing at 41.1%. The improvement comes as rent collections have normalized and operators have had a longer period to reset rents in an extended high inflation environment. According to Freddie Mac, multifamily net operating incomes grew by nearly 20% in the 12 months ending in June 2022. Moreover, Yardi Matrix reports that multifamily rents were up an average of 13.7% year-over-year in June — exceeding the uncomfortably high 9.1% inflation rate over the same period.

Leverage & Debt Yields

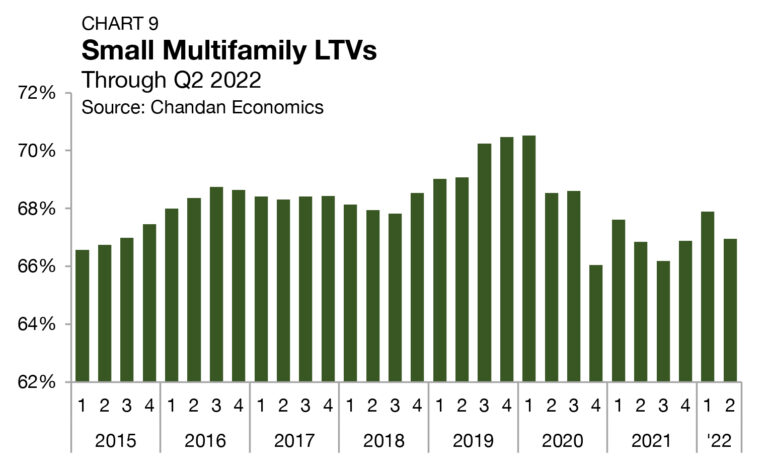
During the first year of the pandemic, loan-to-value ratios (LTVs) on newly originated small multifamily loans cratered — declining from 70.5% in the first quarter of 2020 to a low of 66.0% by the end of the year. While LTVs have recovered slightly from their 2020 depths, momentum has been uneven. LTVs reached a recent high of 67.9% in the first quarter of 2022 but then proceeded to decline 94 bps in the second quarter, landing at 67.0% (Chart 9). With market pricing of multifamily assets rising at a rapid pace in early 2022, the fact that LTVs failed to climb back to near pre-pandemic levels is a sign of disciplined lender underwriting in the face of growing macroeconomic uncertainty.

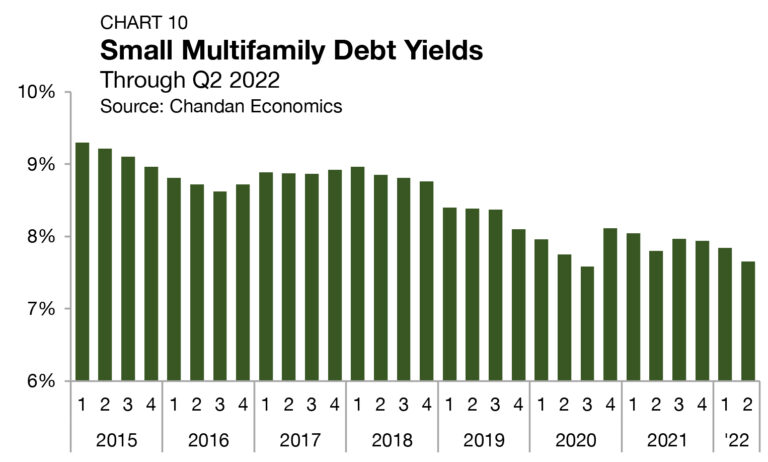
Debt yields for small multifamily loans fell by 19 bps to 7.7% in the second quarter of 2022 — just 7 bps above its all-time low (Chart 10). The inverse of debt yields (the debt per dollar of NOI) rose for small multifamily loans in the second quarter. Small multifamily borrowers secured an average of $13.06 in new debt for every $1 of property NOI, up 32 cents from the previous quarter.

Outlook

The small multifamily sector maintained its stability through 2022’s first half, even as the broader macroeconomic environment has become less predictable. With small multifamily risk premiums falling to their lowest levels since 2008 amid ascending Treasury rates, it is increasingly likely that there will be some upward cap rate pressure. However, even if asset price growth cools in the months ahead, underlying valuations are on a strong footing as broader housing market fundamentals should elevate rental demand over the short term. Single-family mortgage credit availability tightened in each month during the second quarter as borrowing costs rose higher — both factors should increase the number of households interested in multifamily housing. On balance, while the small multifamily sub-sector is not immune from disruption, it is favorably insulated to rise above the current set of business cycle headwinds.

For more small multifamily research and insights, visit arbor.com/articles

1 All data, unless otherwise stated, are based on Chandan Economics’ analysis of a limited pool of loans with original balances of $1 million to $7.5 million and loan-to-value ratios above 50%.

2 The Arbor Small Multifamily Price Index (ASMPI) uses model estimates of small multifamily rents and compares them against small multifamily cap rates. The index measures the estimated average price appreciation on small multifamily properties with 5 to 50 units and primary mortgages of $1 million to $7.5 million. For the full methodology, visit arbor.com/asmpi-faq.

Disclaimer All content is provided herein “as is” and neither Arbor Realty Trust, Inc. or Chandan Economics, LLC (“the Companies”) nor their affiliated or related entities, nor any person involved in the creation, production and distribution of the content make any warranties, express or implied. The Companies do not make any representations regarding the reliability, usefulness, completeness, accuracy, currency nor represent that use of any information provided herein would not infringe on other third party rights. The Companies shall not be liable for any direct, indirect or consequential damages to the reader or a third party arising from the use of the information contained herein.