Current Reports
As housing costs spiral, rental affordability has become a more urgent issue, burdening a greater number of Americans. Arbor’s Affordable Housing Trends Report Spring 2024, developed in partnership with Chandan Economics, examines the major policies and programs shaping the marketplace at a time when overdue federal funding expansions have increased agency budgets.
Articles
In front of professionals and executives from more than 120 companies at the Real Estate Pride Roundtable in New York City in April, dozens of speakers shared honest perspectives on how far the commercial real estate industry has come on LGBTQ+ inclusion and how much more it has to go.
Articles
Lifestyle renters — those who have the means to own but prefer to rent or are willing to pay more for apartments with amenities — have become a key driver of rental demand in single-family rental homes, build-to-rent communities, and other types of high-quality multifamily housing. With this small yet influential demographic growing, our research teams examine and explain the factors driving lifestyle renter demand.
Articles
On balance, the SFR sector continues to demonstrate strength amid economic turmoil, attracting increased attention from the broader multifamily investment community.
Articles
With nearly one-fifth of multifamily properties now over 65 years old, it’s time to consider solutions for rejuvenating the rental housing stock in the U.S. While building rehabs are a tried-and-true solution, build-to-rent (BTR) is an alternative that is well-positioned to expand as Americans increasingly favor renting over homeownership.
Articles
In a year when inflation and elevated interest rates weakened affordability, the rental housing sector strengthened and expanded. An analysis of newly released U.S. Census Bureau Housing Vacancies and Homeownership data shows the number of rental households climbed in 2023.
Analysis
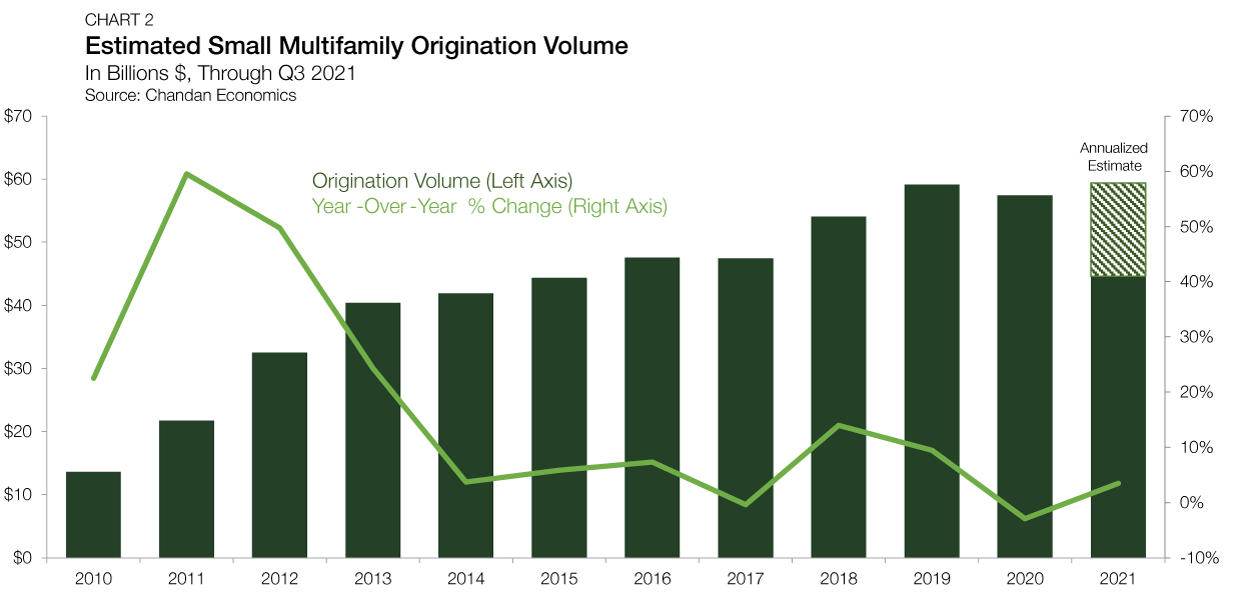
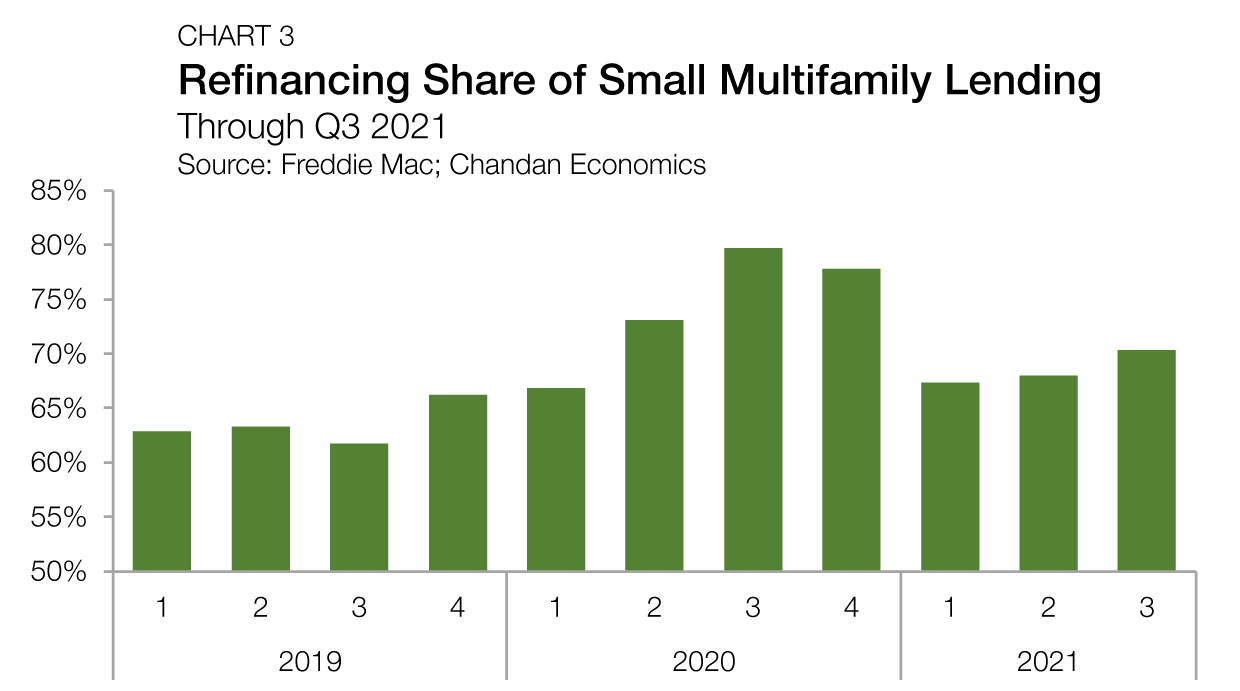
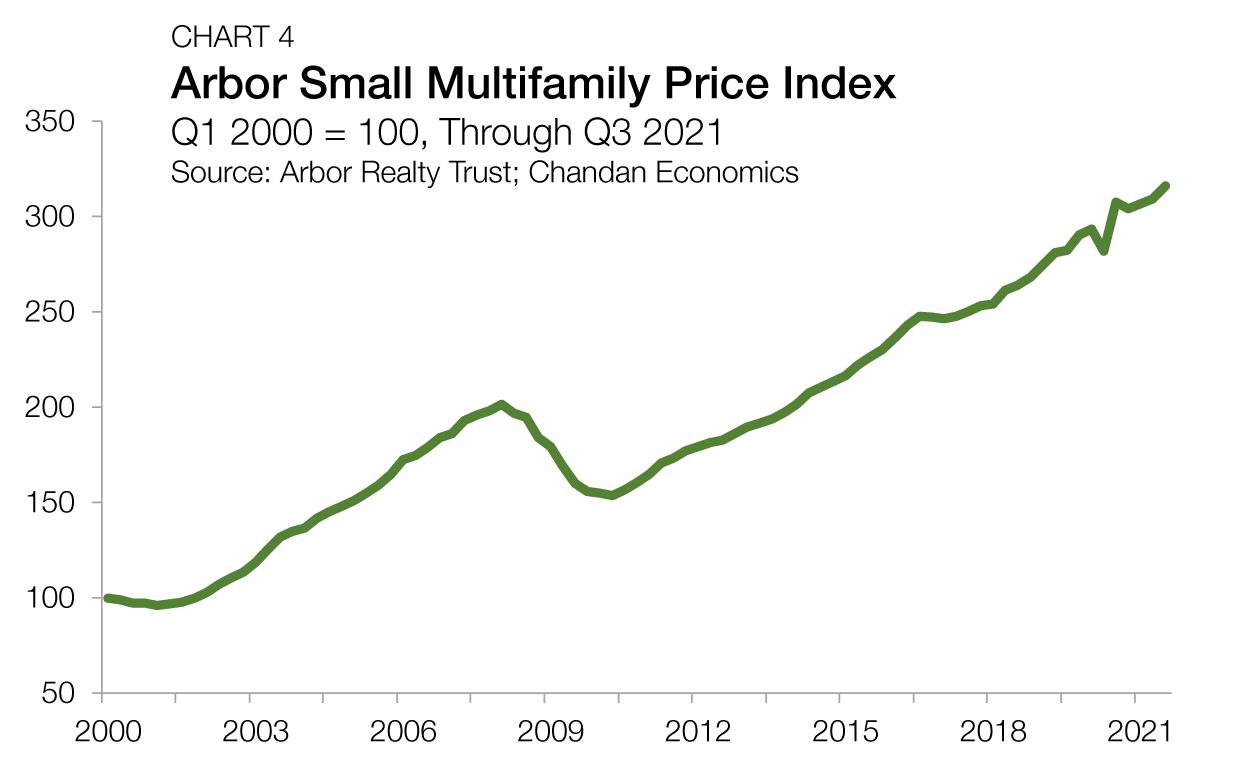
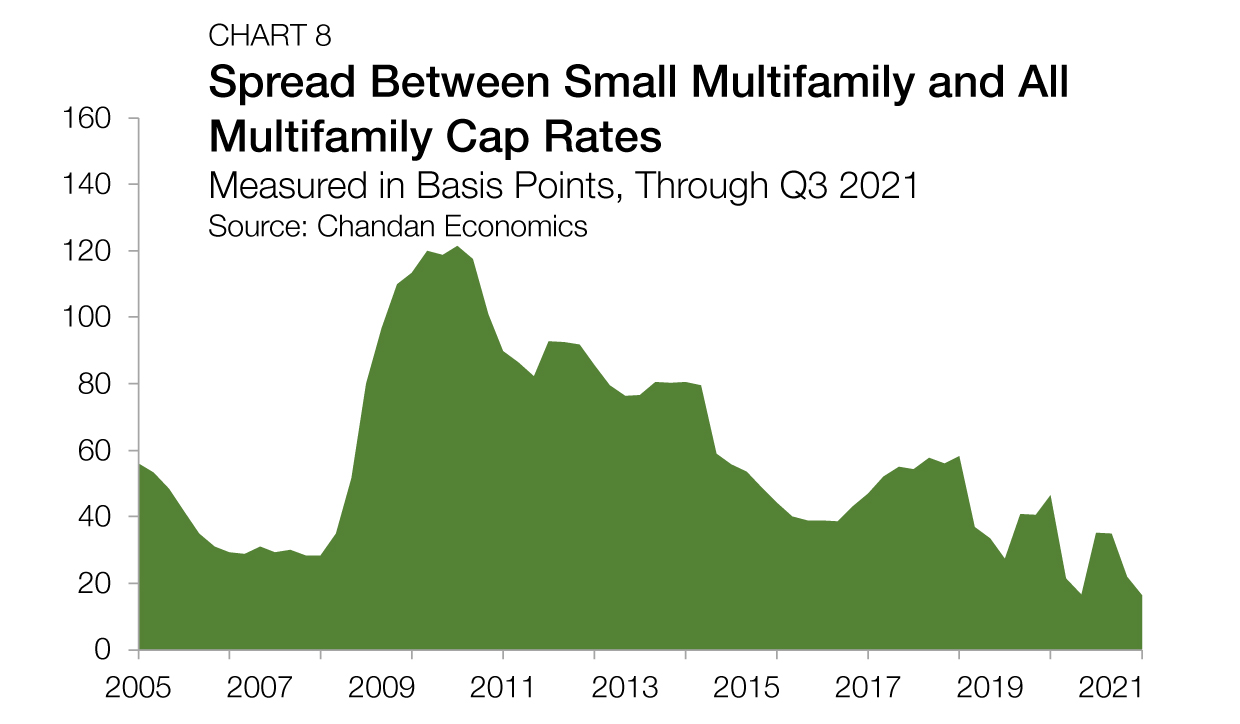
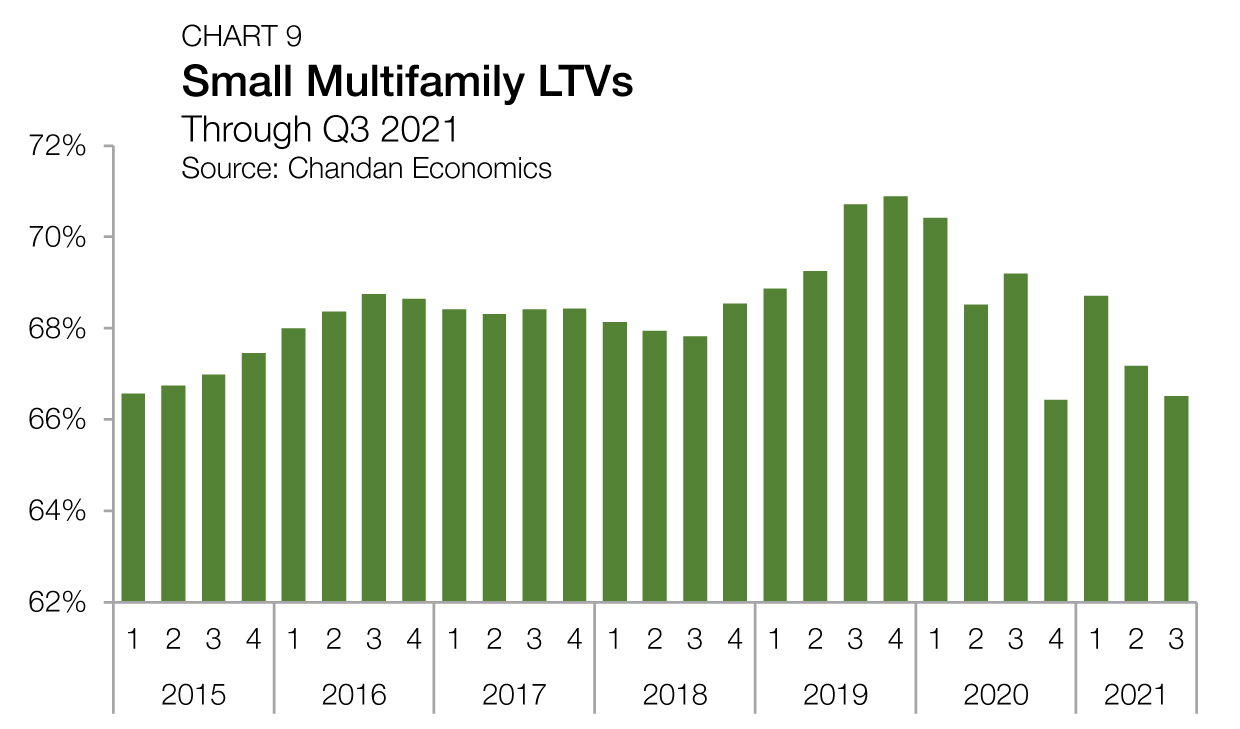
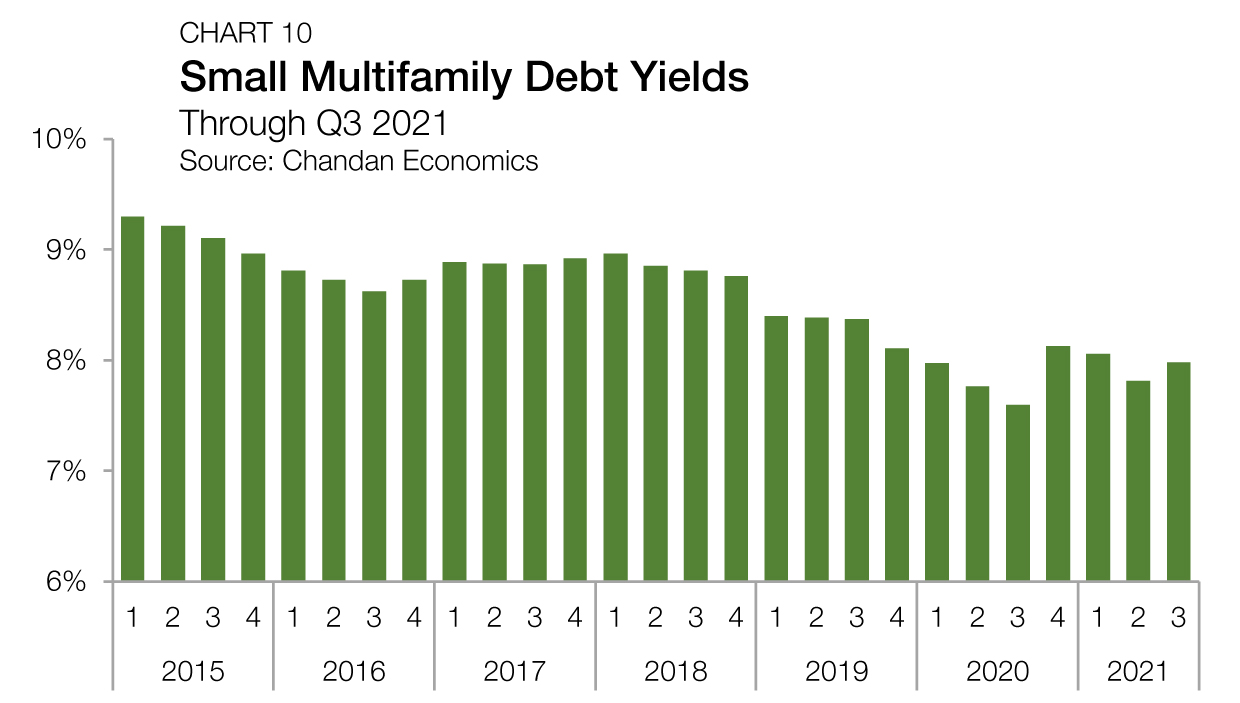
The first quarter opens a new chapter for the small multifamily market after a year where the subsector demonstrated its strength and resiliency amid stiff economic headwinds.
ISS See the below ISS chart for guidance on finding information and resources related to ESG at Arbor Realty Trust. Please reach out to [email protected] with any questions.