Articles
In his latest Arbor Realty Trust video, Dr. Sam Chandan, a leading commercial real estate scholar, shares his insights into the findings of our latest Top Markets for Multifamily Investment Report, developed in partnership with Chandan Economics. The noted NYU professor outlines the market-level results of the Arbor-Chandan Opportunity Matrix, which spotlights multifamily markets that offer optimal value to commercial real estate investors.
Articles
Generation Z’s potential for household formation could soon reshape many U.S. metropolitan areas. From McAllen, TX, to Hartford, CT, explore the top multifamily markets where rental demand is set to rise as Gen Z leaves the nest.
Analysis
Indianapolis ranked as the top multifamily investment market in the U.S., in the latest Top Markets for Multifamily Investment Report from Arbor Realty Trust and @Chandan Economics. The market has been supported by strong labor market conditions, tight occupancy levels, and a favorable affordability profile.
Current Reports
The latest Single-Family Rental Investment Trends Report from Arbor Realty Trust, developed in partnership with Chandan Economics, examines a commercial real estate sector that has proved to be both stable and resilient. Supported by strong occupancy, positive rent growth, and loosening capital markets, SFR remains firmly grounded on a path of steady growth.
Analysis
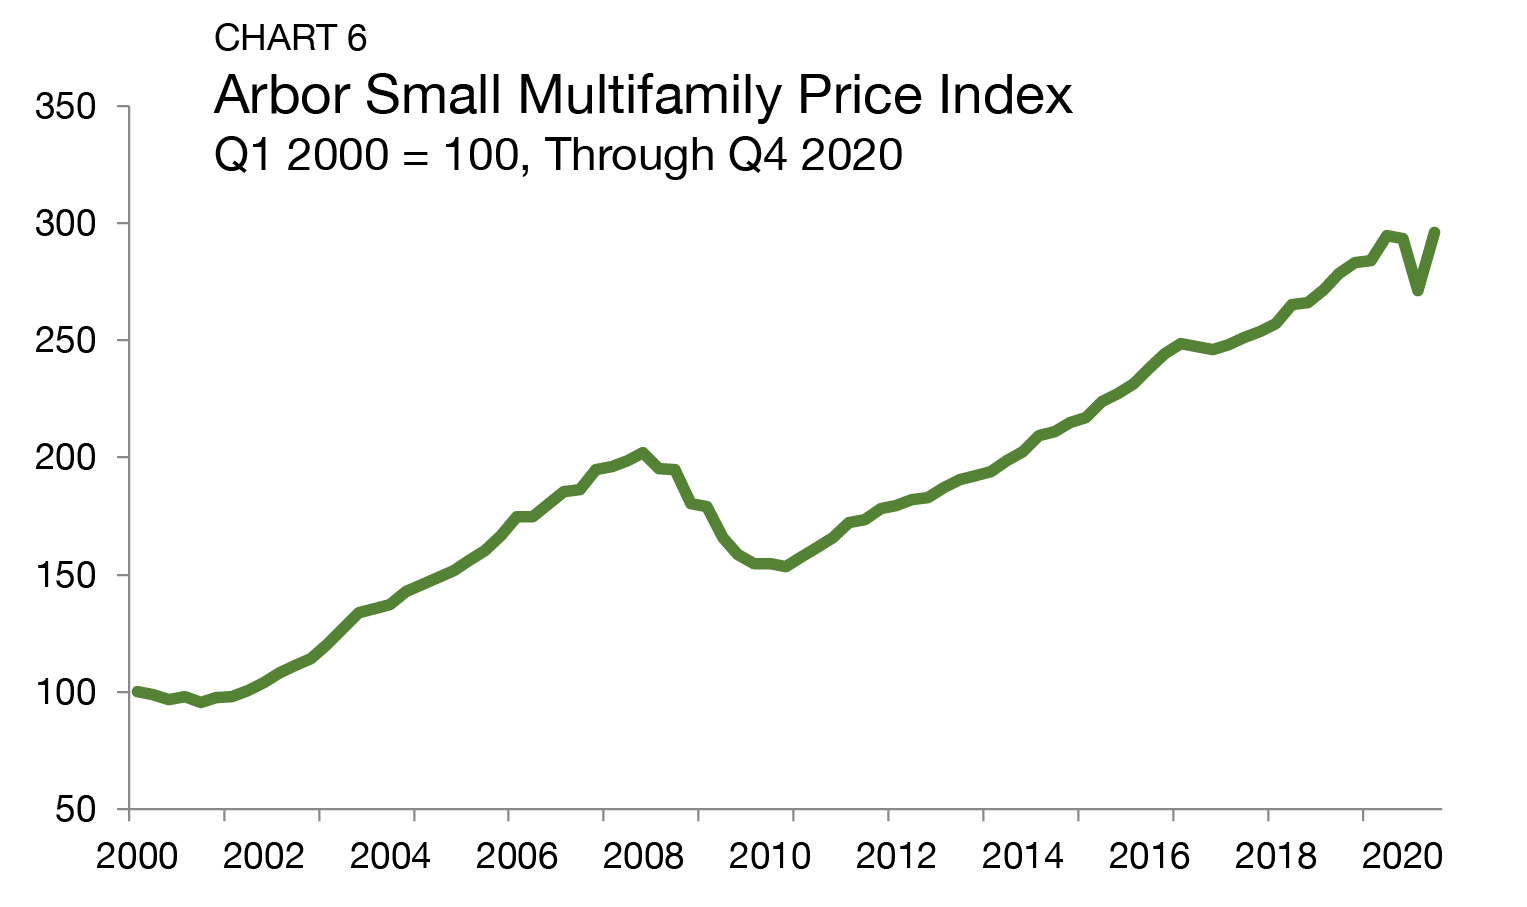
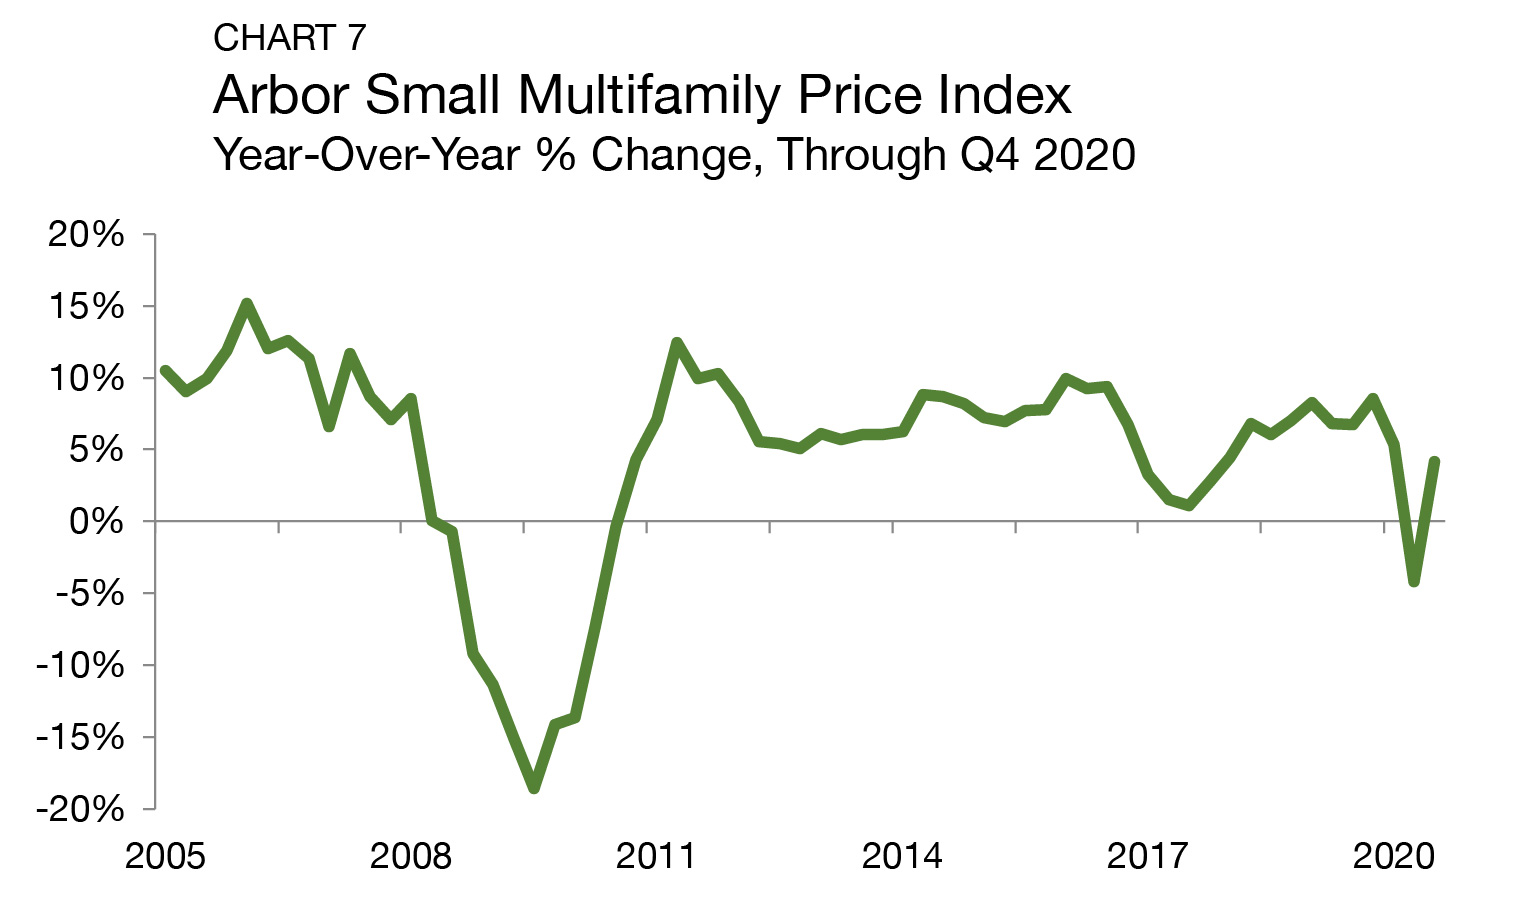
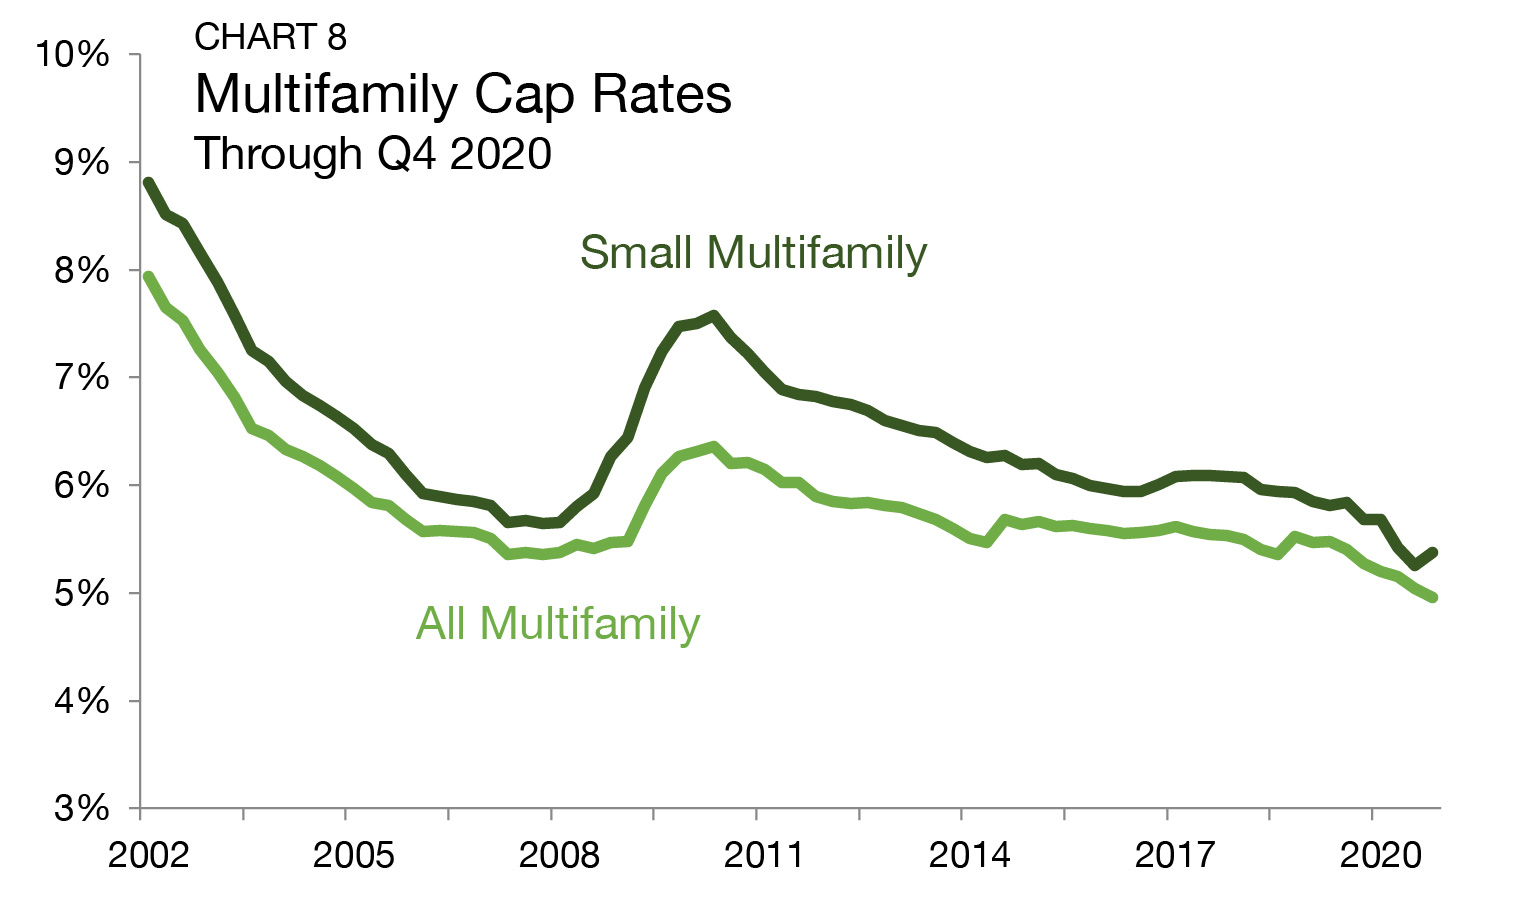
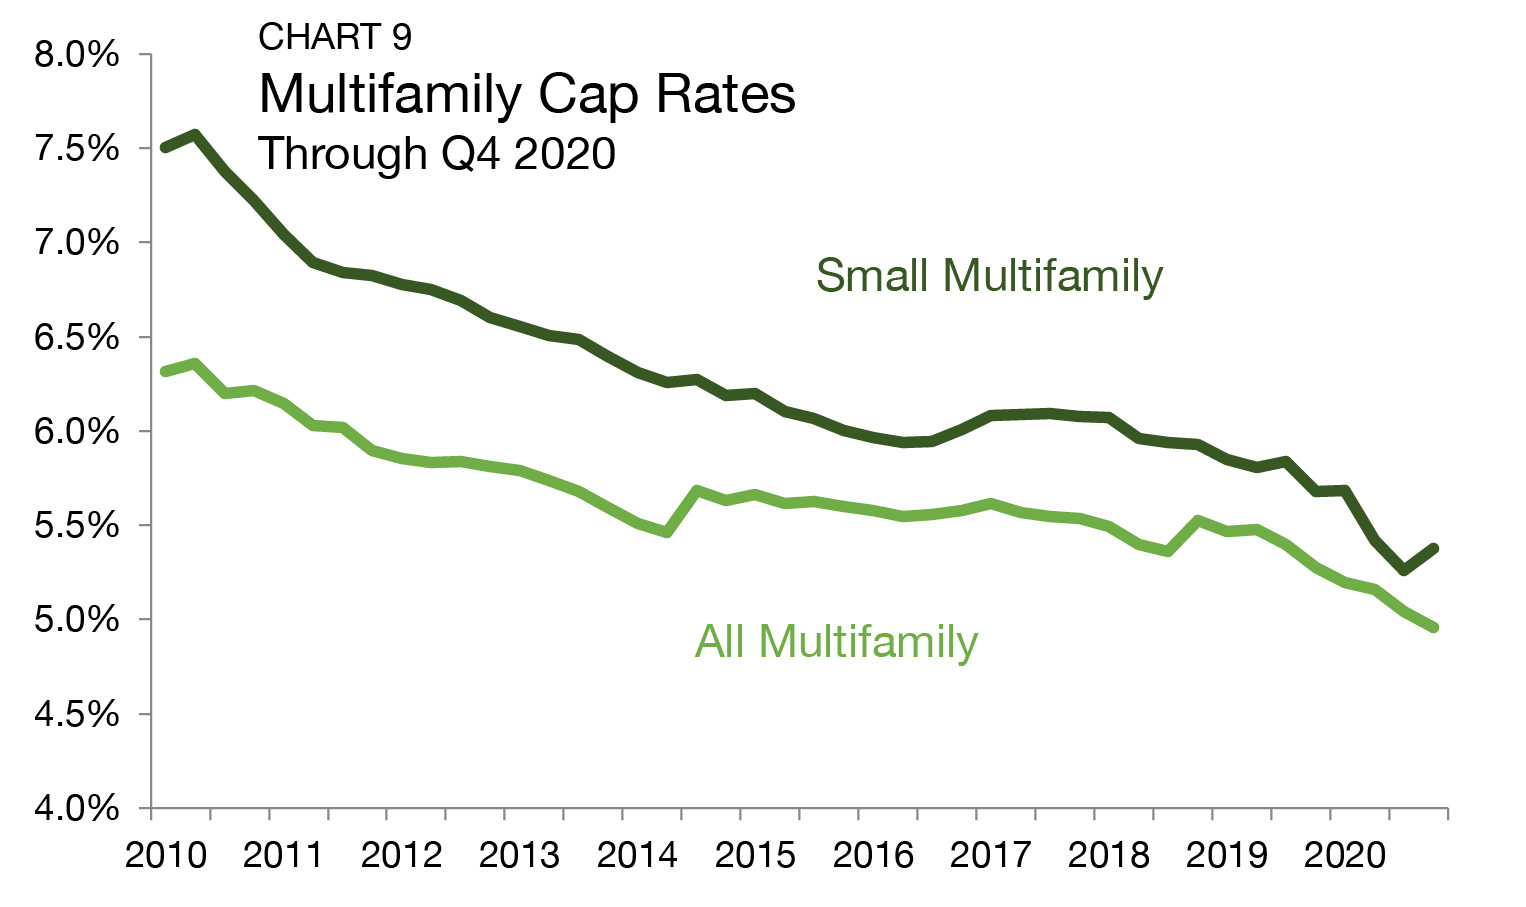
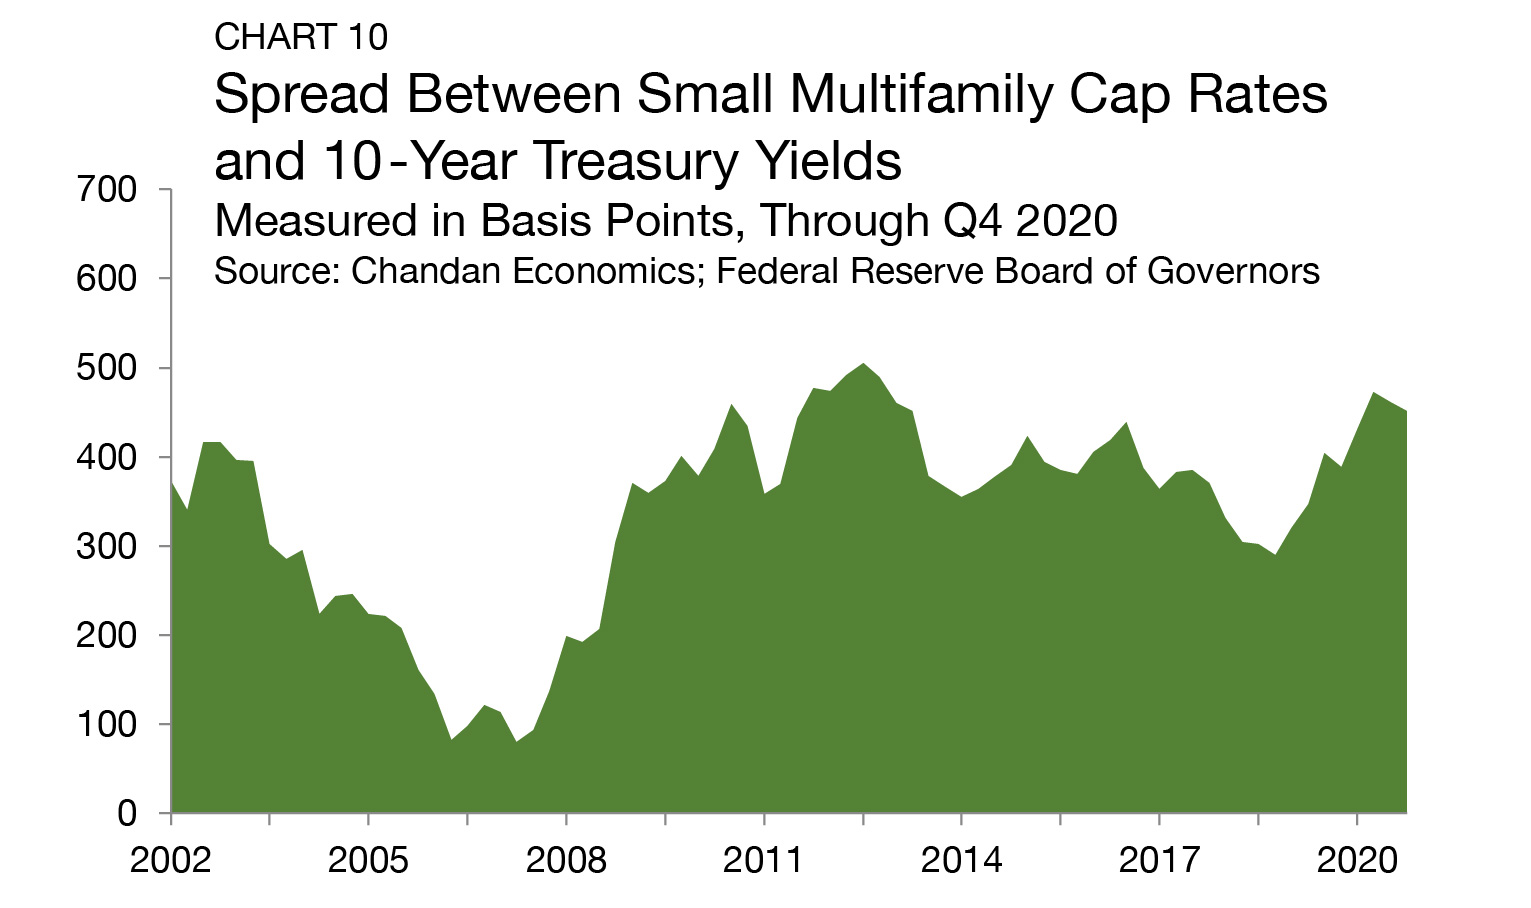
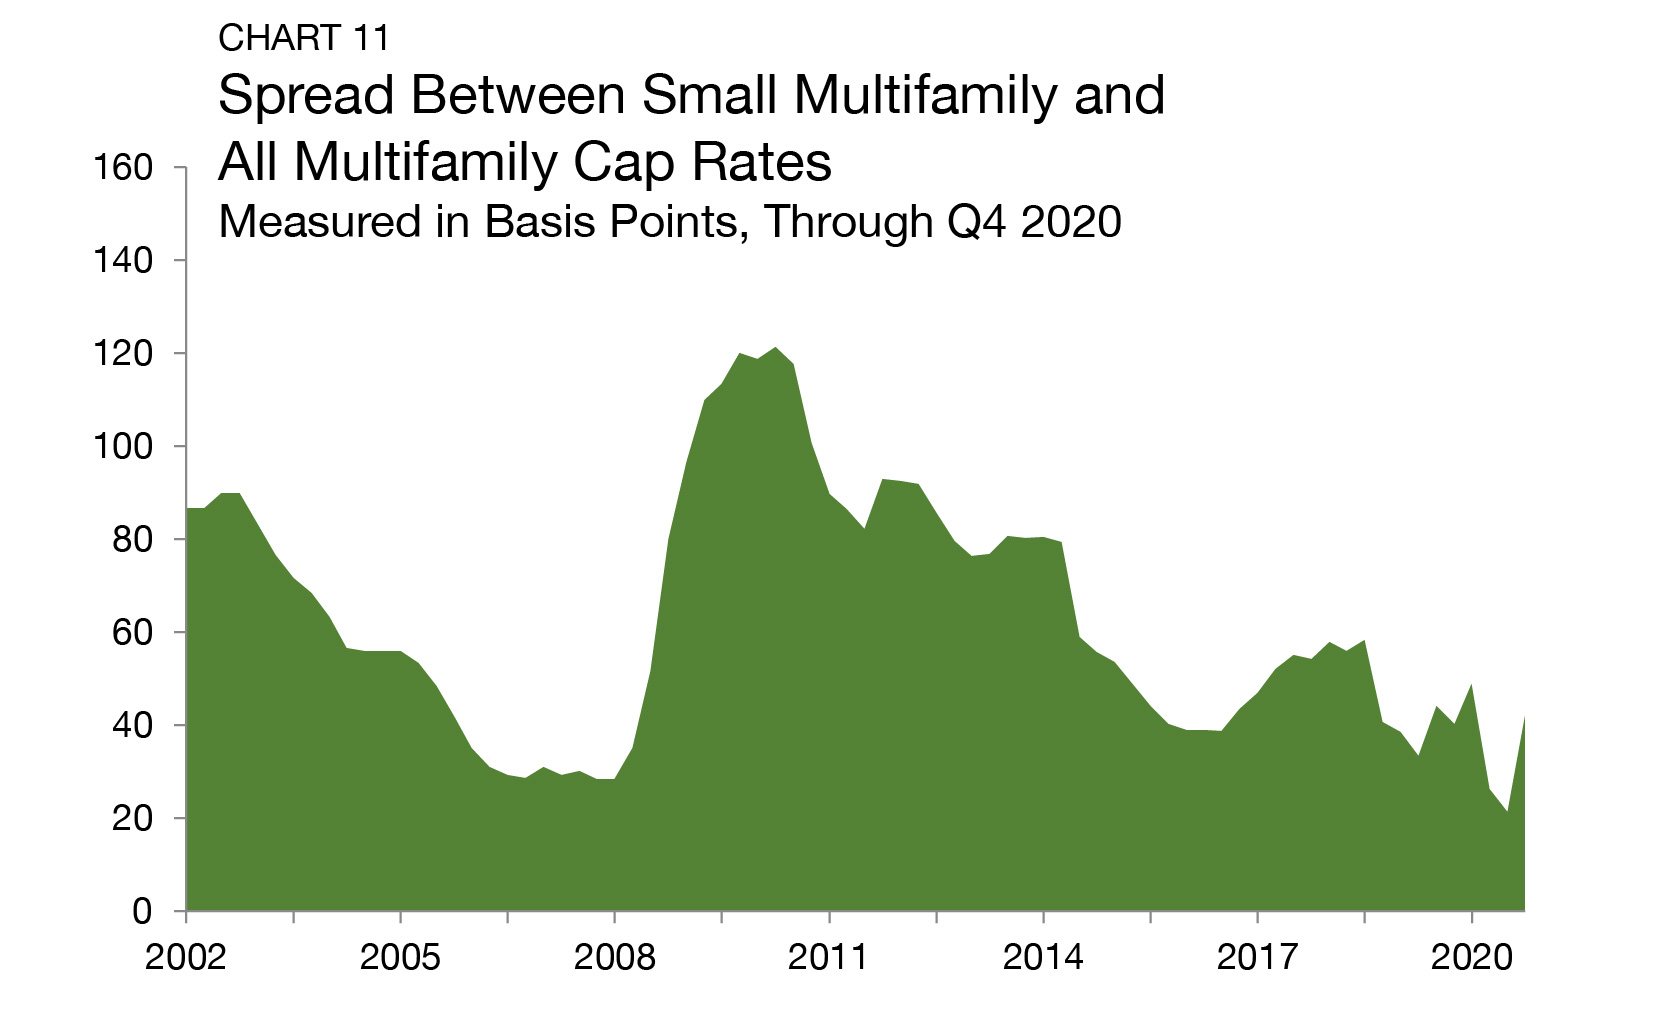
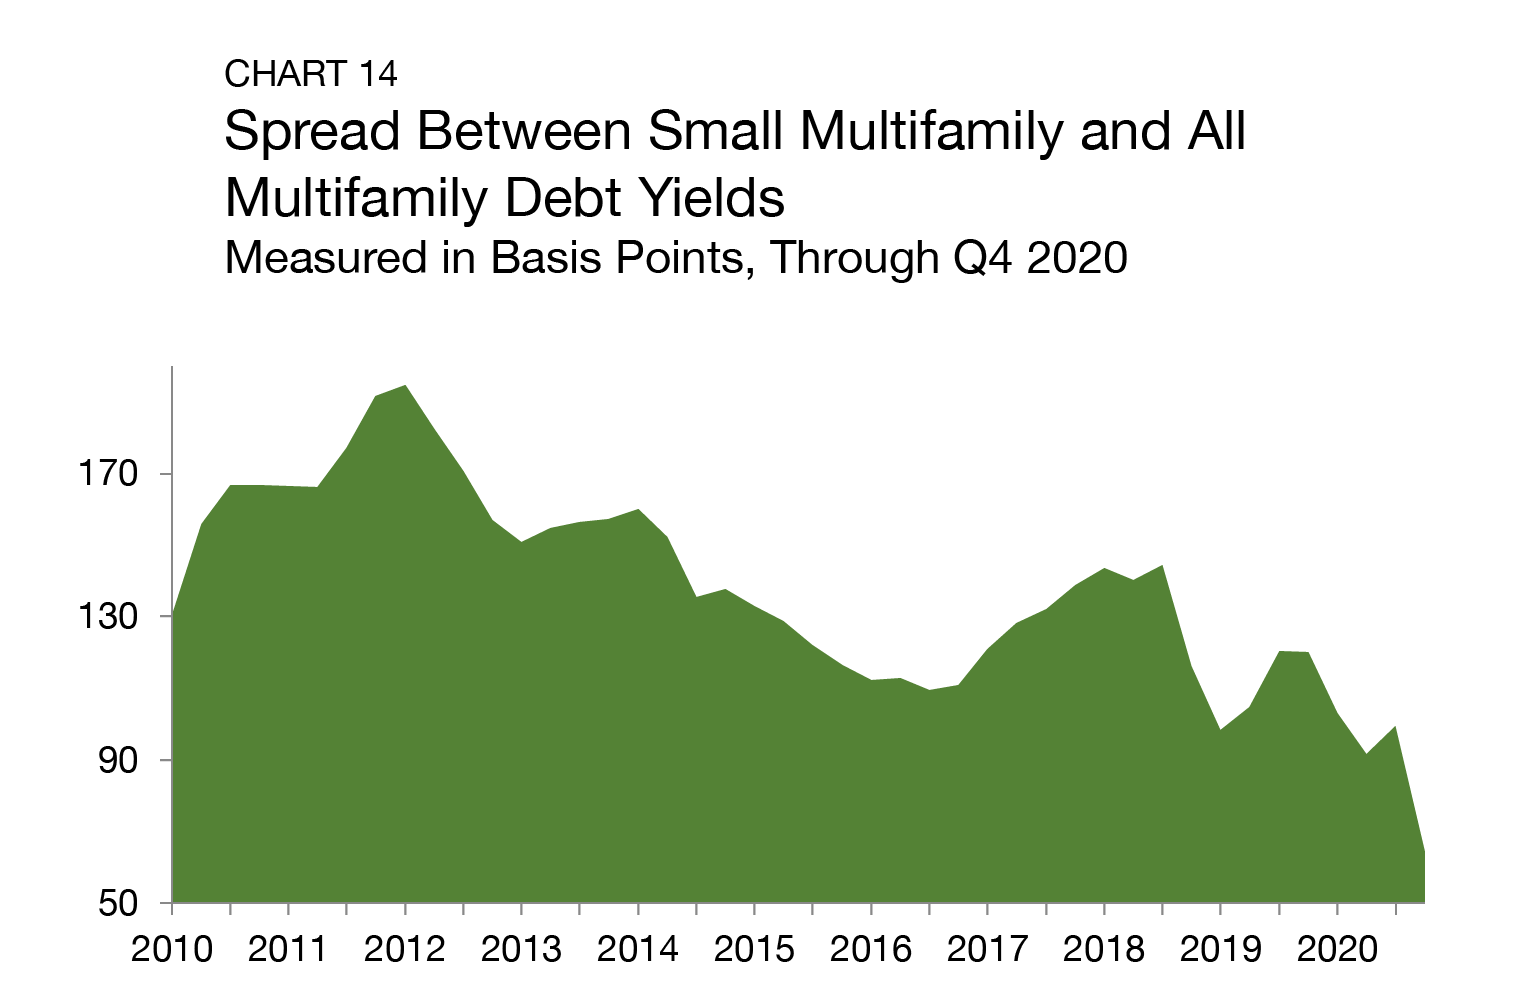
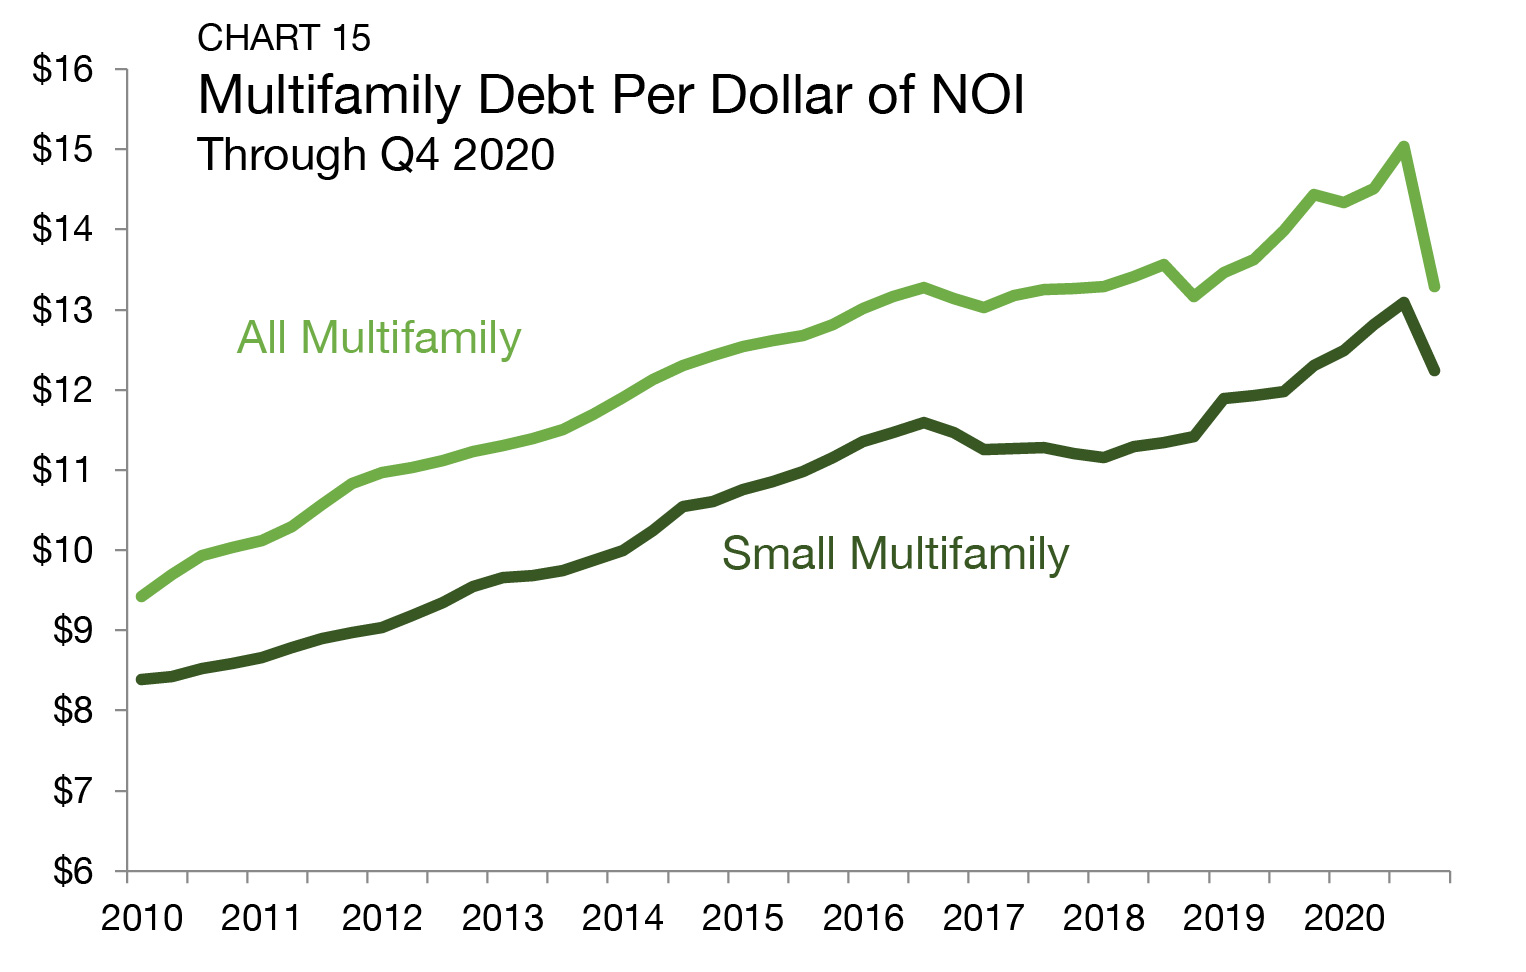
The small multifamily sector entered 2026 on a strong note, even as lending conditions remained shaped by persistently high interest rates and regulatory uncertainties.
Articles
As the single-family rental (SFR) sector has matured, build-to-rent (BTR) has become a key source of new supply. Purpose-built rental communities are absorbing demand from households seeking the space and privacy of single-family living without the financial or lifestyle commitments of homeownership. Newly released U.S. Census Bureau data show that while SFR/BTR construction continued to decline from its 2024 peak through year-end 2025, development activity remains elevated compared to historical norms.
Articles
In commercial real estate, long-term financial partnerships drive deals. At the recent Real Estate Pride Roundtable in New York City, CRE leaders shared how living openly with their LGBTQ+ identities has allowed them to lead with authenticity in the boardroom and in life. This Pride Month, Arbor celebrates authenticity in the workplace.