Small multifamily lending activity rose during the first half of 2026. According to the latest Small Multifamily Investment Trends Report from Arbor Realty Trust and Chandan Economics, originations on loans with original balances between $1 million and $9 million reached an annualized pace of $71.6 billion through the second quarter. At this pace, originations are running 2.8% above the $69.6 billion total for 2025, placing small multifamily on pace for a third consecutive annual increase.
Small Multifamily Investment Trends Report Q3 2026
Originations Remain Healthy as Yield Spreads Continue to Constrain Pricing
Key Findings
-
Small multifamily lending remained healthy as originations edged above last year’s levels.
-
Historically narrow cap rate spreads held valuations within a relatively narrow range.
-
Credit conditions tightened modestly as debt yields rose and lenders required greater income protection.
State of the Market
The small multifamily real estate sector entered the second half of 2026 demonstrating strength and stability as capital markets remained selective and property-level performance continued to be mixed.
Last quarter, lending activity maintained a healthy pace, while valuations remained steady. Credit conditions became a little less accommodative as the market experienced renewed interest rate volatility.
The broader apartment market has followed a similarly mixed pattern. The National Multifamily Housing Council’s (NMHC) Quarterly Survey of Apartment Conditions (July 2026) shows that market tightness has risen, indicating improving vacancy conditions and rent growth for operators. However, sales volume and measures of capital availability both decreased. Taken together, the NMHC survey suggests that operating conditions have shown measured improvement, while capital markets remained cautious.
Recent pricing and credit indicators point to a stable market, with valuations, occupancy, and leverage remaining within relatively narrow ranges. With sufficient liquidity and durable property-level performance, a material decline in small multifamily pricing appears to be unlikely. At the same time, cap rate spreads over benchmark interest rates, such as the 10-year Treasury, have remained historically narrow, limiting the potential for cap rate compression and valuation acceleration.
Small multifamily started the third quarter firmly planted on a stable path of growth as the sector’s performance gradually normalized. With renter demand sufficiently supporting strong originations activity, it is likely to remain on an upward trajectory despite higher borrowing costs and selective financing conditions.
Lending Volume
Small multifamily originations reached an annualized pace of $71.6 billion through the first half of 2026, exceeding the 2025 full-year total of $69.6 billion by 2.8% (Chart 1). If sustained, 2026 would rank among the strongest years on record for loans with original balances between $1 million and $9 million. Recent lending activity suggests small multifamily originations have been gradually recovering, even while the cost of capital remains well above pre-pandemic norms.
1 All data, unless otherwise stated, are based on Chandan Economics’ analysis of a limited pool of loans with original balances of $1 million to $9.0 million and loan-to-value ratios above 50%.
Loans by Purpose
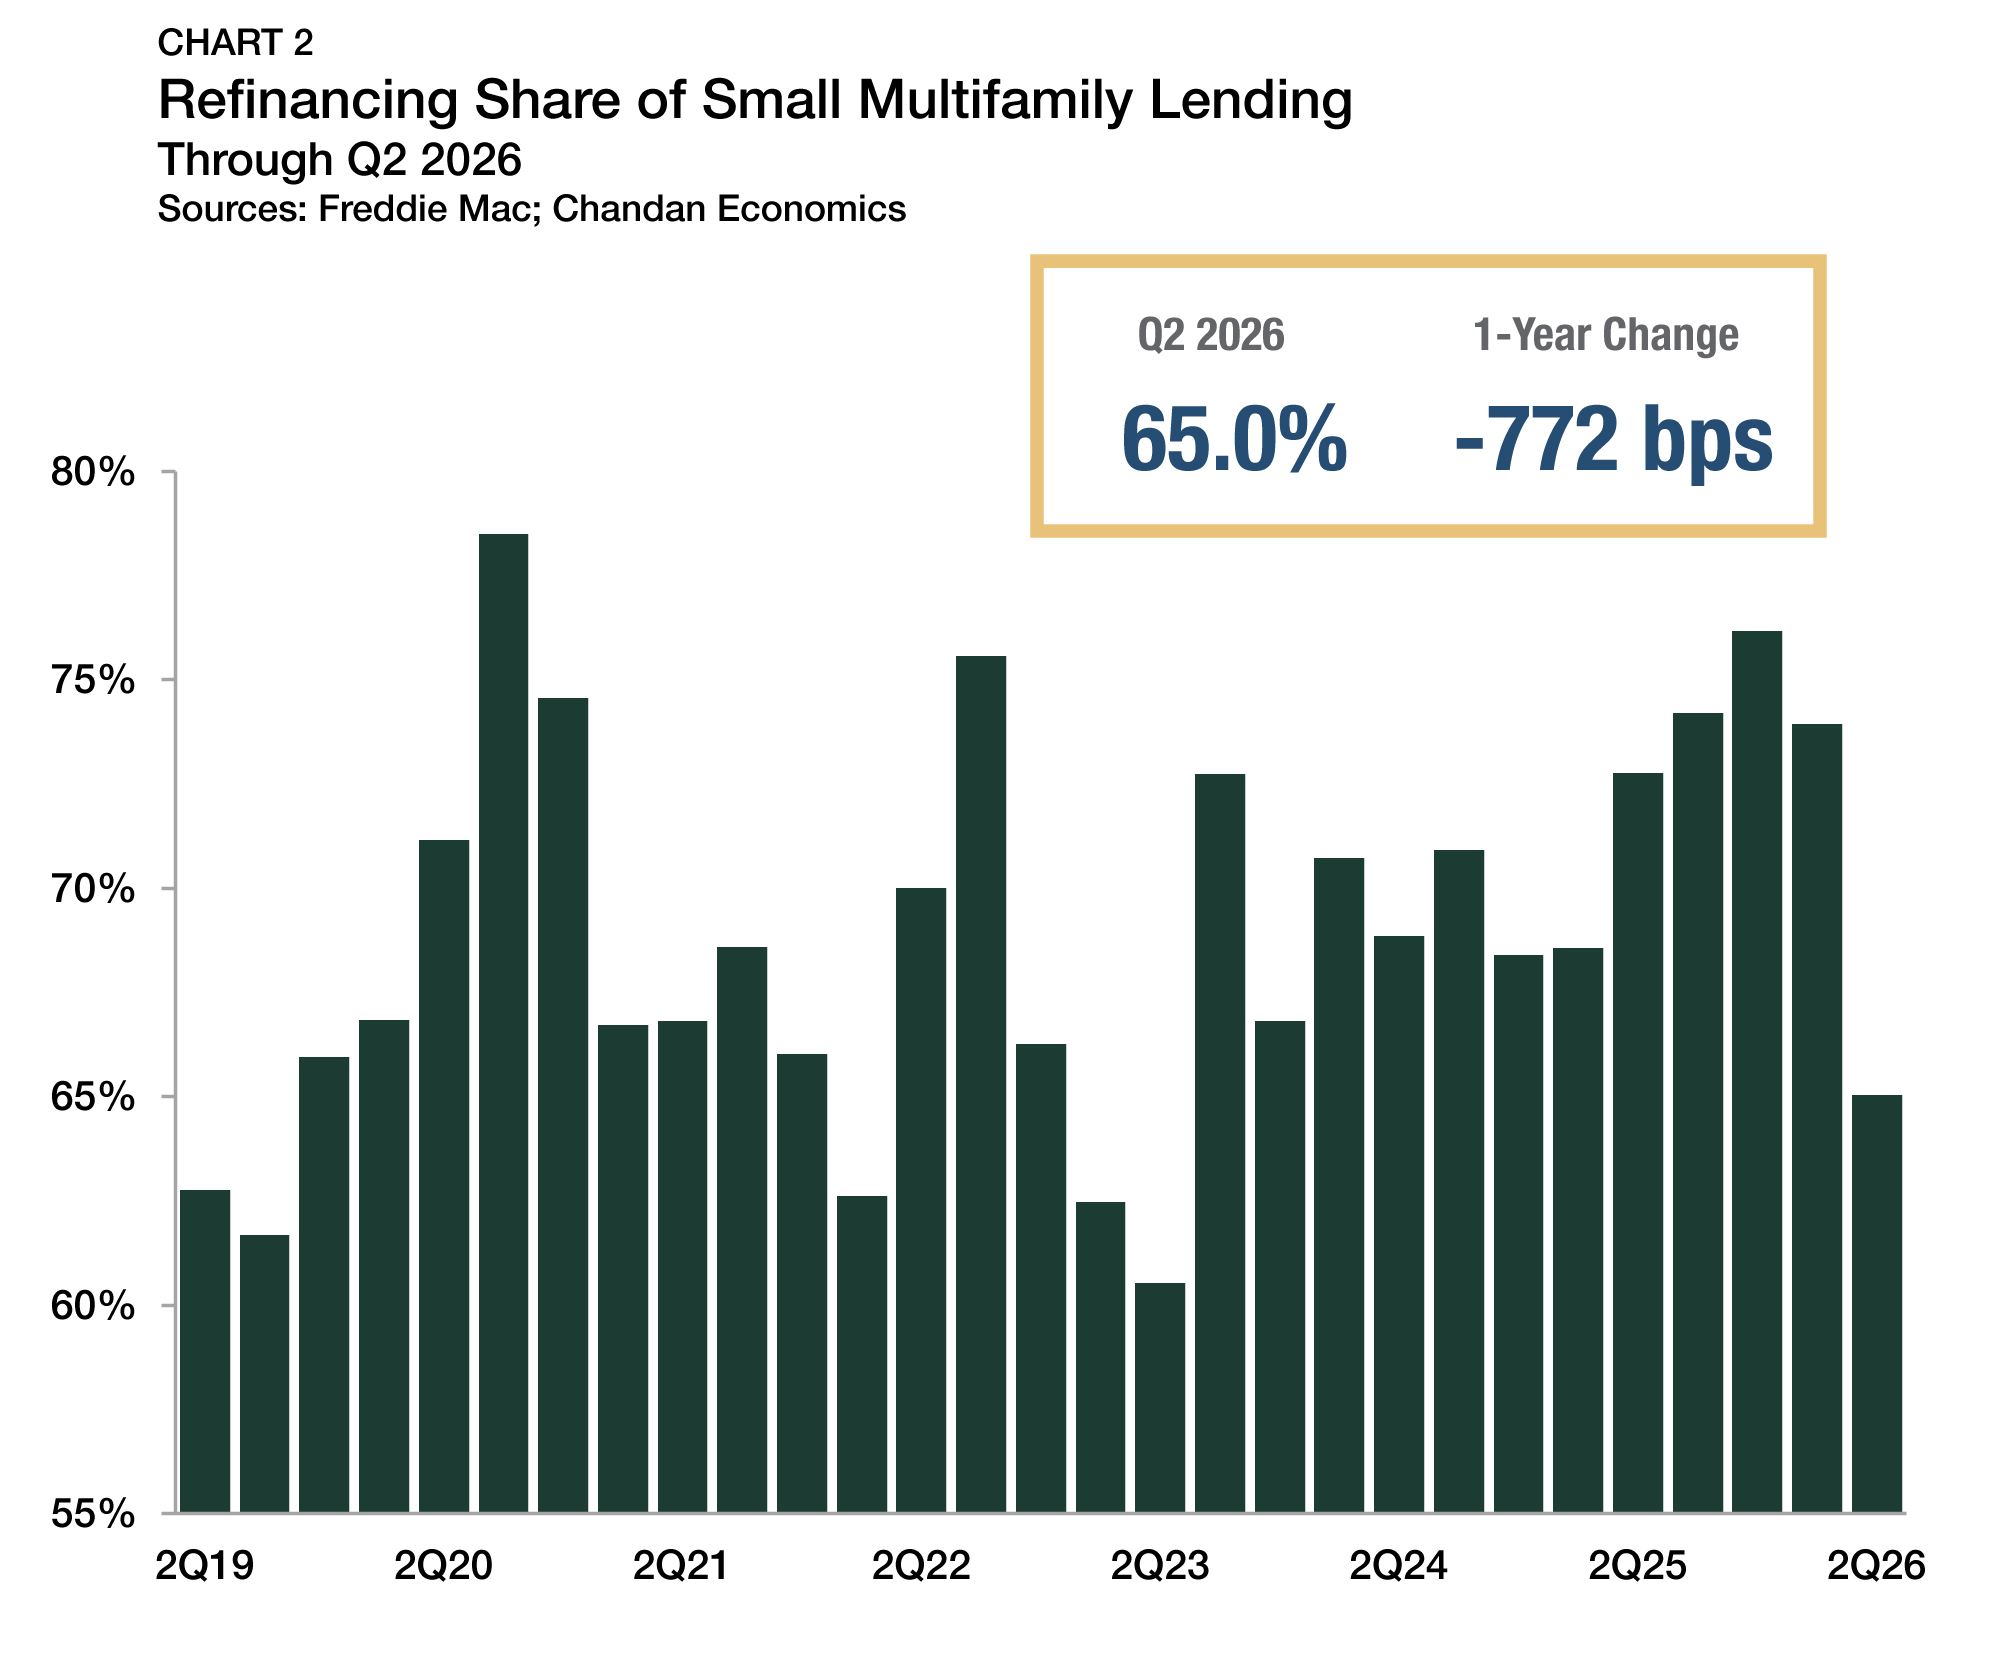
Refinancings continued to be the dominant source of small multifamily lending activity in the second quarter of 2026, accounting for 65.0% of originations (Chart 2). While refinancings comprised the majority of lending activity, the loan-purpose mix reflects two forces moving in opposite directions.
On one hand, loan maturities have continued to support refinancing demand. On the other hand, rising interest rates may be influencing borrowers’ decisions to delay resetting their debt, particularly when it is discretionary. As a result, small multifamily lending tilted toward recapitalization, while some borrowers waited for more favorable rates before refinancing.
Arbor Small Multifamily Price Index
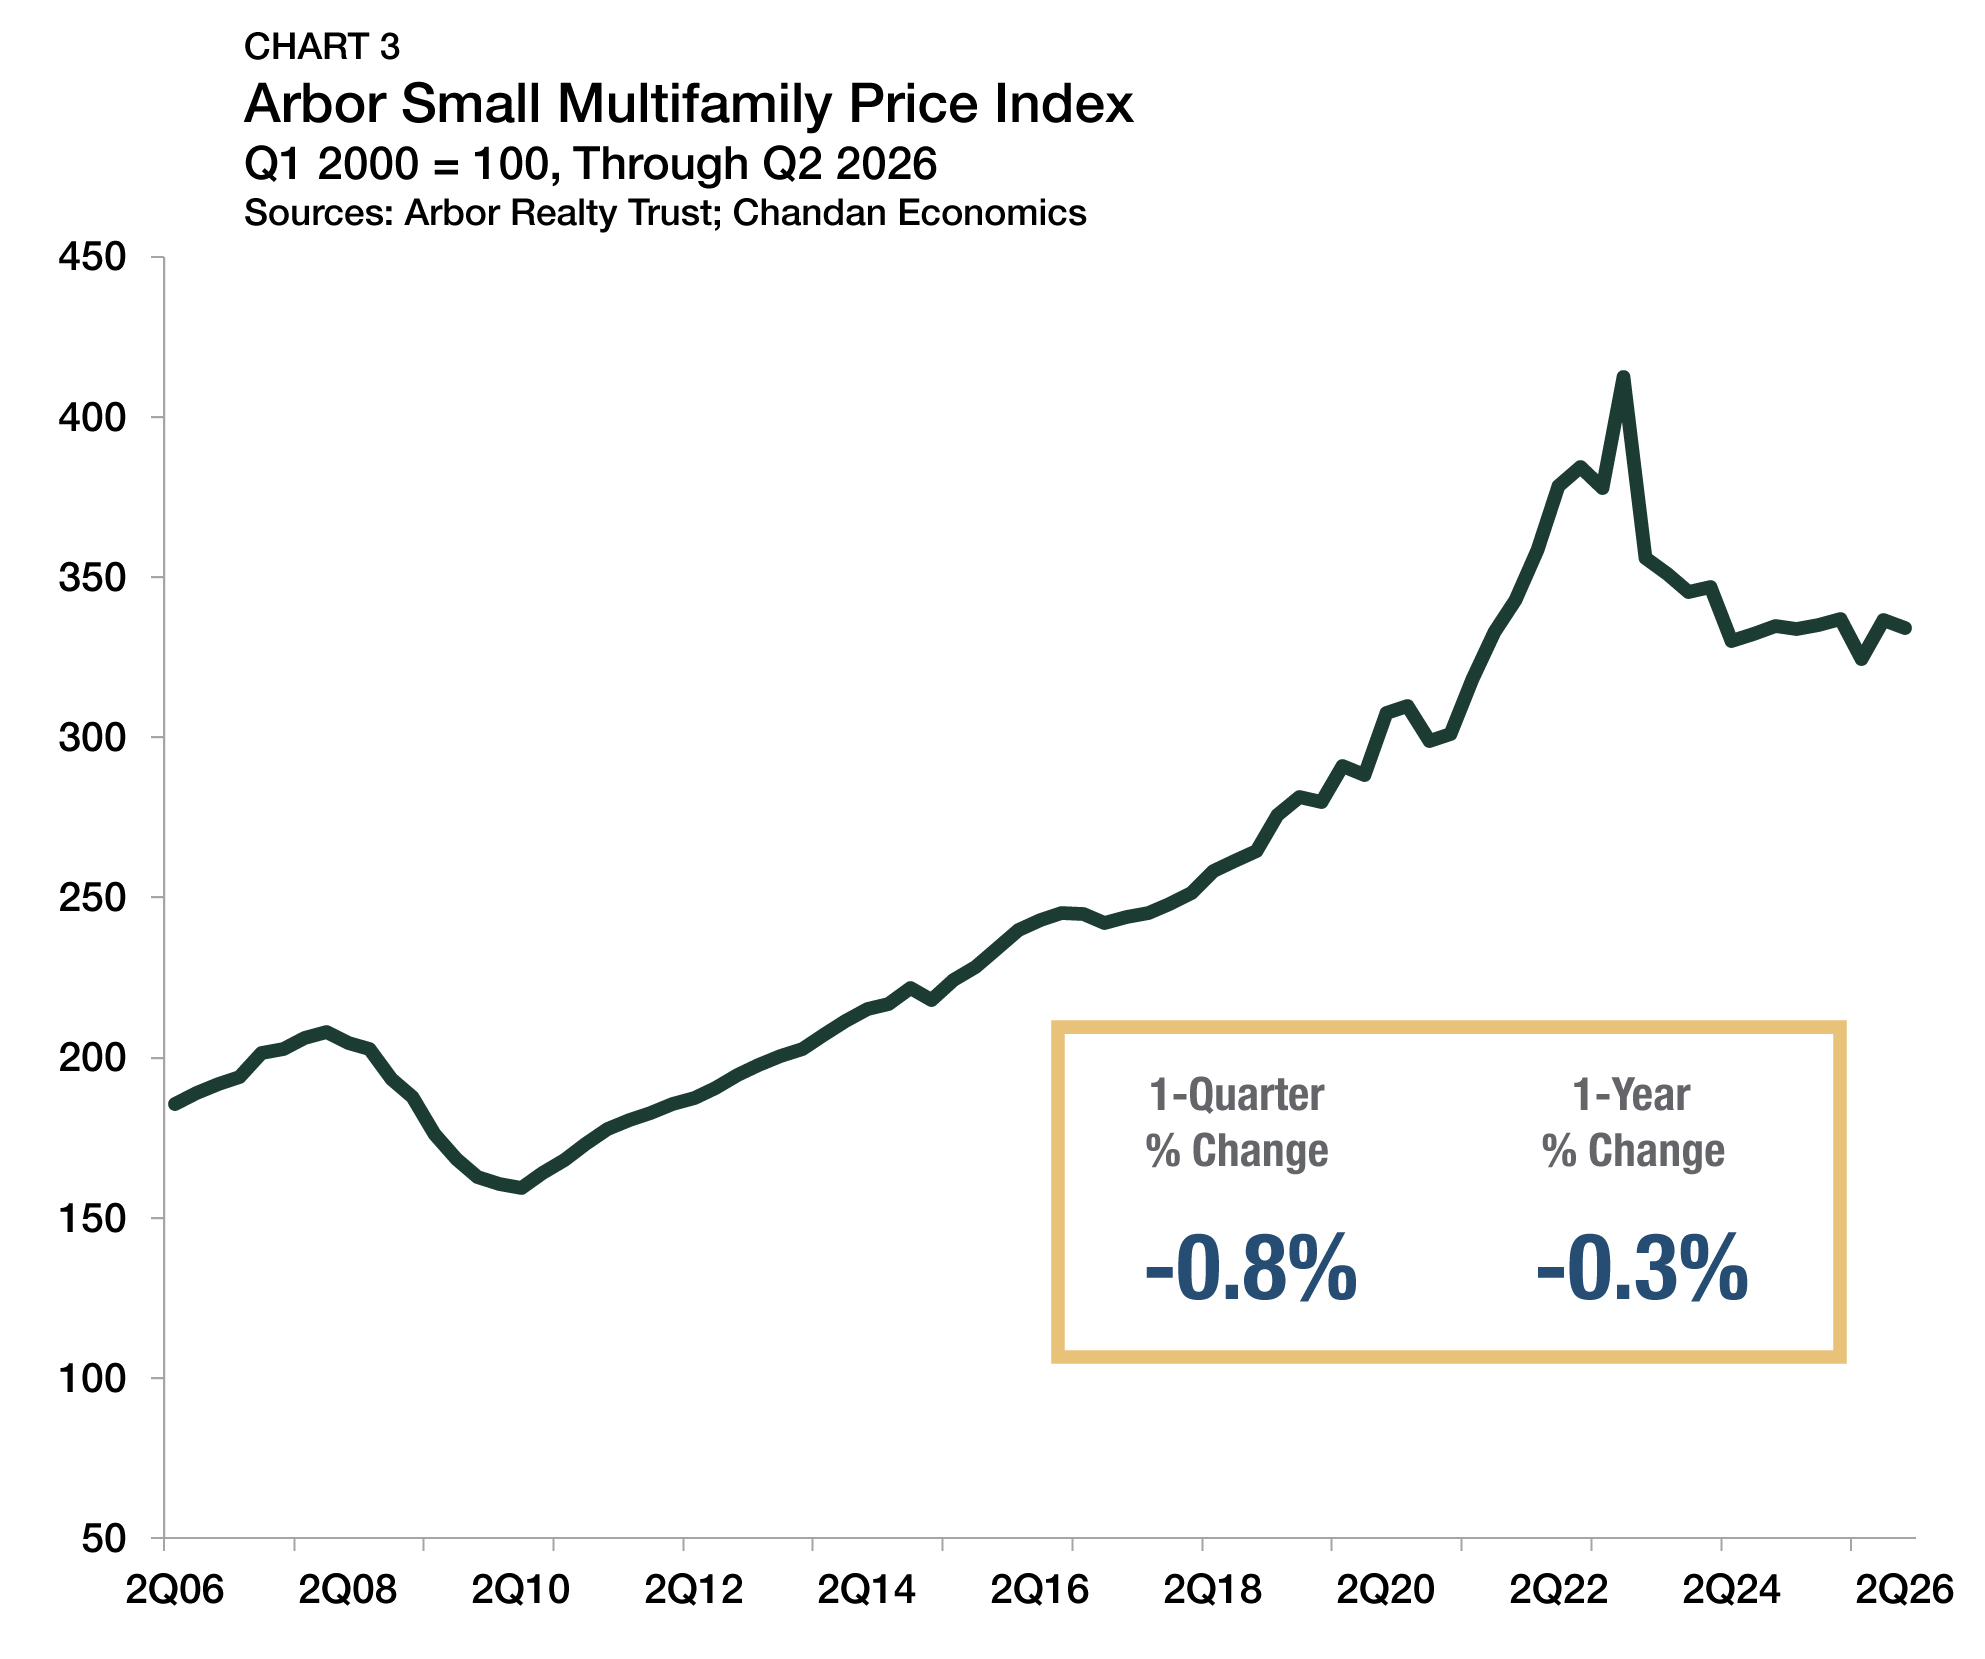
Small multifamily asset valuations saw little change in the second quarter of 2026. According to the Arbor Small Multifamily Price Index (ASMPI), valuations slipped 0.8% quarter-over-quarter and 0.3% year-over-year (Chart 3). Although there was a modest decline in the second quarter, relative stability, not renewed repricing, has been the broader pattern since early 2024.
The ASMPI relies on a direct capitalization approach to valuation, comparing prevailing net operating income (NOI) to cap rates. In the second quarter, the income side of the equation was modestly supportive. Occupancy was essentially unchanged, rents moved slightly higher, and expense ratios eased modestly, producing a small increase in NOI.
However, the improvement in NOI was offset by a rise in cap rates, which put slight downward pressure on implied values. With cap rate spreads over benchmark interest rates still historically narrow, the room for valuations to move meaningfully higher or lower may remain limited. Recent ASMPI readings continued to suggest that small multifamily valuations remain largely range-bound, with no clear directional shift in pricing through the second quarter.
Cap Rates & Spreads
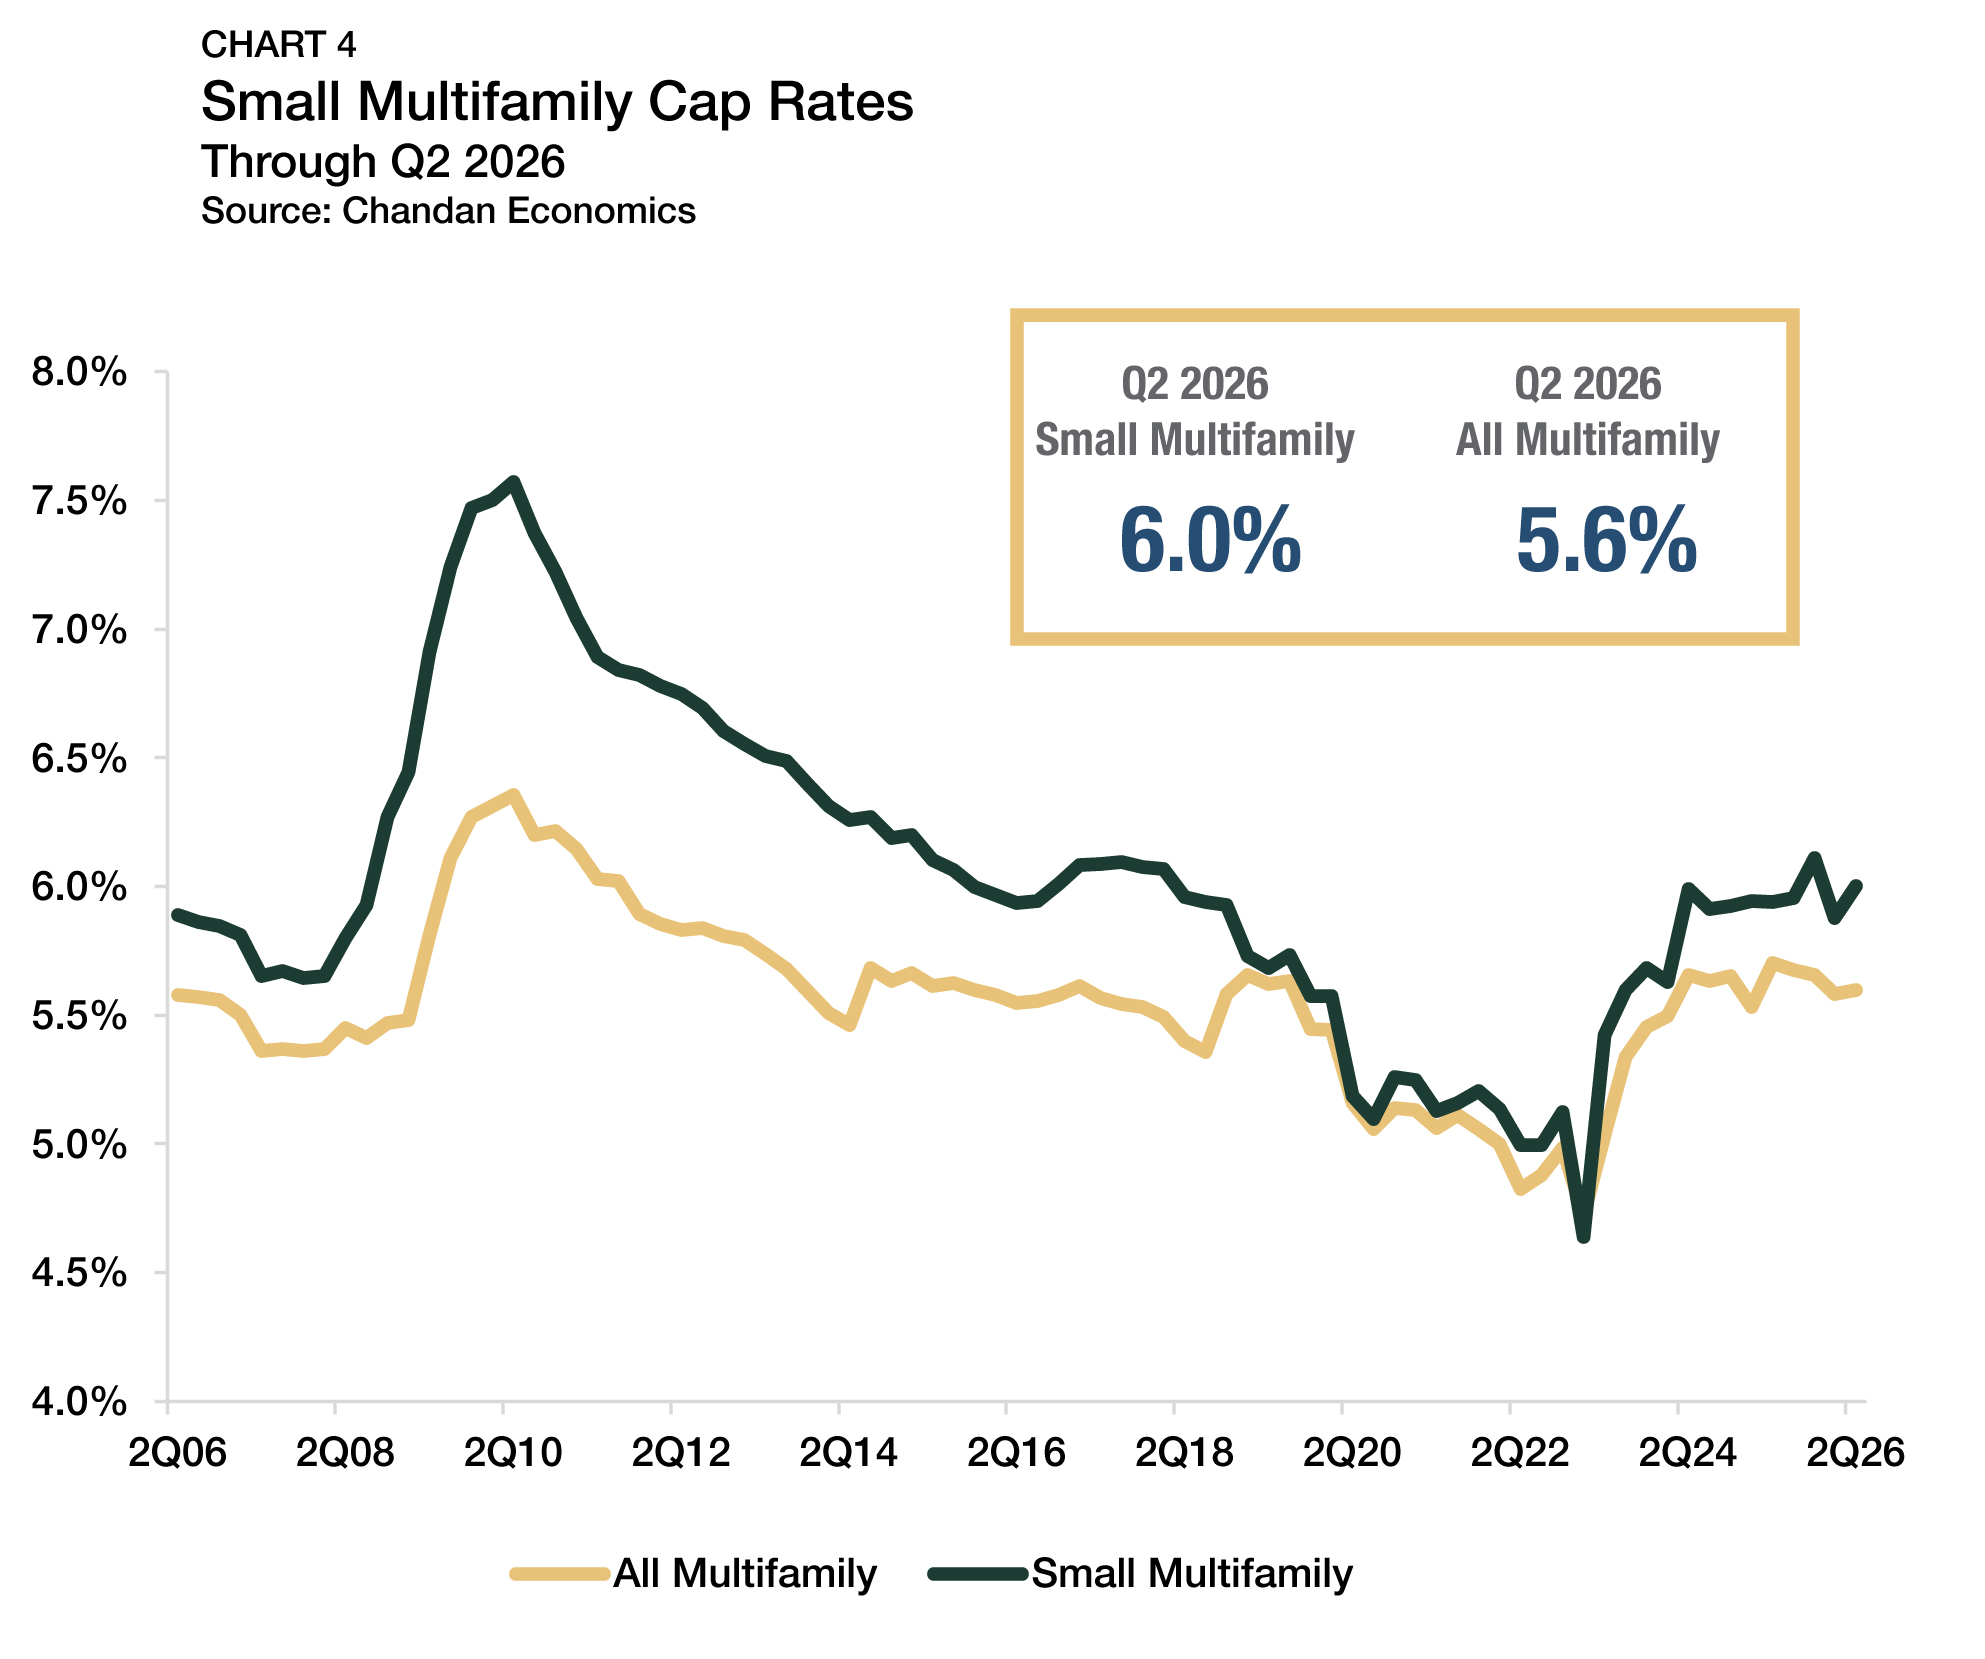
Small multifamily cap rates averaged 6.0% in the second quarter, up from 5.8% in the previous quarter (Chart 4). While the increase partly reversed the prior quarter’s decline, cap rates remained within the relatively narrow range that has prevailed since early 2024. When viewed through a historical lens, recent trends do not point to a clear change in pricing conditions, but rather the extension of a period of stability that has defined small multifamily during the last six quarters.
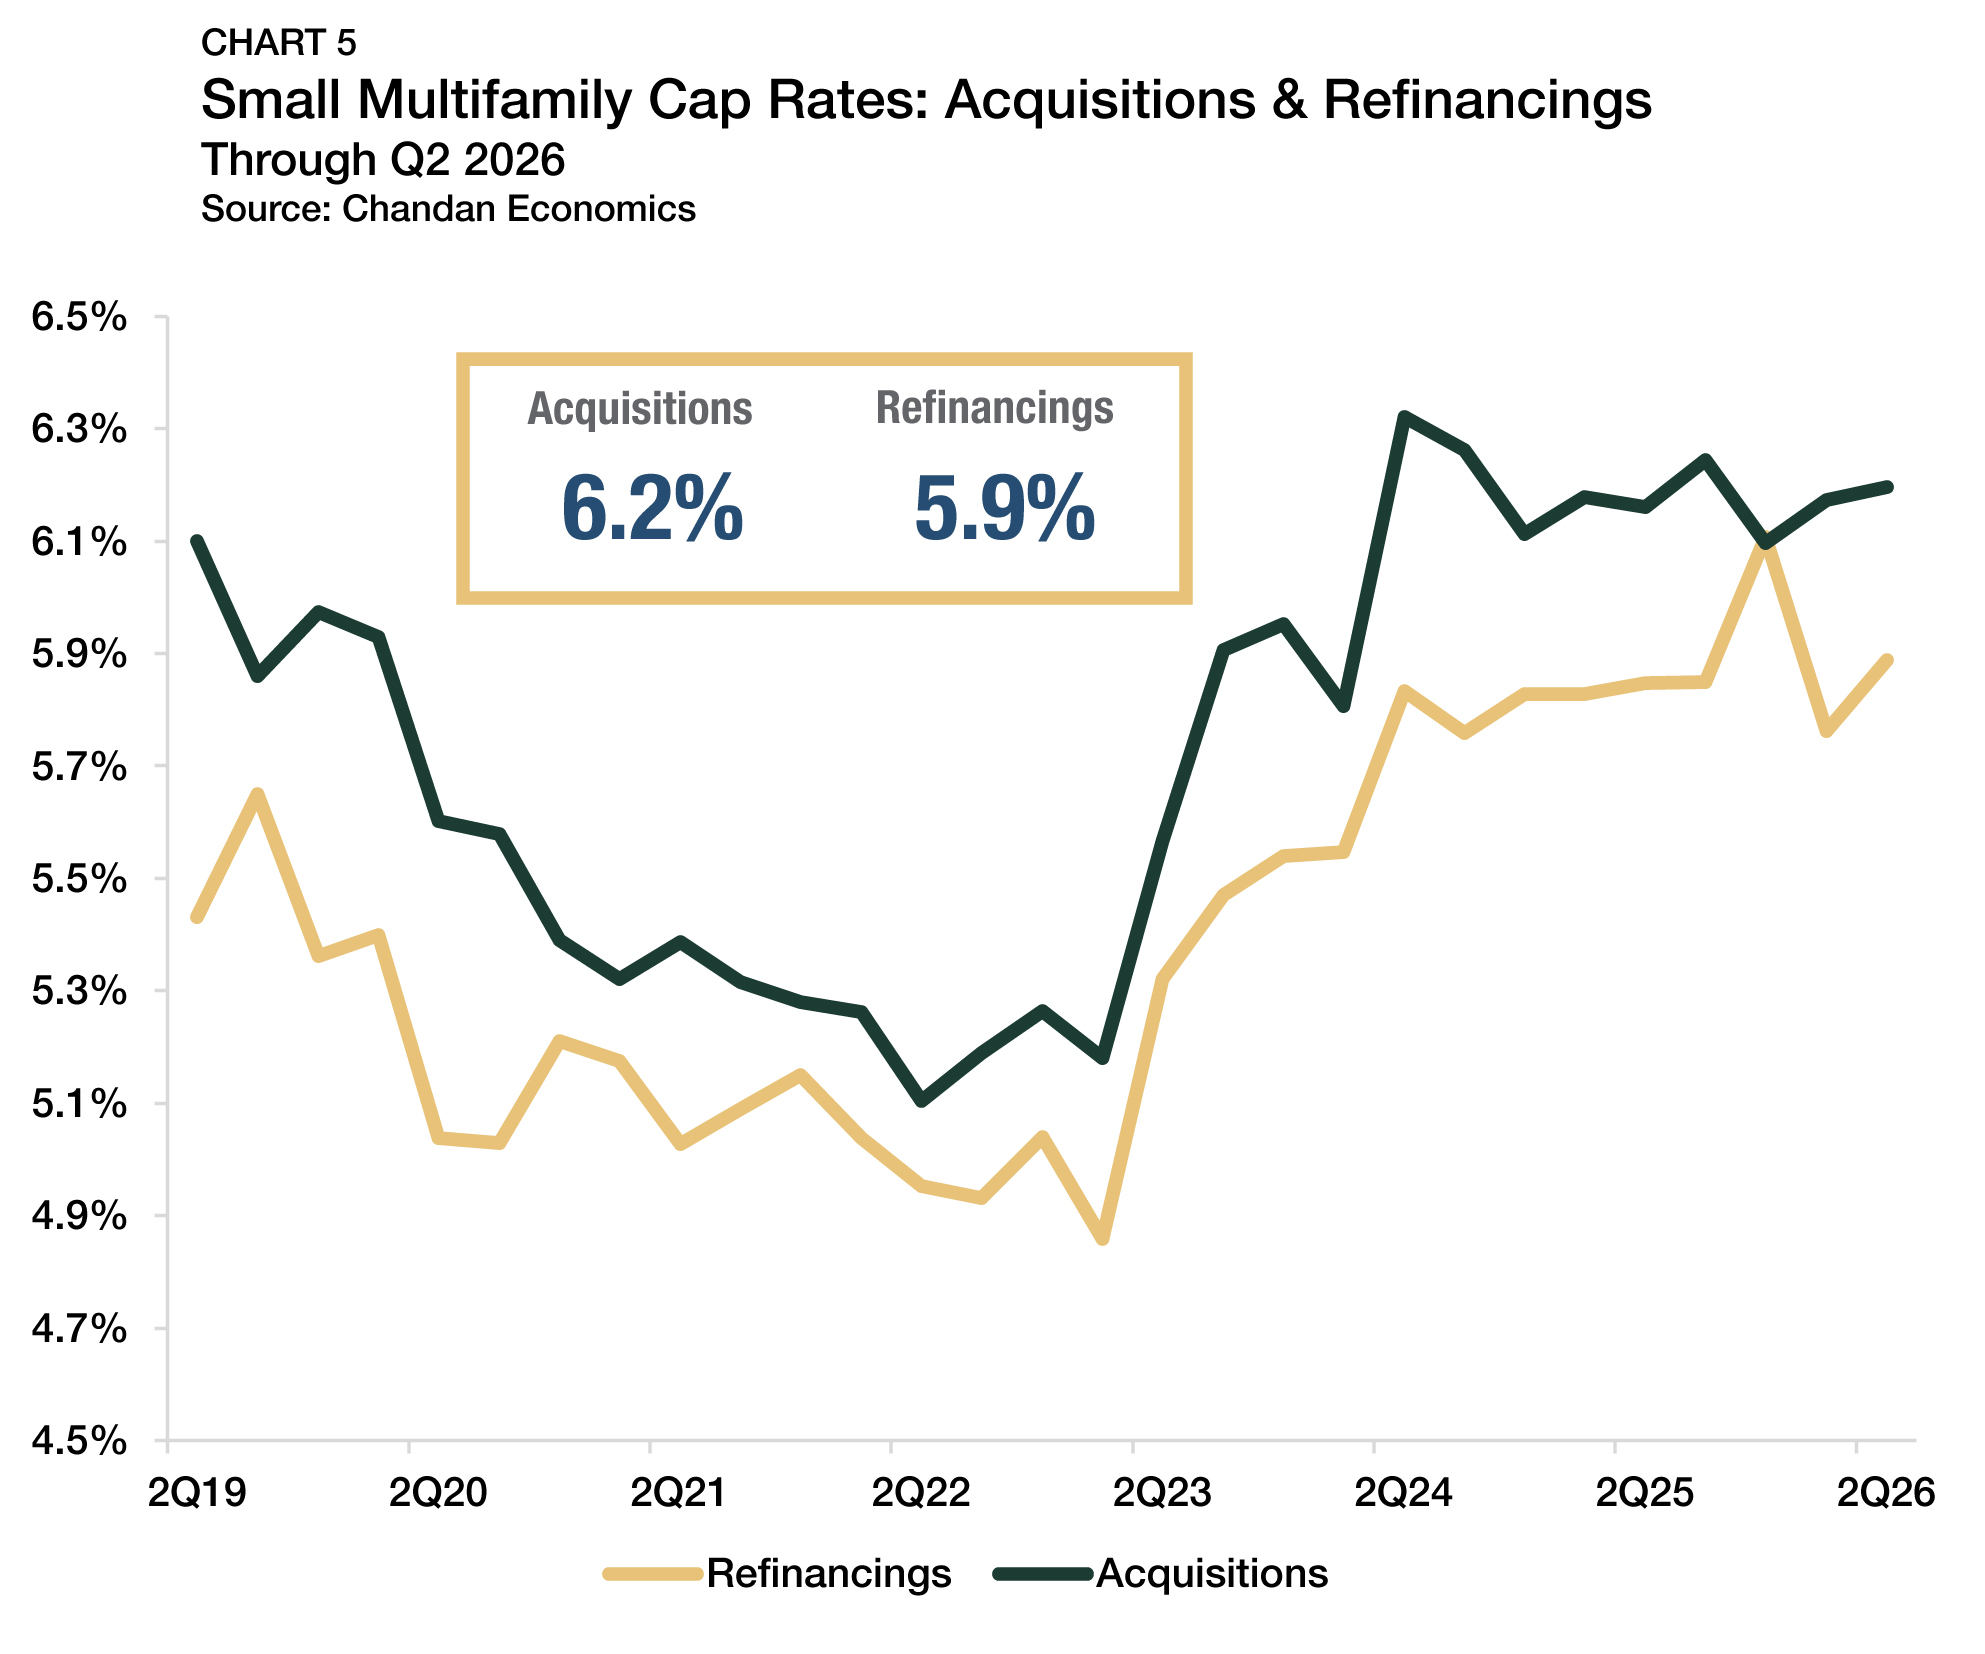
Acquisition and refinance cap rates both moved modestly higher in the second quarter, rising to 6.2% and 5.9%, respectively (Chart 5). Unlike in late 2025, when refinancing activity appeared to have influenced observed cap rates through loan composition, the latest quarterly performance data showed a more uniform increase across loan types. Taken together, these findings suggest that the second-quarter increase in cap rates reflected a modest repricing across the market rather than another meaningful composition-driven distortion.
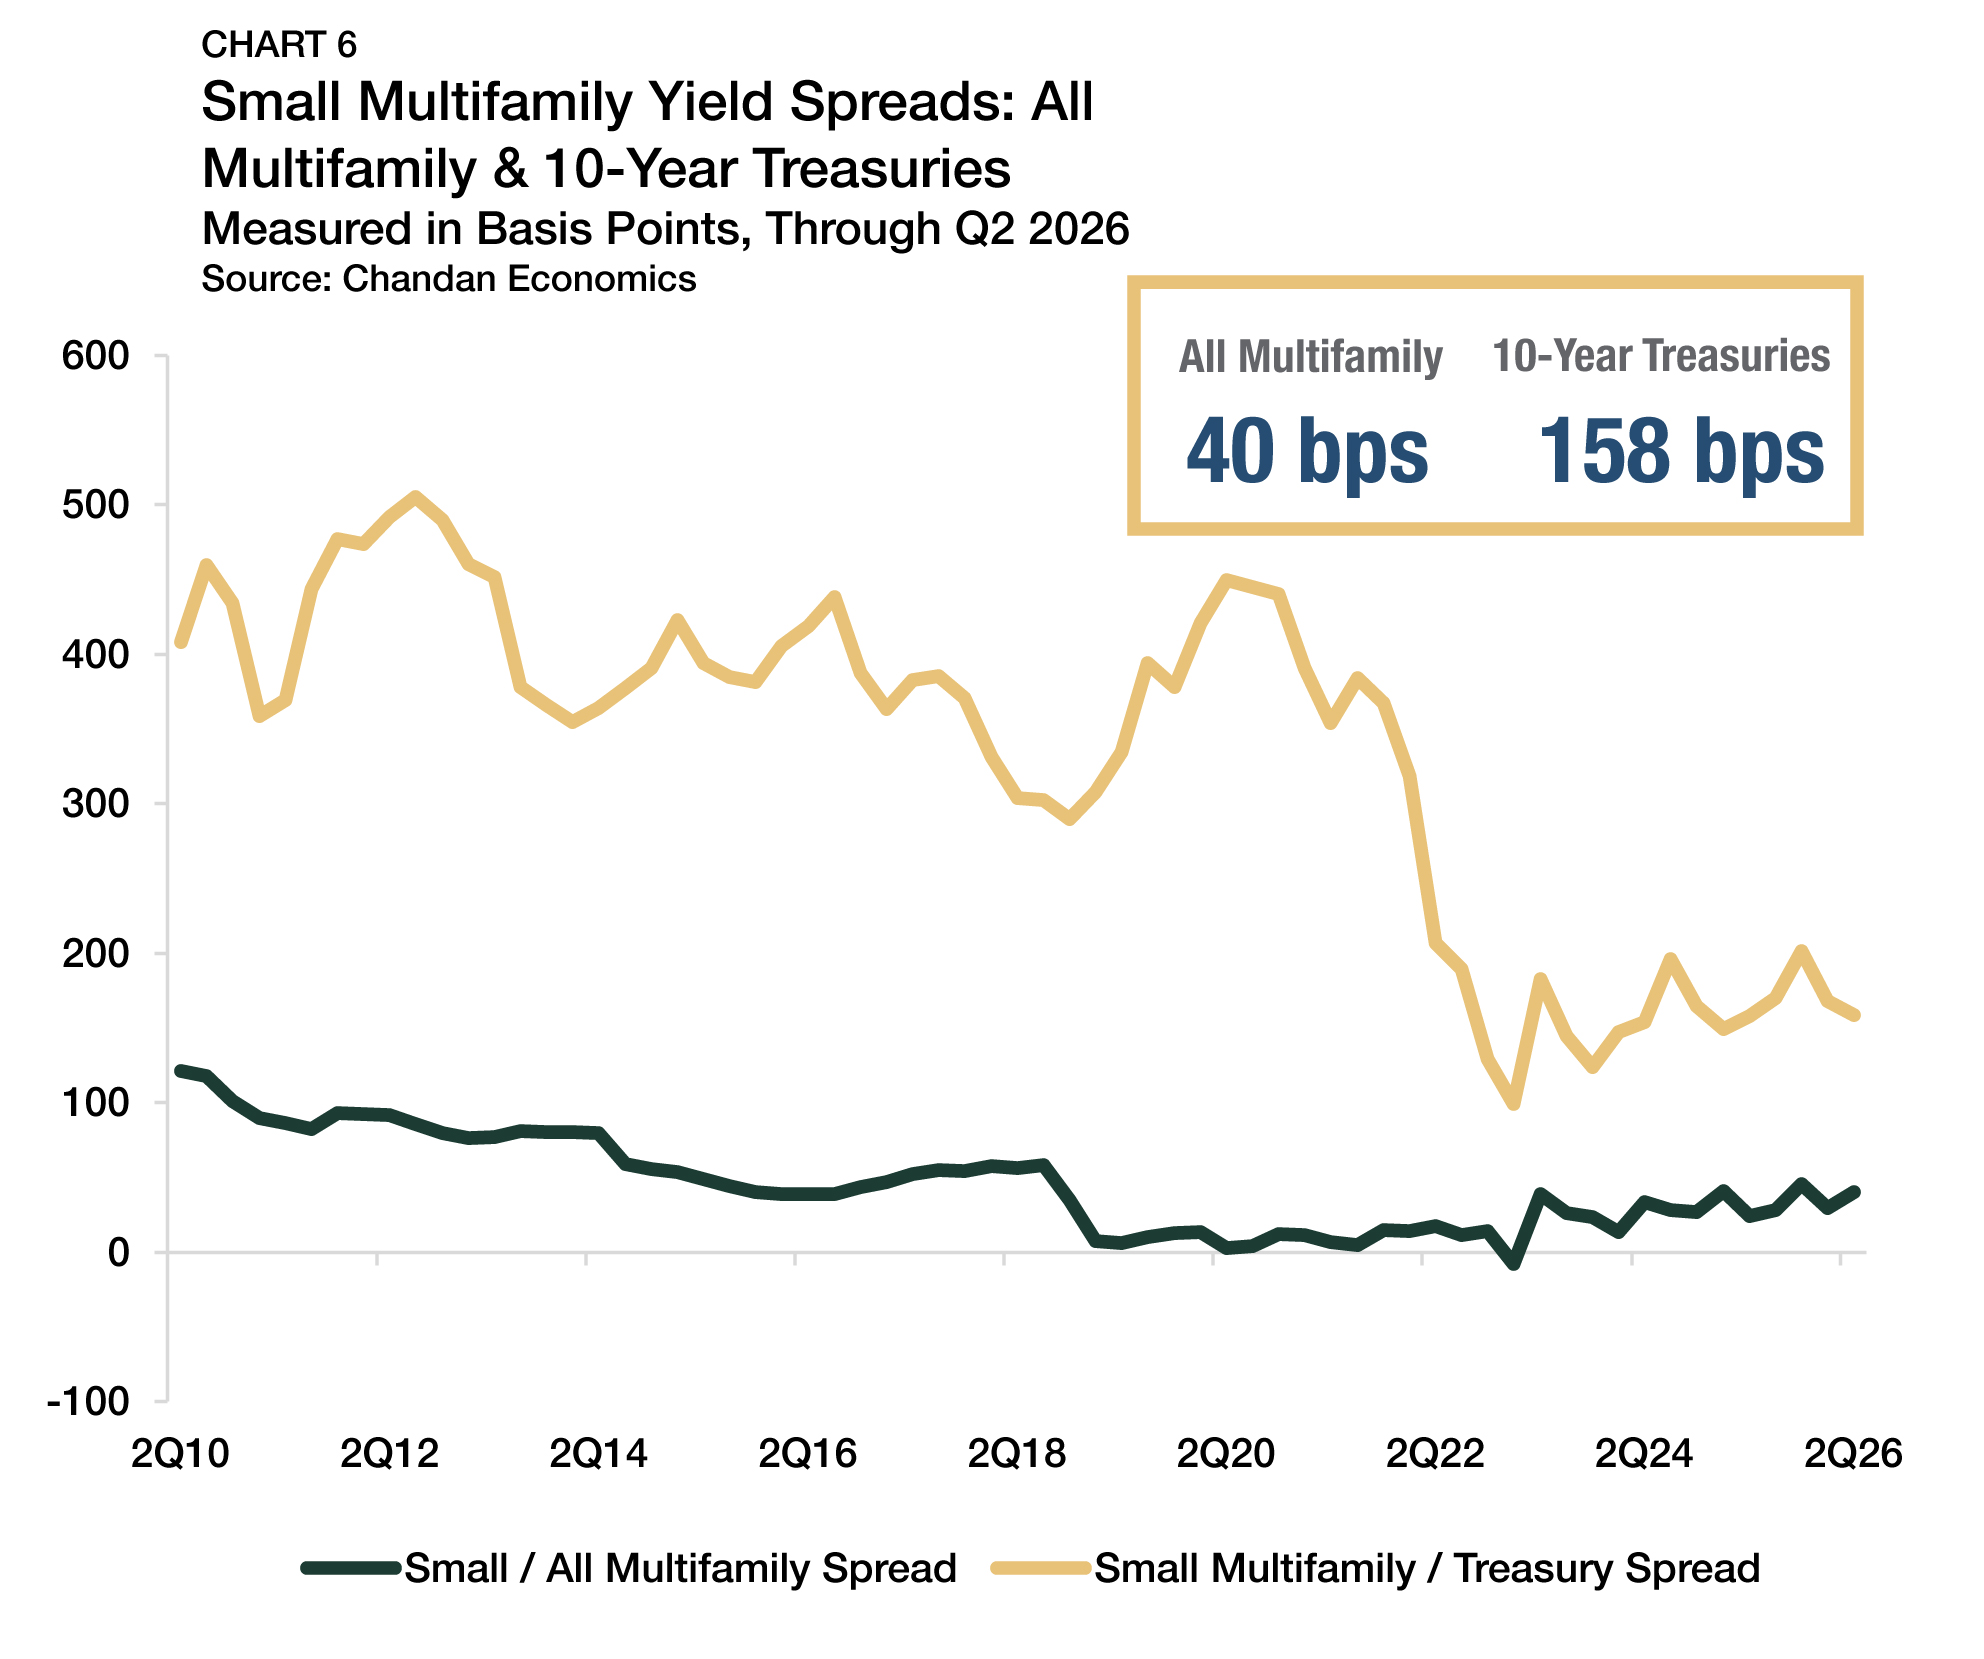
The small multifamily risk premium, measured by comparing cap rates to the yield on the 10-year Treasury, held roughly unchanged at 158 basis points (bps) in the second quarter of 2026 (Chart 6). While higher cap rates would normally widen that spread, the increase was offset by a rise in Treasury yields during the quarter. At the same time, the cap rate spread between small multifamily assets and the broader multifamily sector widened to 40 bps, up from 29 bps in the first quarter and above the post-2020 average of 20 bps. Even so, that spread remained well below a wider pre-2020 norm, suggesting that the pricing premium attached to small multifamily assets remained moderate by longer-run standards.
Expense Ratios
Small multifamily expense ratios eased in the second quarter of 2026, falling to 42.1% from 44.7% in the prior quarter (Chart 7). The decline was seen in both acquisitions and refinancings, with acquisition expense ratios retreating to 45.2% and refinance expense ratios declining to 40.5%.
Even with these movements, small multifamily’s second-quarter expense ratio was 95 bps higher than a year earlier, suggesting that operating-cost pressure moderated but did not disappear. The second-quarter decline reflected a partial easing from an unusually high prior-quarter reading, rather than a broader reversal in expense pressures.
Occupancy Rates
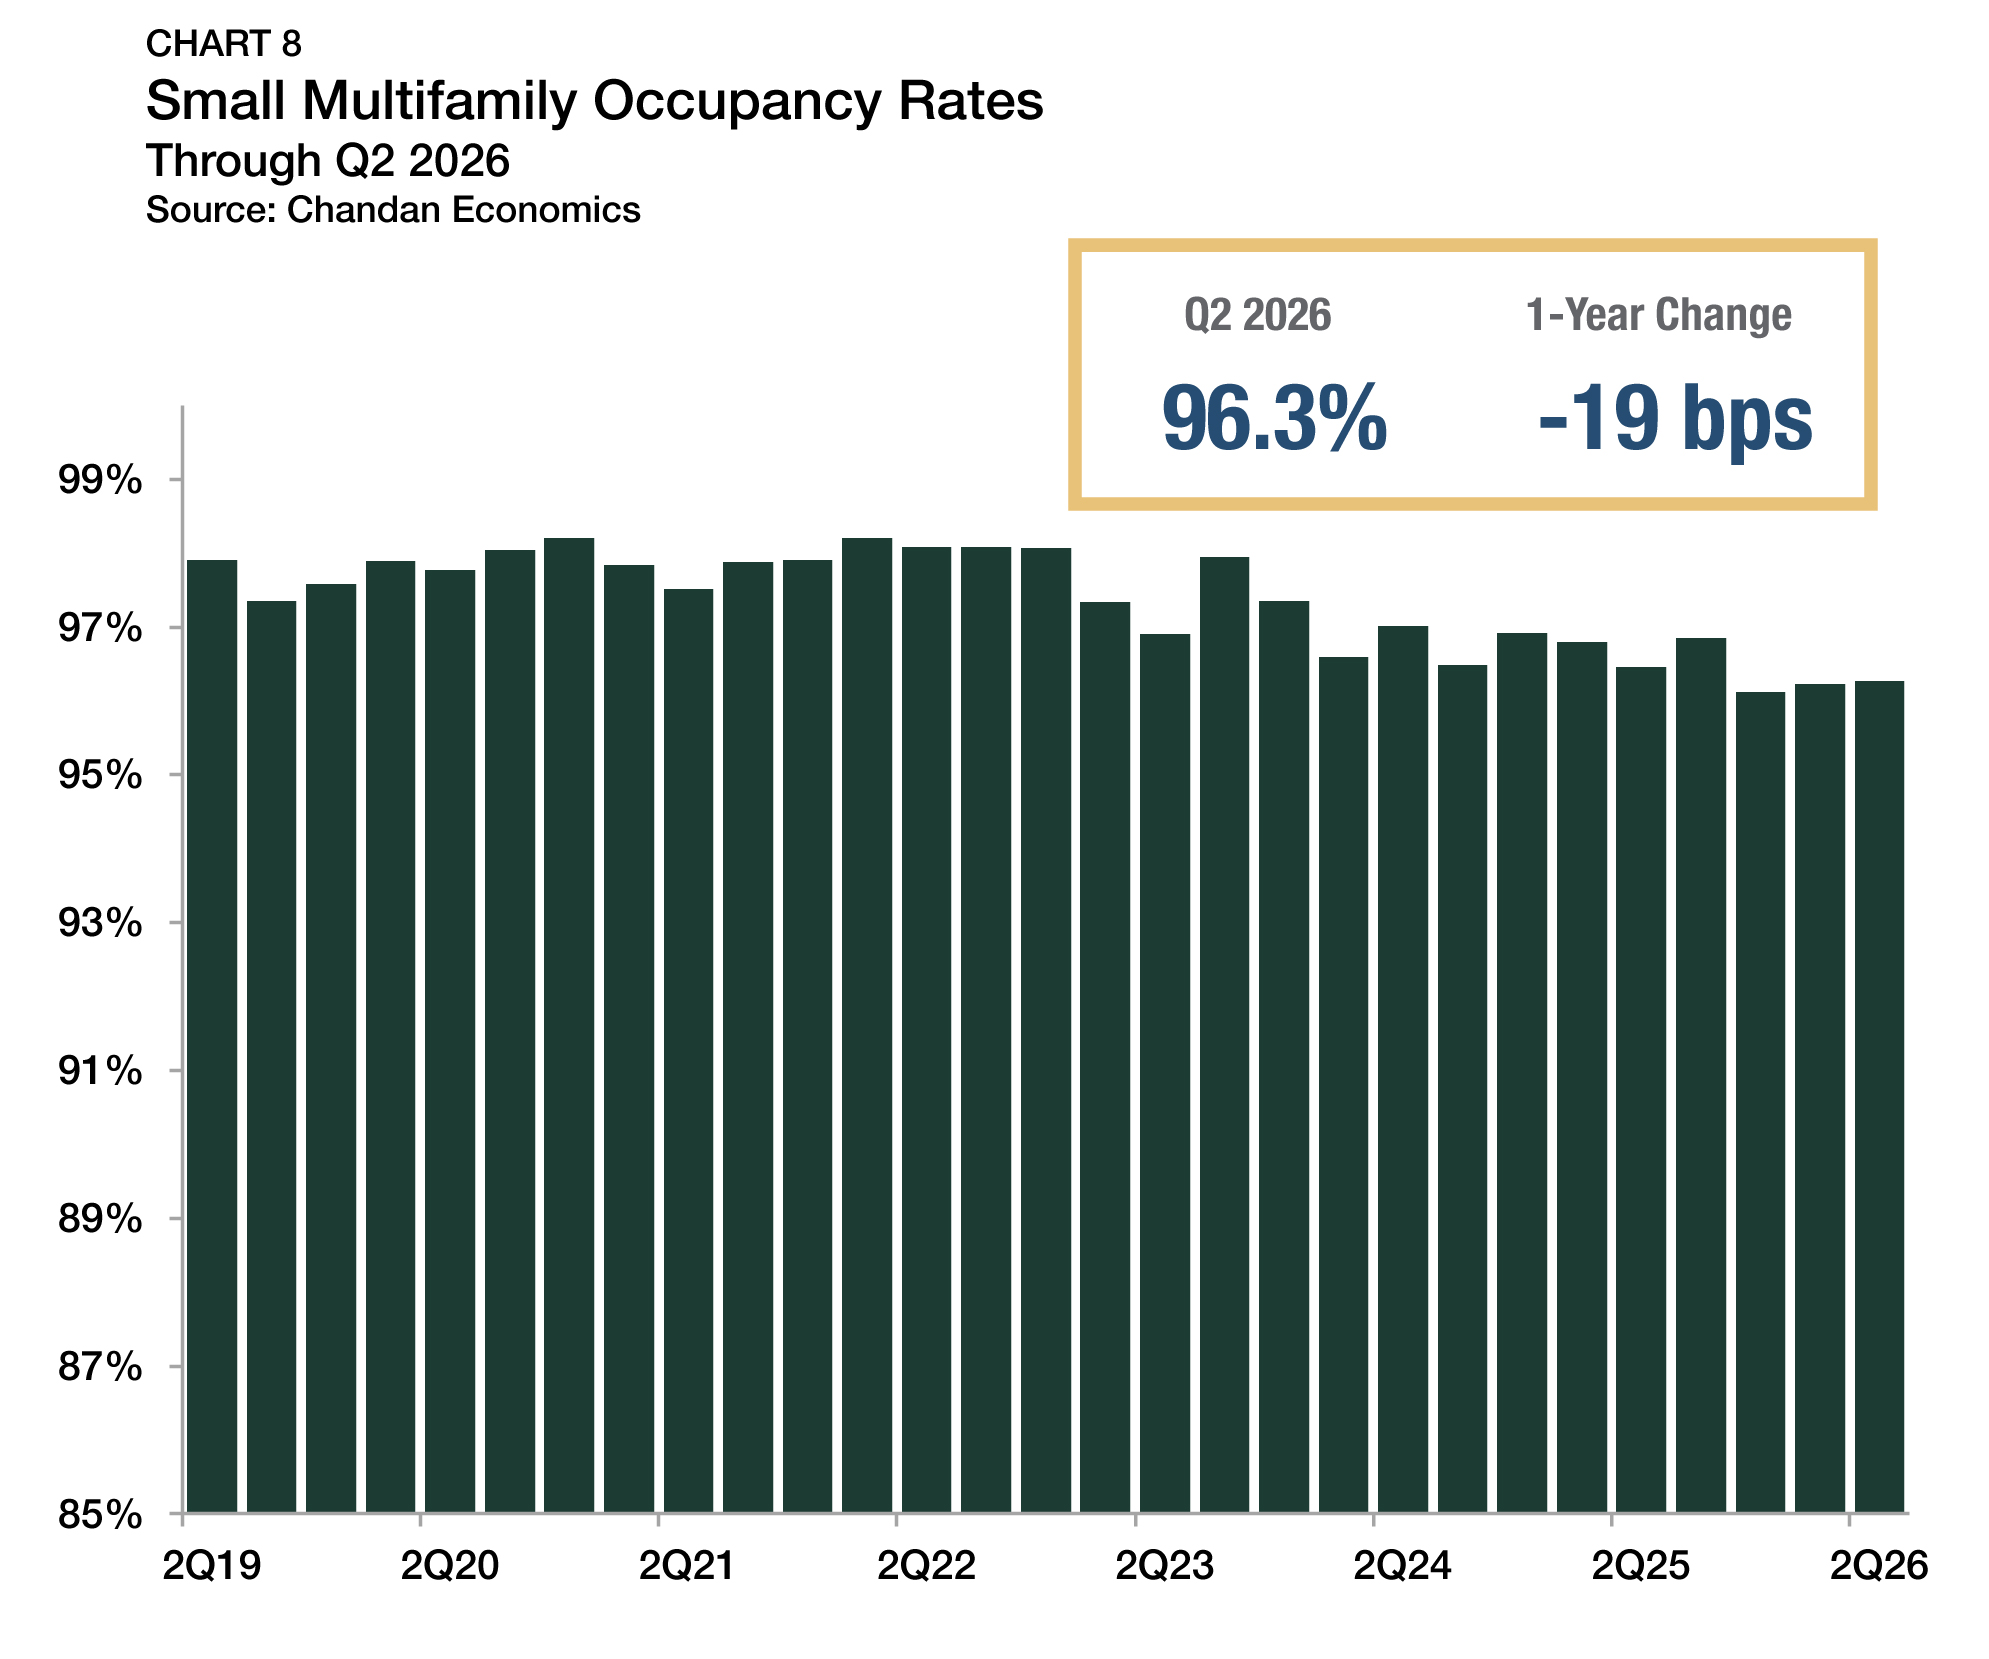
Occupancy rates in small multifamily properties that received financing were effectively unchanged in the second quarter of 2026 at 96.3% (Chart 8). While occupancy edged slightly higher from the prior quarter, it remained modestly below last year’s levels, indicating that occupancy conditions have stabilized after having softened late last year.
These data points are directionally consistent with broader rental market trends reported by the U.S. Census Bureau that show a national rental vacancy rate of 7.3% in the first quarter of 2026, up from 7.1% one year earlier and 7.2% in the fourth quarter of 2025, which implies a national rental occupancy rate of 92.7%.
While the national occupancy rate remained strong, small multifamily properties continued to outpace the rental market average moderately in the second quarter of 2026.
Leverage & Debt Yields
Small multifamily underwriting conditions continued to be mixed. Loan-to-value ratios (LTVs) edged down to 63.4% (Chart 9), while remaining broadly in line with the range that has prevailed over the past year. This trend suggests leverage terms changed little during the quarter, even as they were slightly tighter than in the prior three-month period.
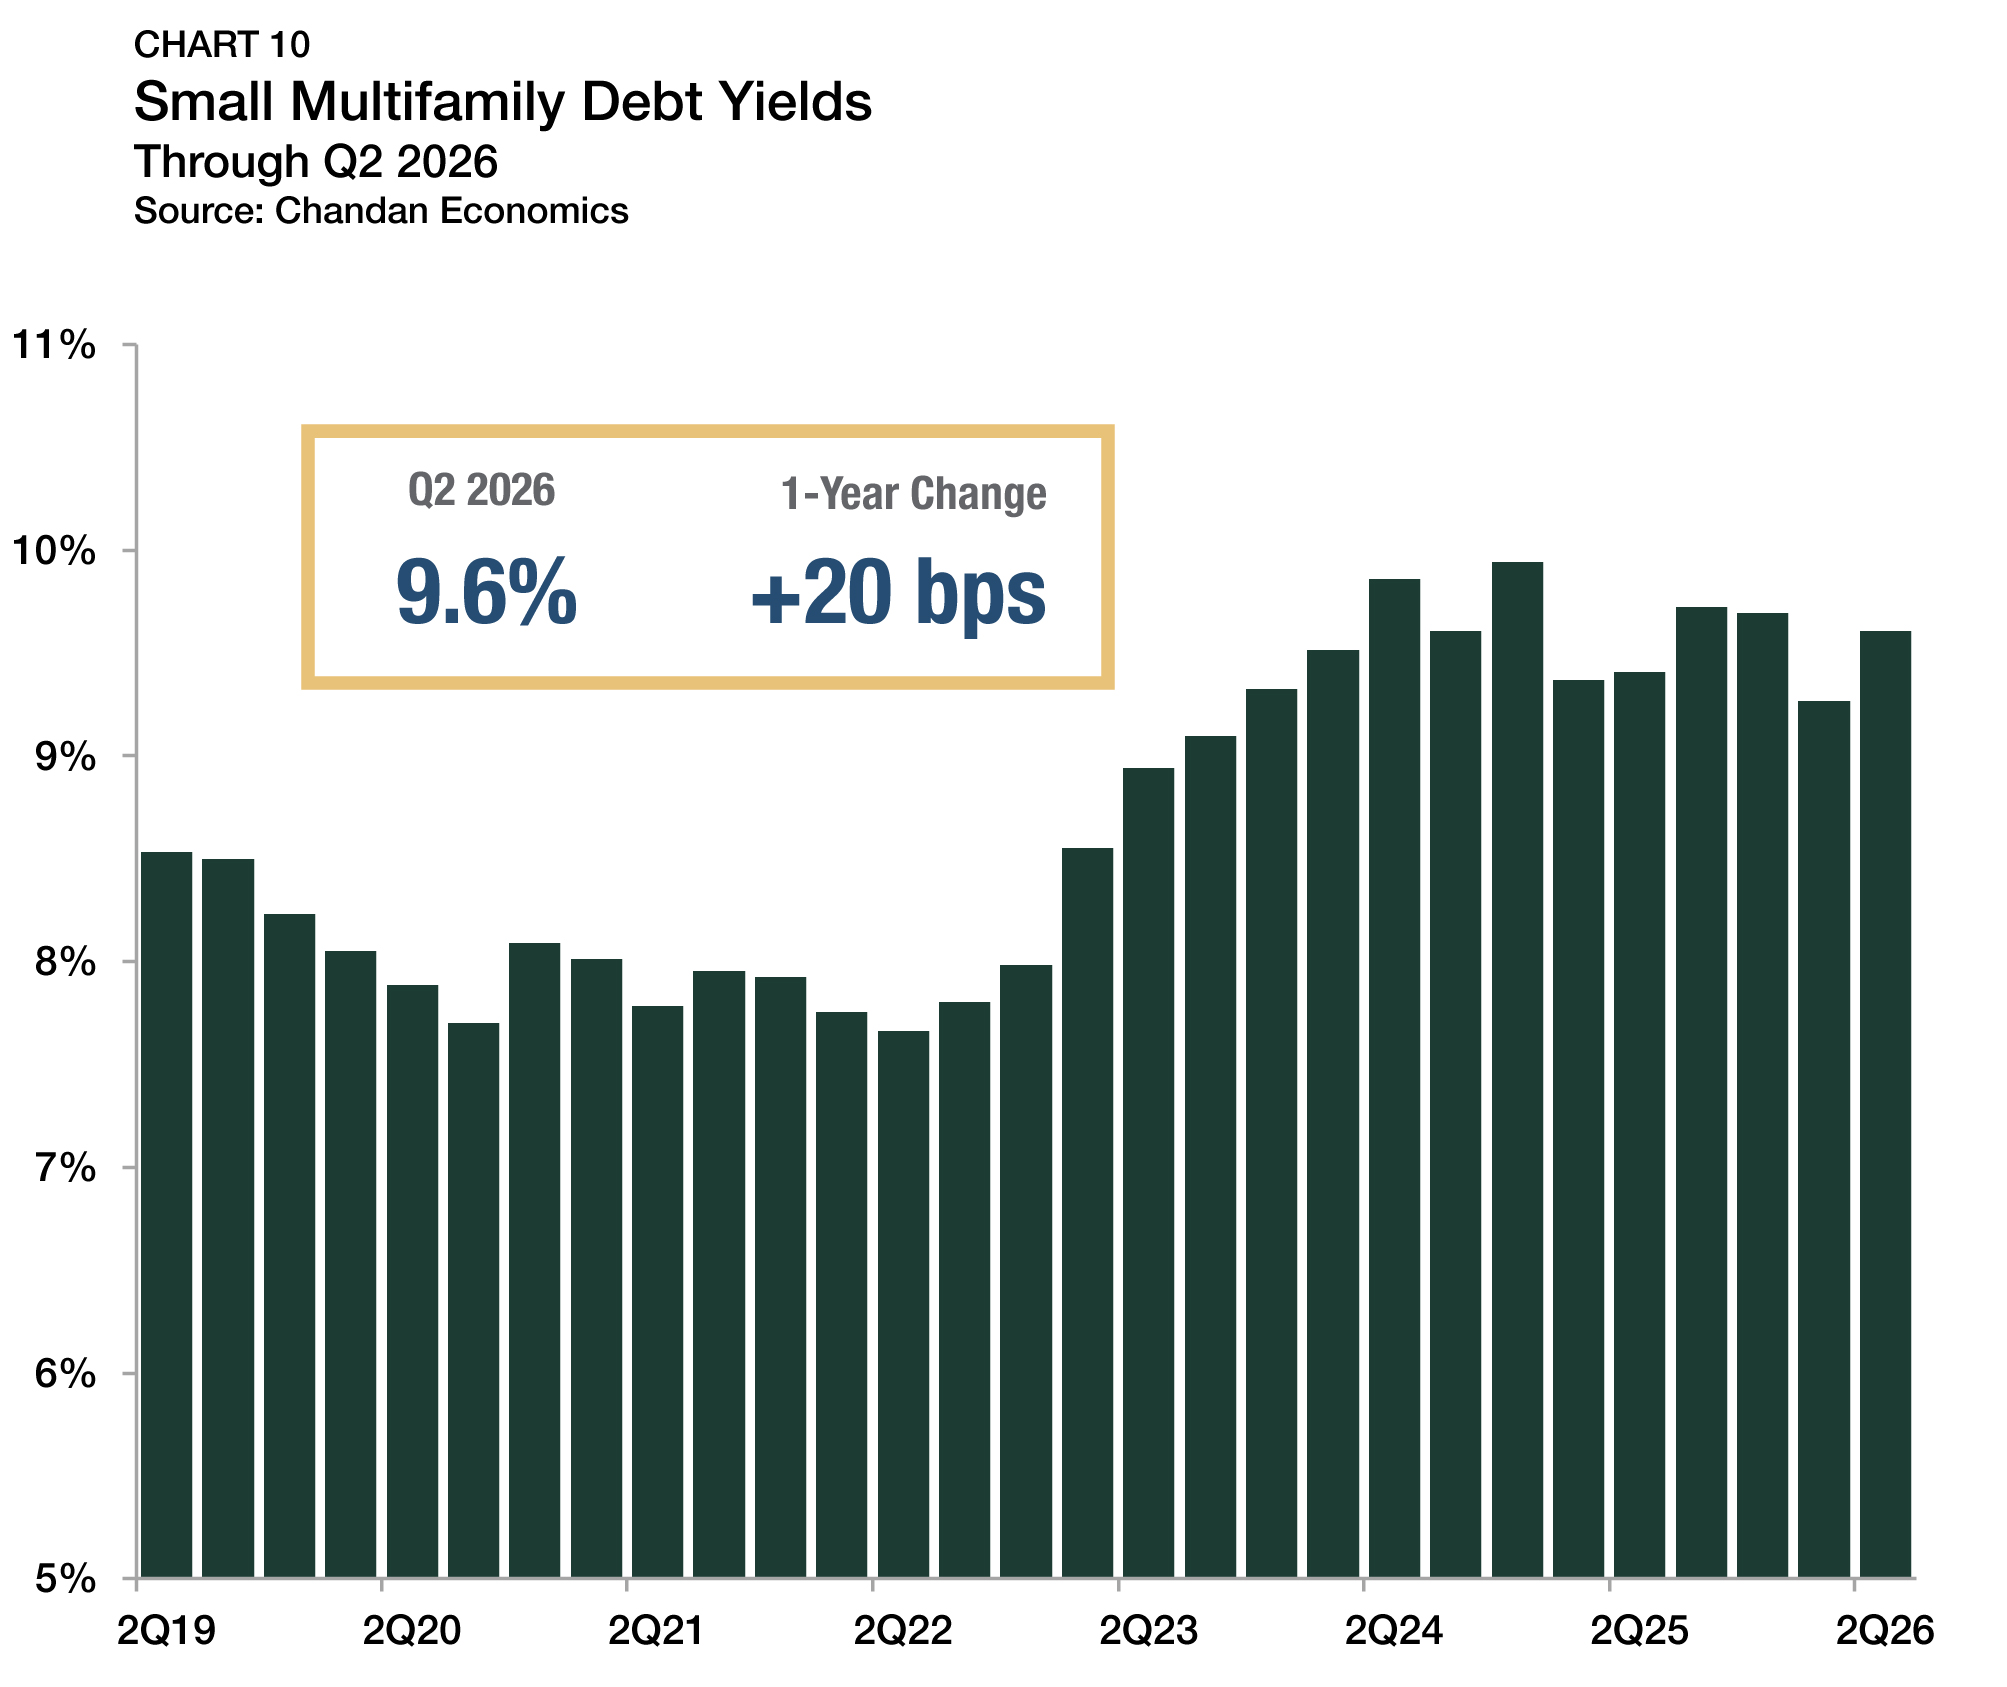
Debt yields, which consider the relationship between net operating income (NOI) and loan balance, rose to 9.6% in the second quarter (Chart 10). Together with the modest decline in LTVs, the latest reading points to moderately tighter lender risk parameters relative to the prior quarter. At the same time, debt per dollar of NOI fell to $10.41 from $10.79, indicating a decrease in leverage relative to income.
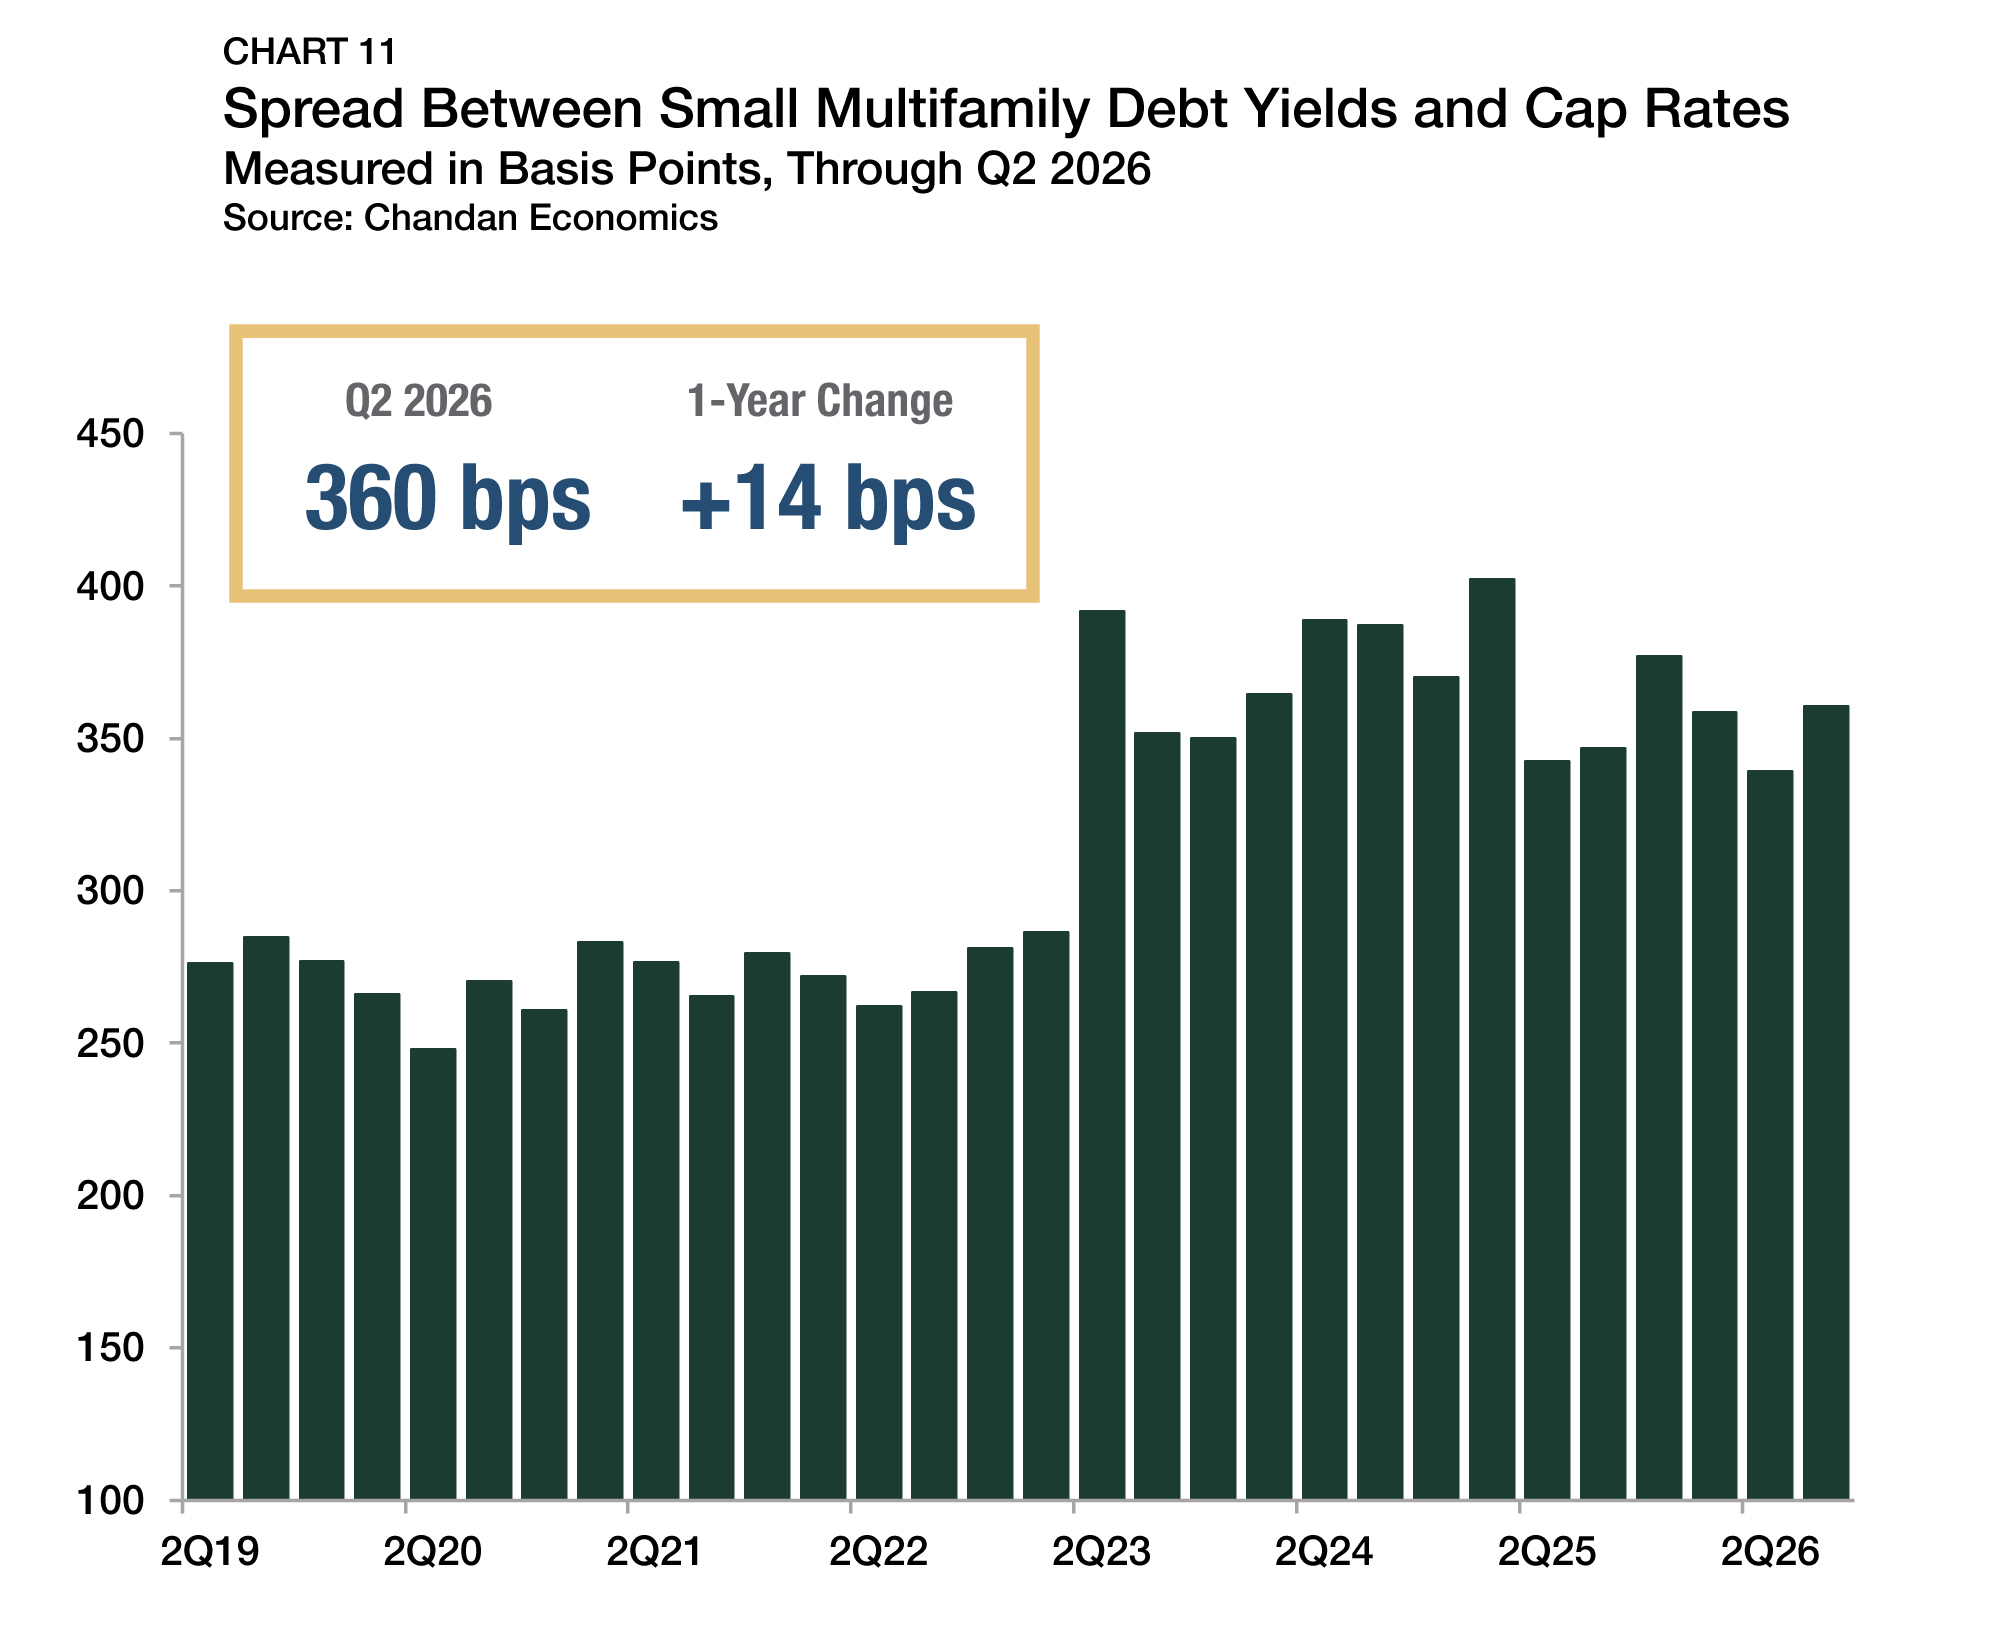
With cap rates rising to 6.0% and debt yields increasing more sharply, the spread between the two measures widened to 360 bps (Chart 11). This movement in the two indicators partially reversed the compression seen in the first quarter and suggests that lenders required somewhat larger risk cushions as market conditions turned modestly less accommodative.
Outlook
Looking ahead, the small multifamily sector appears positioned for continued stability, even as near-term conditions remain shaped by selective capital availability and elevated borrowing costs. Second-quarter data pointed to steady origination activity, broadly unchanged pricing, and occupancy conditions that have largely stabilized. Refinancing is likely to remain a primary driver of lending activity as borrowers continue to address upcoming maturities, even if interest rate volatility affects the timing of some financing decisions.
Current market dynamics suggest that normal, incremental growth is more likely than sharp movements in either direction. Small multifamily remains supported by durable operating fundamentals and sufficient market liquidity, but historically narrow cap rate spreads and a higher cost of capital continue to keep pricing outcomes in a relatively tight range. As a result, the sector’s near-term trajectory will depend less on a reacceleration in demand than on continued stability in financing conditions and the ability of property-level cash flows to hold up as the market continues to normalize.
For more small multifamily research and insights, visit arbor.com/research
Disclaimer
This report is intended for general guidance and information purposes only. This report is under no circumstances intended to be used or considered as financial or investment advice, a recommendation or an offer to sell, or a solicitation of any offer to buy any securities or other form of financial asset. Please note that this is not an offer document. The report is not to be considered as investment research or an objective or independent explanation of the matters contained herein and is not prepared in accordance with the regulation regarding investment analysis. The material in the report is obtained from various sources per dating of the report. We have taken reasonable care to ensure that, and to the best of our knowledge, material information contained herein is in accordance with the facts and contains no omission likely to affect its understanding. That said, all content is provided herein “as is” and neither Arbor Realty Trust, Inc. or Chandan Economics, LLC (“the Companies”) nor their affiliated or related entities, nor any person involved in the creation, production and distribution of the content make any warranties, express or implied. The Companies do not make any representations or warranties, express or implied, as to the reliability, usefulness, completeness, accuracy, currency nor represent that use of any information provided herein would not infringe on other third-party rights. The Companies shall not be liable for any direct, indirect or consequential damages to the reader or a third party arising from the use of the information contained herein. There may have been changes in matters which affect the content contained herein and/or the Companies subsequent to the date of this report. Neither the issue nor delivery of this report shall under any circumstance create any implication that the information contained herein is correct as of any time subsequent to the date hereof or that the affairs of the Companies have not since changed. The Companies do not intend, and do not assume any obligation to update or correct the information included in this report. The contents of this report are not to be construed as legal, business, investment or tax advice. Each recipient should consult with its legal, business, investment and tax advisors as to legal, business, investment and tax advice. The information contained herein may be subject to changes without prior notice. This report is only intended for the recipients, and should not be copied or otherwise distributed, in whole or in part, to any other person.