Articles
The Federal Housing Administration (FHA), a part of the U.S. Department of Housing and Urban Development (HUD), is one of the largest mortgage insurers in the world. The agency insures mortgages on affordable housing, multifamily properties, single-family homes, and healthcare facilities. Since 1934, FHA has financed over 50,000 multifamily mortgages nationwide. Whether you’re interested in acquiring, refinancing, or rehabilitating an affordable housing property, FHA multifamily loans are a financing route you need to know about.
FHA® 232/223(f): Healthcare Refinance, Acquisition or Mod Rehab
Articles
Despite a national slowdown, population growth remained concentrated in a small group of states in 2025, where strong net domestic migration inflows, economic opportunity, and in some cases elevated birth rates drove the annual increases. Overall, 14 states had an annual population growth rate above 0.75%, while 12 states had less than 0.1%, according to a Chandan Economics analysis of the U.S. Census Bureau’s 2024 American Community Survey.
Articles
Build-to-rent (BTR), a compelling solution to the U.S. housing market’s evolving needs, is experiencing record growth. BTR accounted for 8% of all single-family rental (SFR) construction starts in the 12 months that ended in the first quarter of 2024, according to Arbor’s Single-Family Rental Investment Trends Report Q2 2024. As the need for quality rental units remains high, borrowers have much to gain from partnering with an experienced lender who specializes in build-to-rent financing.
Articles
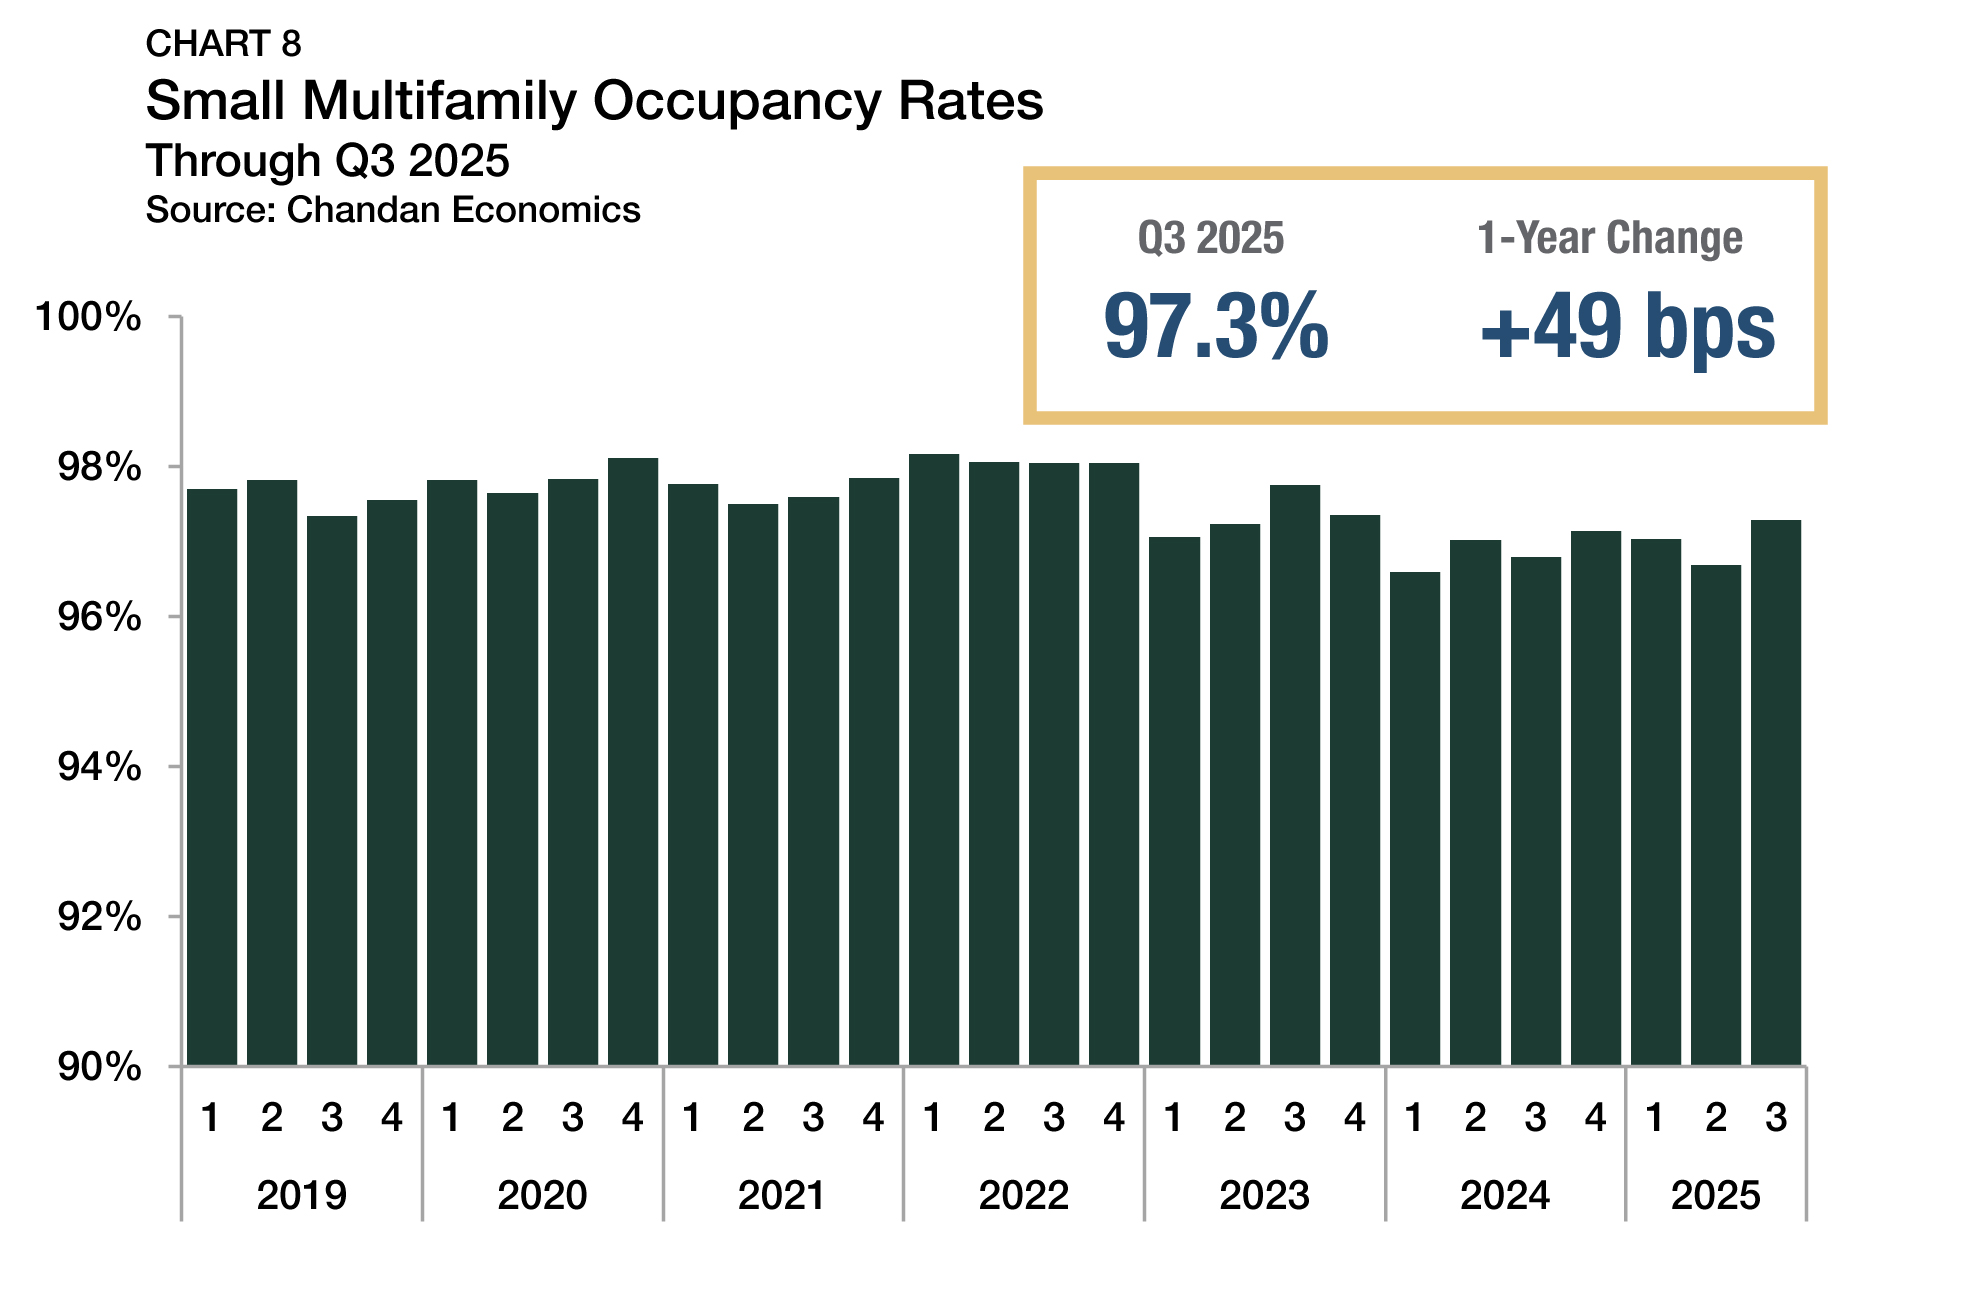
Out of the 75 largest U.S. metropolitan areas, occupancy rates for all types of rental properties, including multifamily and single-family rentals (SFR), remained exceptionally high in 2025.
Articles
National rent growth in the single-family rental (SFR) sector remained strong and consistent in 2025 as market-level pricing momentum was broad-based and robust, according to an analysis of newly released data from the Zillow Observed Rent Index. Year-end annual rent gains averaged 2.9%, down from 4.1% in 2024, marking the most modest increase since 2015. But even as the intensity of SFR rent growth abated last year, its reach was extensive, with 98 of the 100 largest markets posting year-over-year gains.
Current Reports
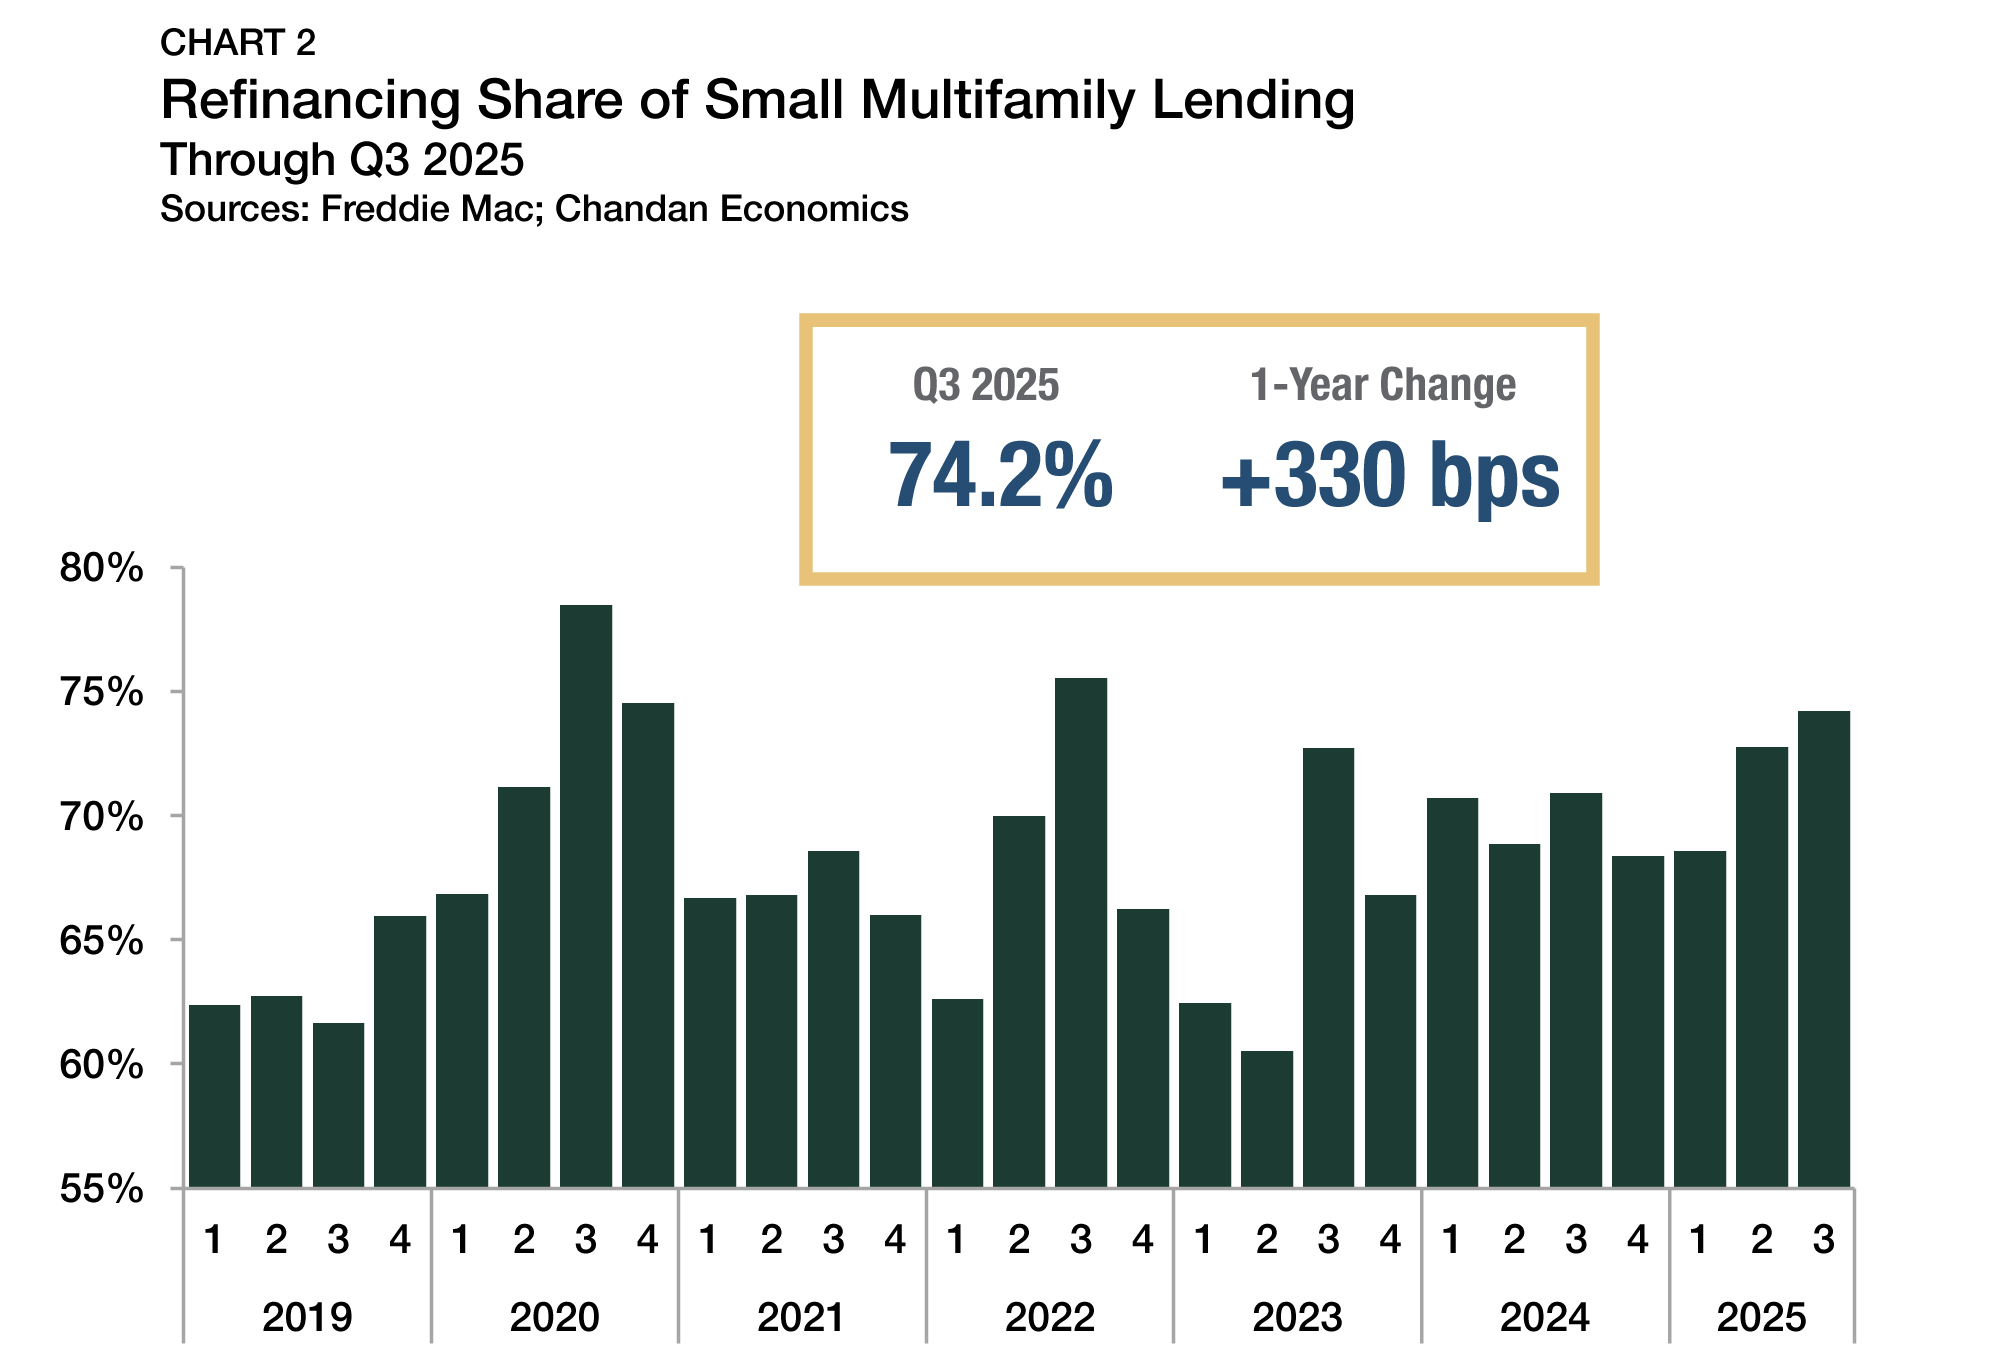
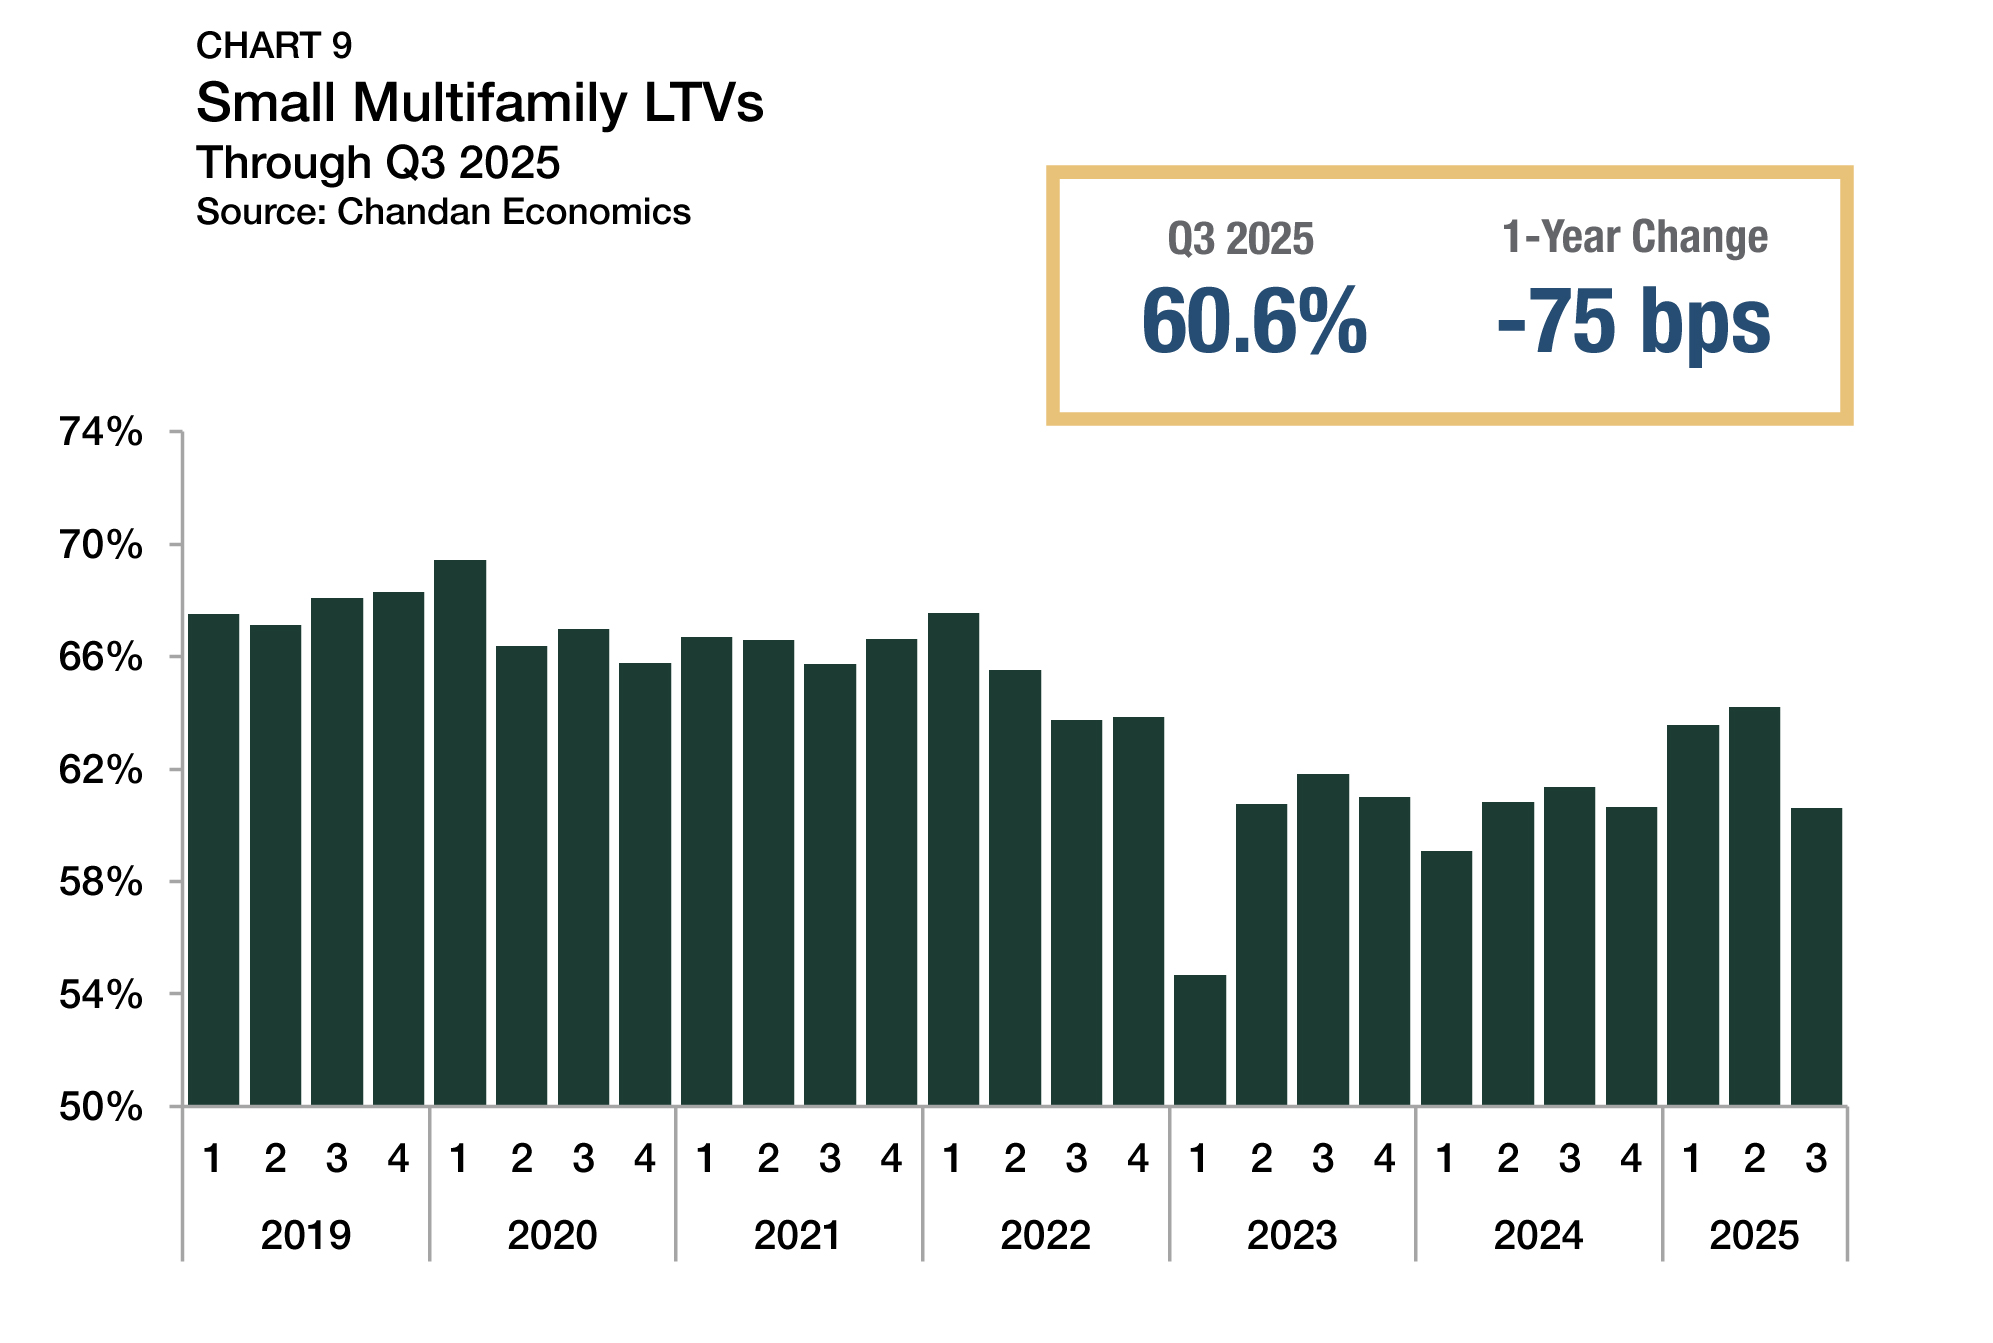
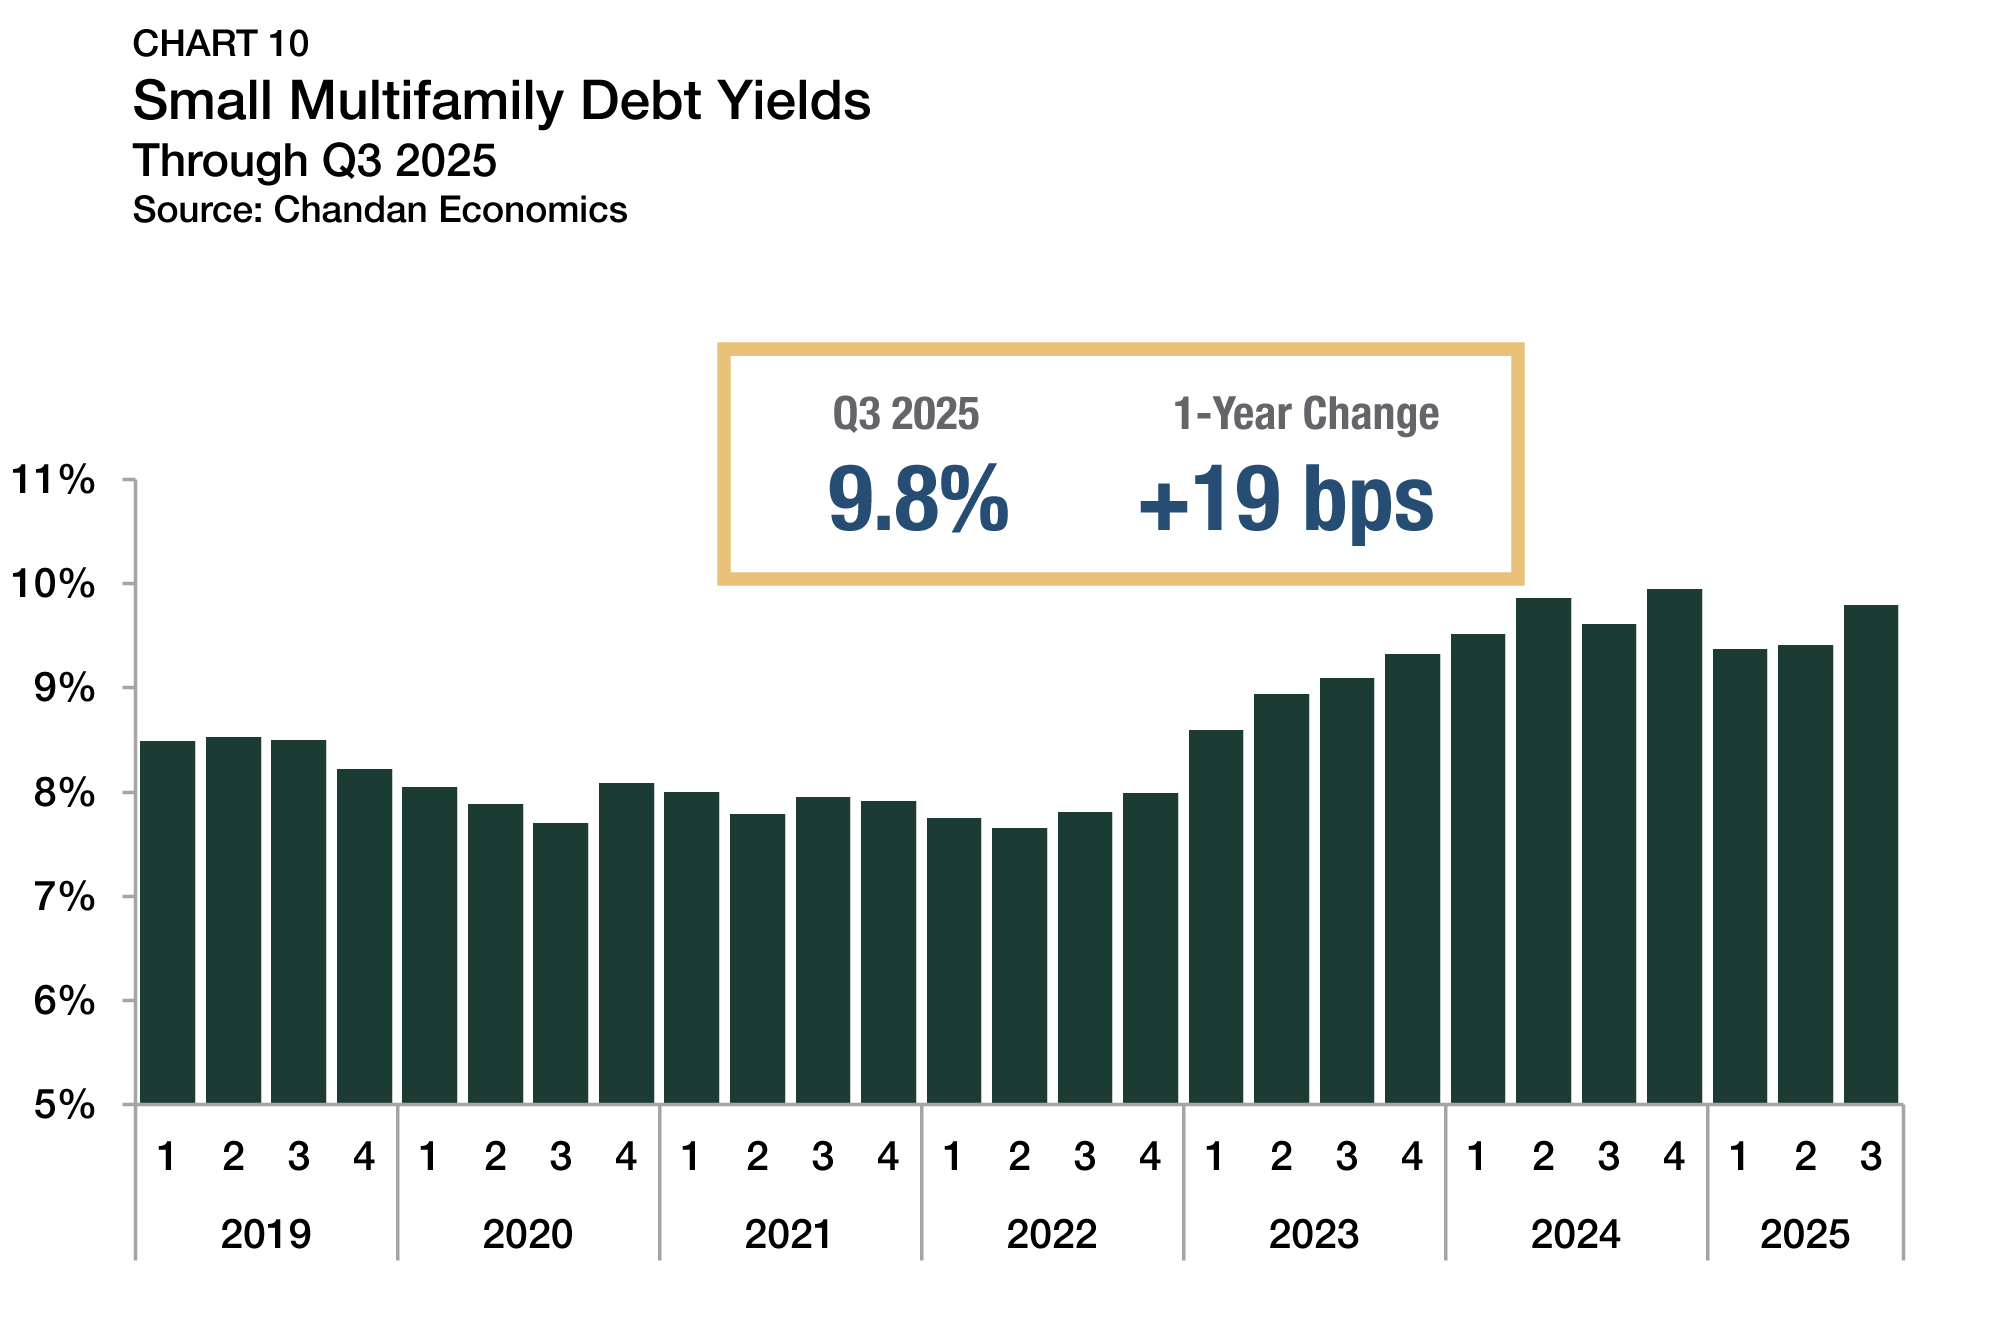
Arbor Realty Trust’s Small Multifamily Investment Trends Report Q1 2026, developed in partnership with Chandan Economics, shows that lending activity in the sector increased for the second consecutive year amid a sharp increase in refinancings. Even with persistently high interest rates and rigorous underwriting standards, small multifamily entered the first quarter on steady footing.
Analysis
Over the past 12 months, the leading rent growth markets spanned multiple regions, each exhibiting distinct strengths and characteristics.