Current Reports
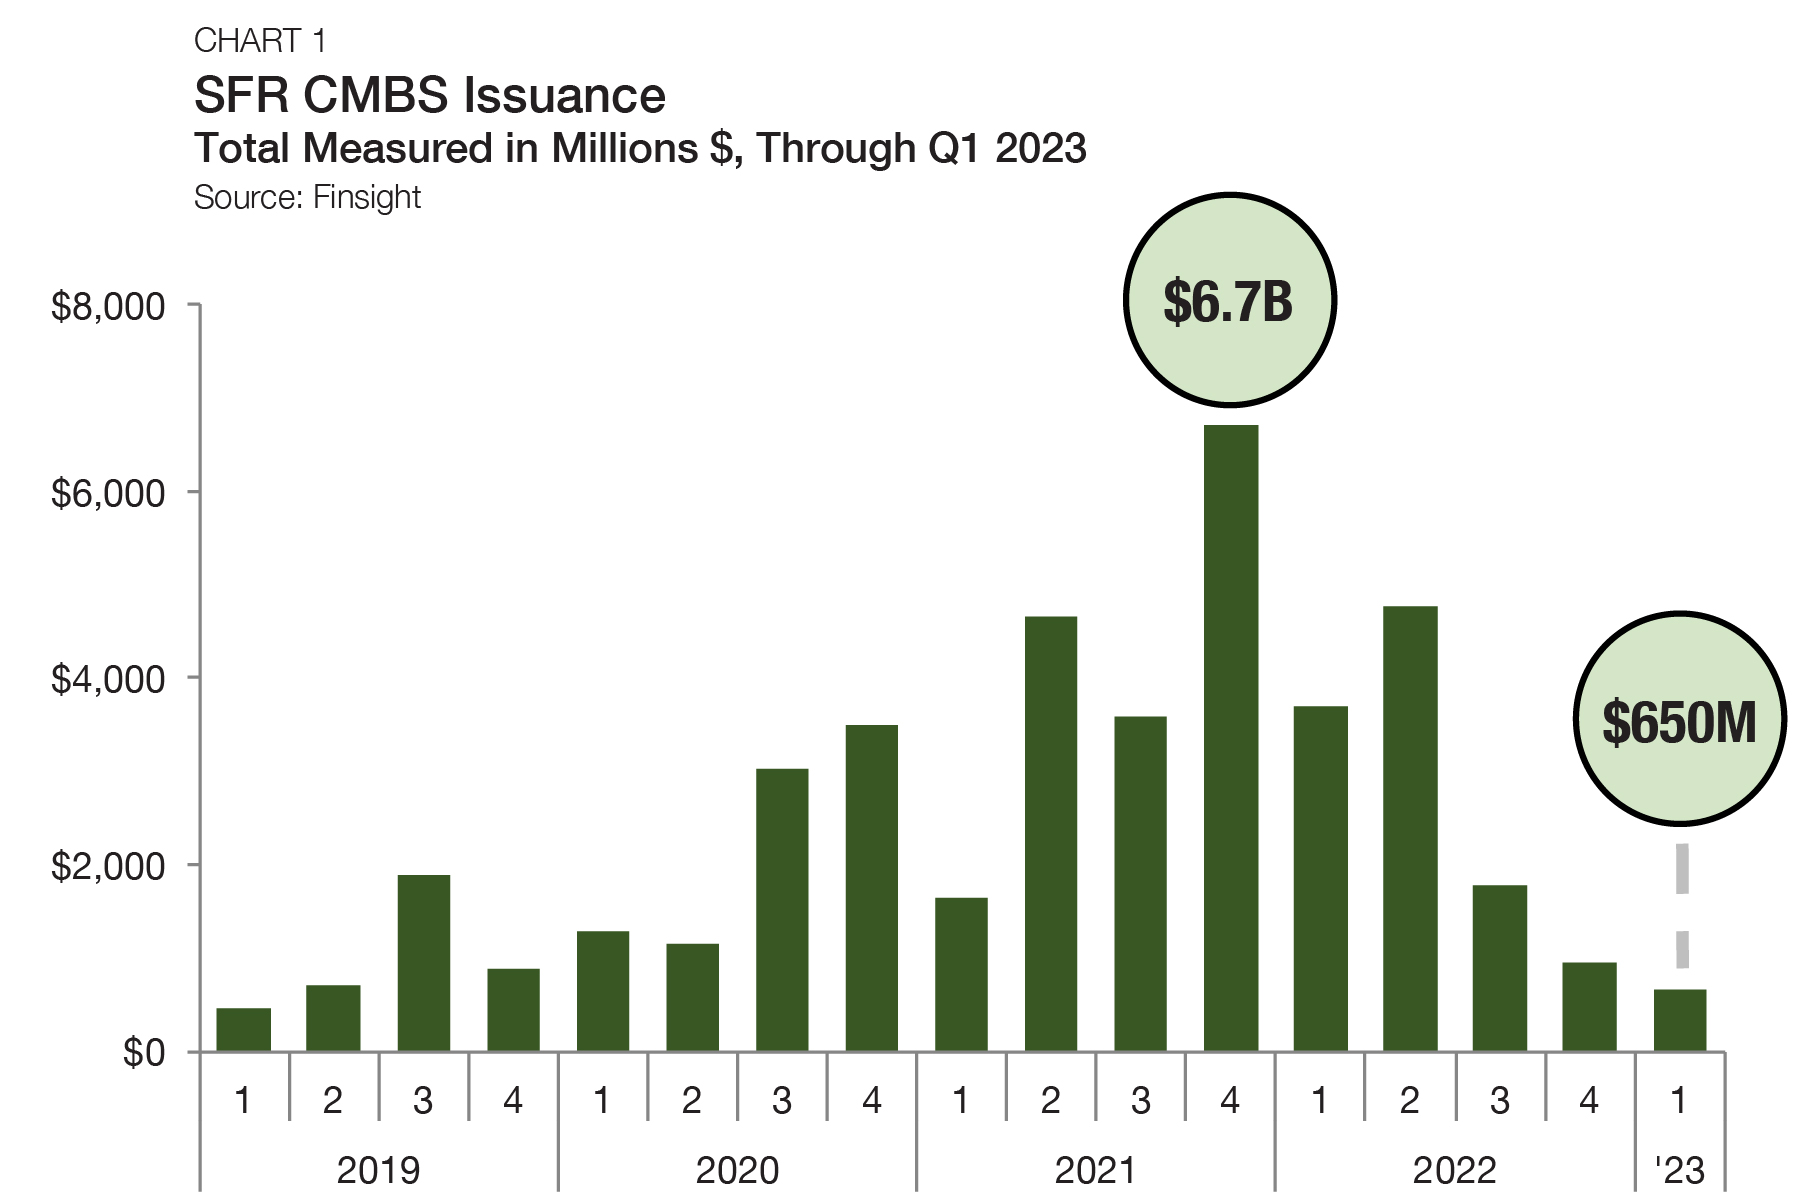
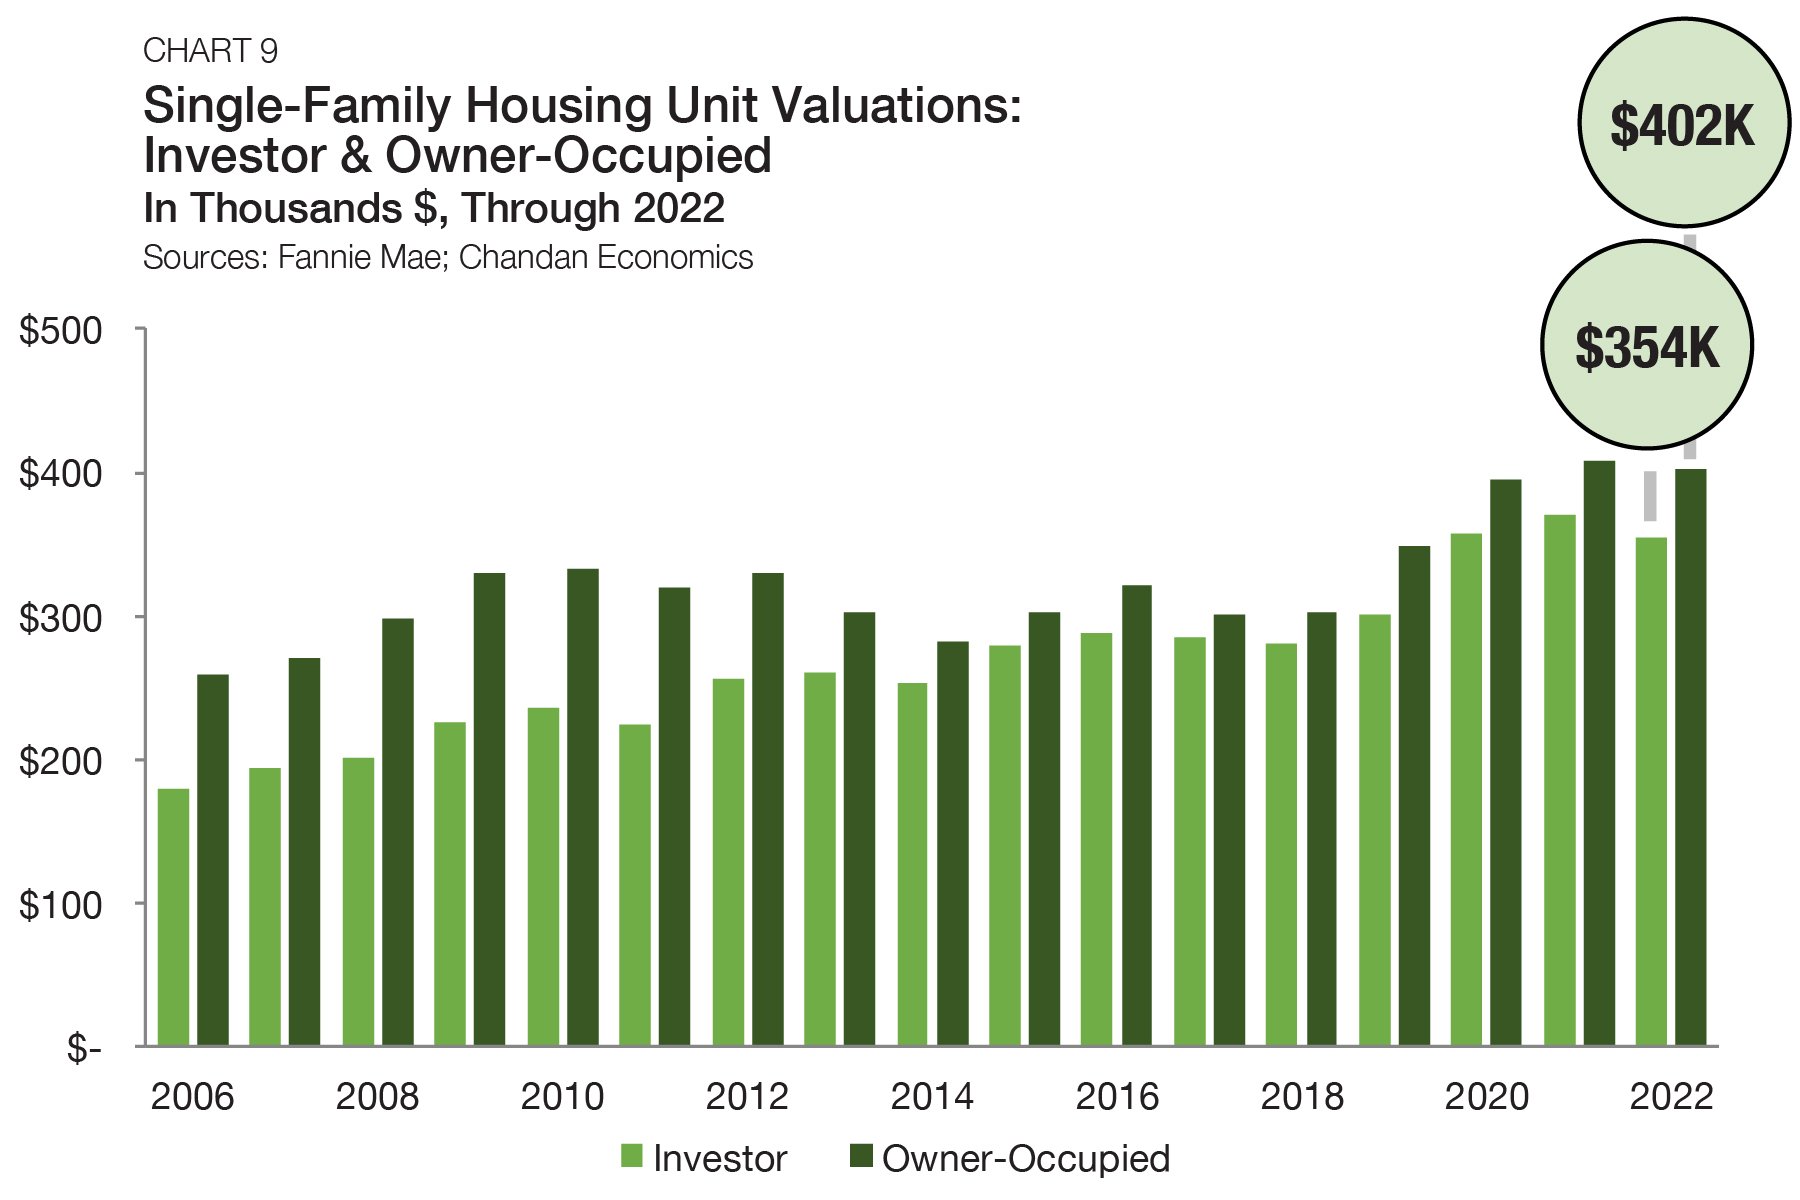
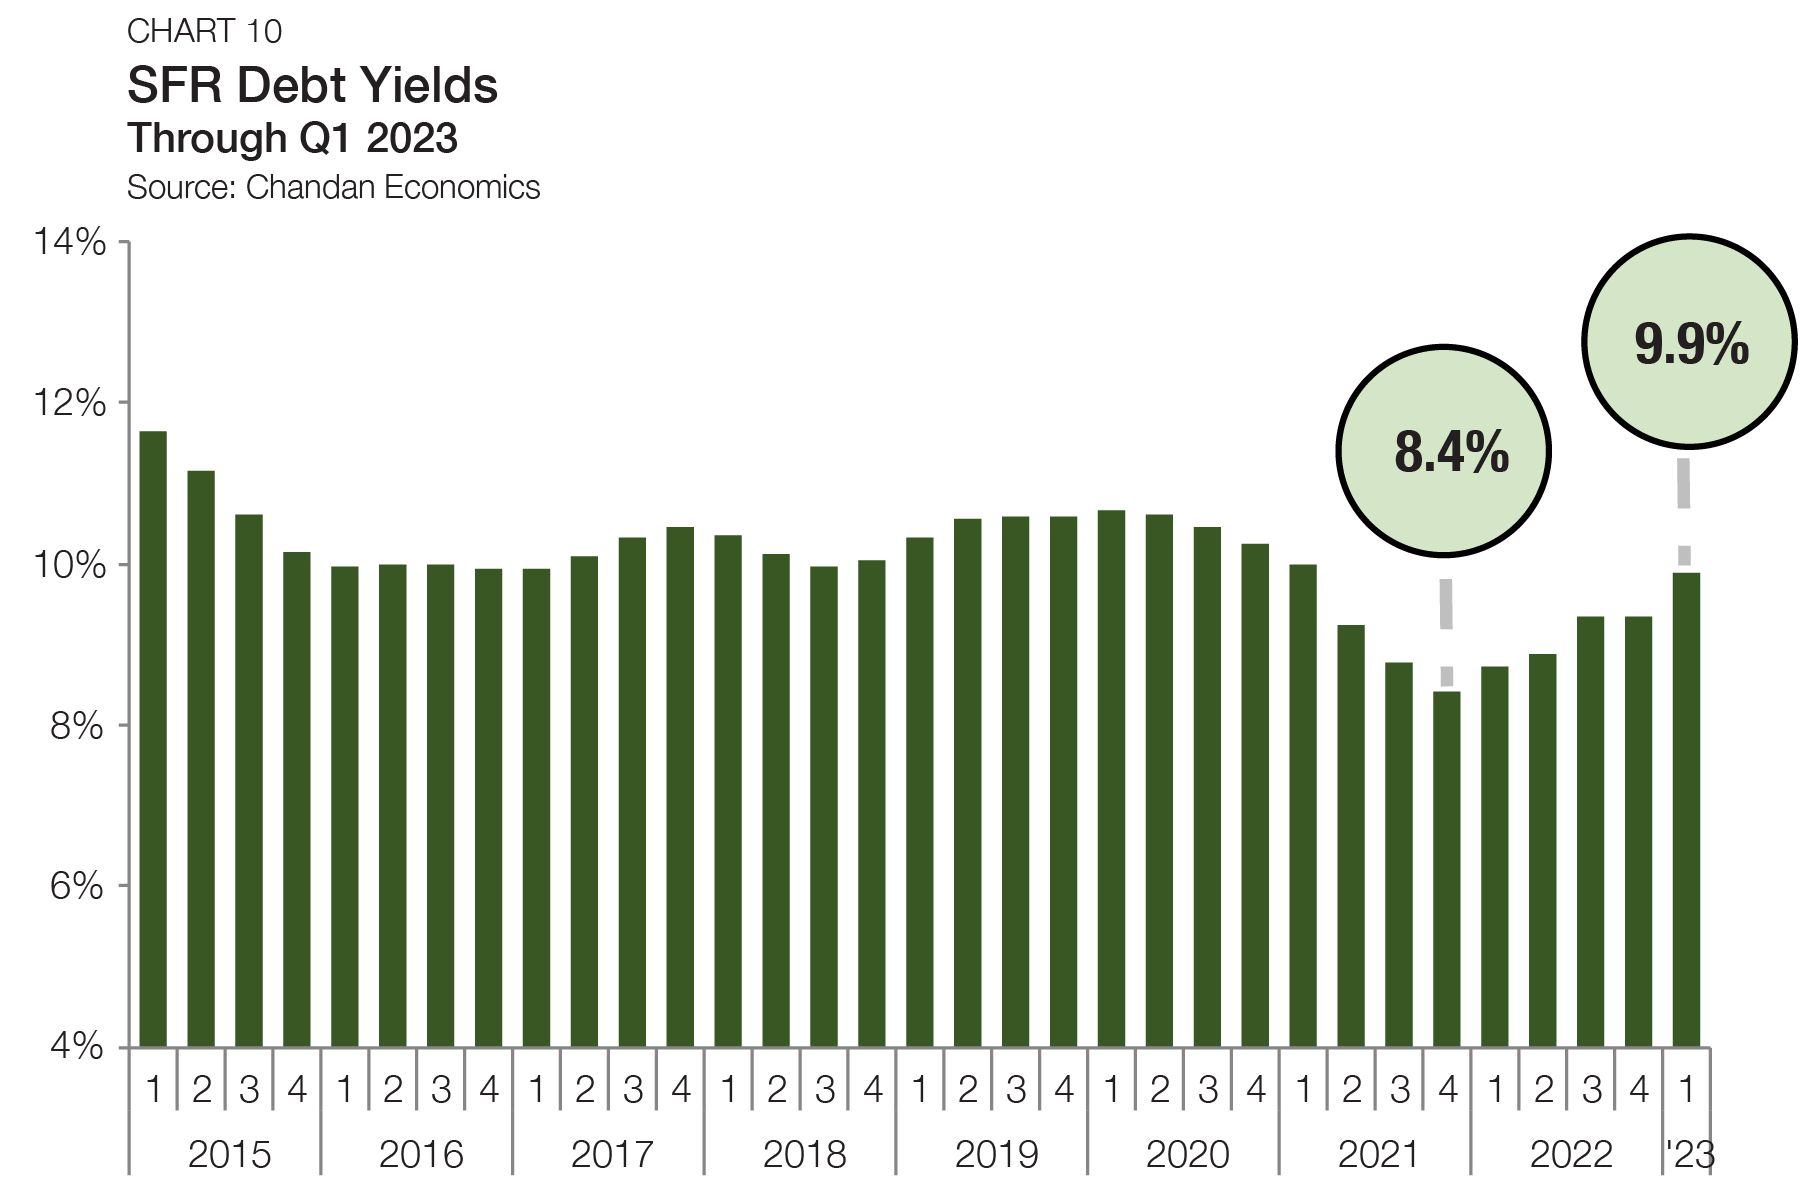
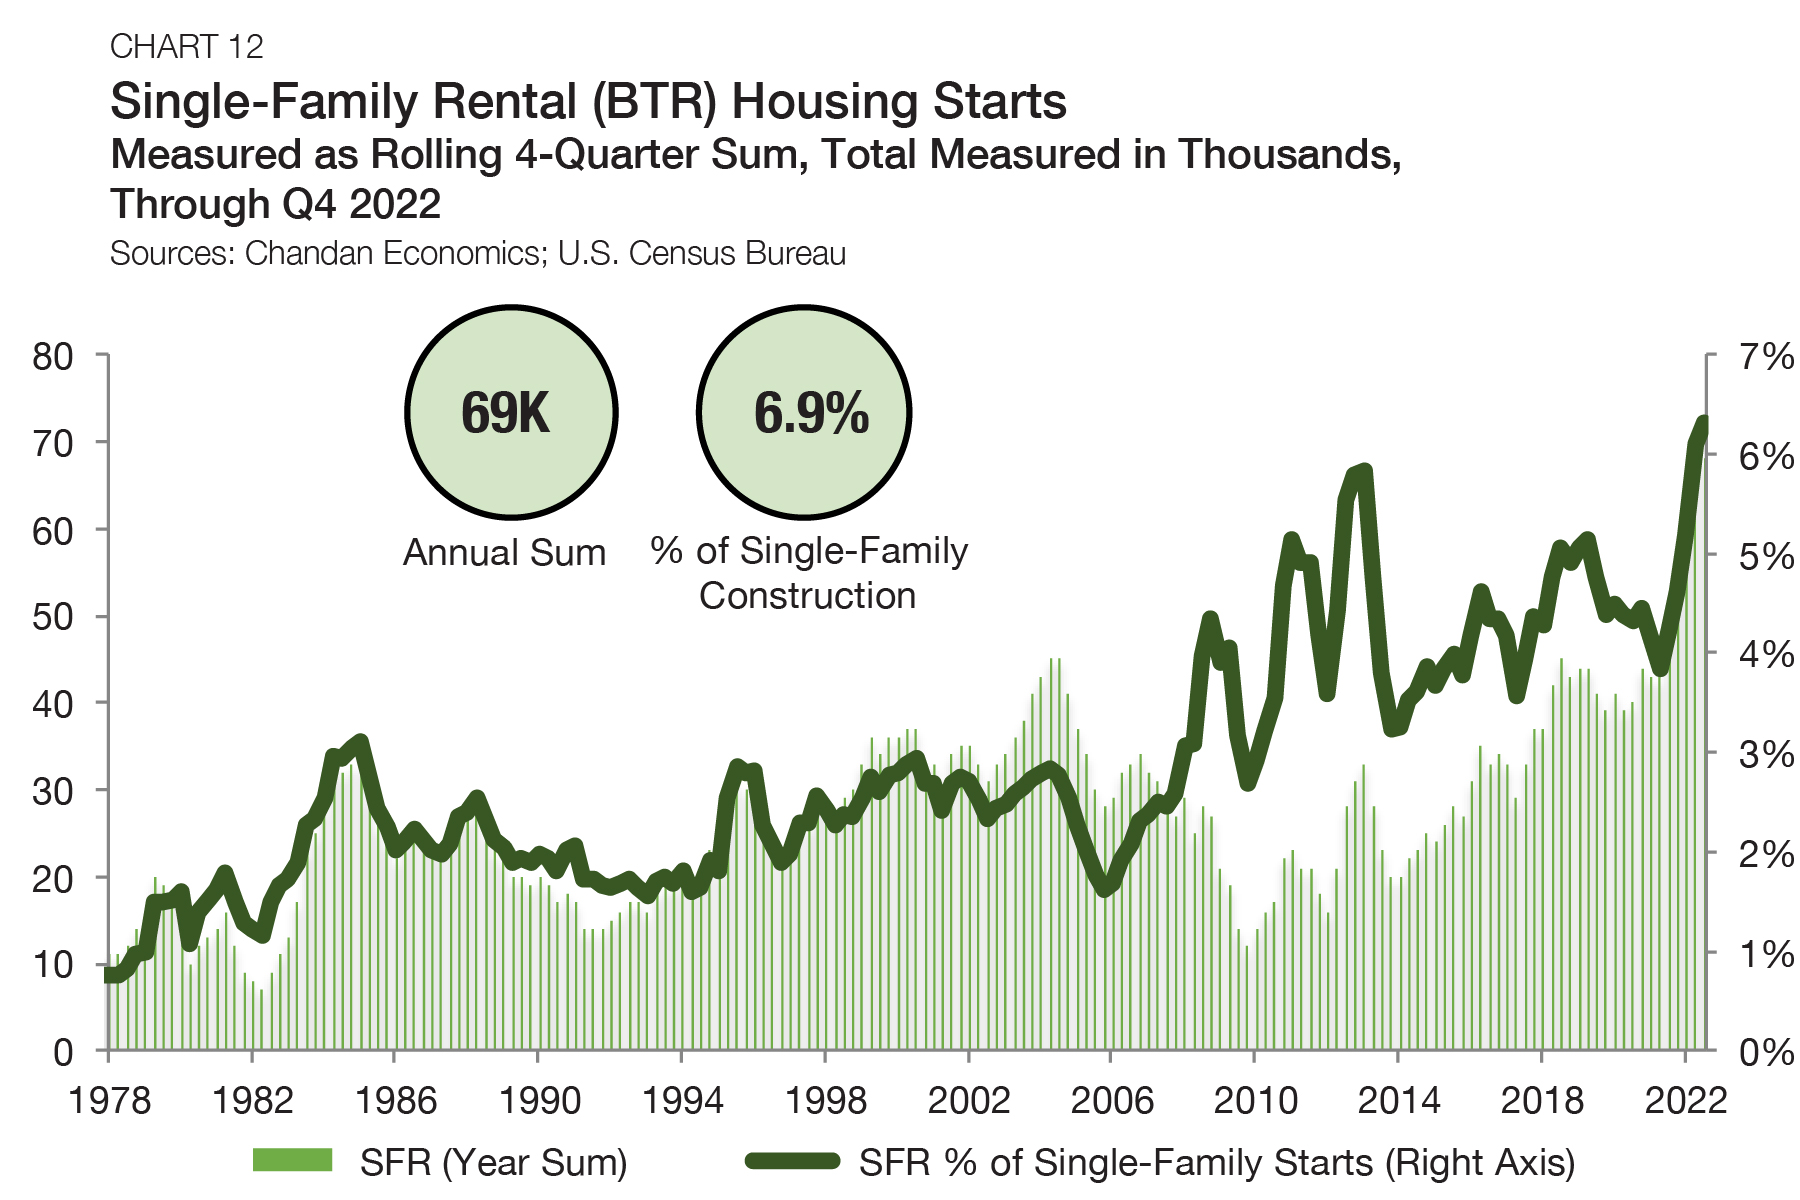
Arbor’s Single-Family Rental Investment Trends Report Q1 2026, developed in partnership with Chandan Economics, spotlights how market shifts, including the rising cost of living and historically high build-to-rent activity, have fueled record rental household growth.
Articles
Multifamily permitting trends indicate continued national stability amid local recalibration. Across the country, issuances were steady, rising just 2.6% in 2025. At the metropolitan level, trends diverged sharply, with some markets accelerating and others pulling back. Per-capita leaders continued to cluster around high-growth Sun Belt and regional hubs, while year-over-year market-level fluctuations suggest that more pipelines have become increasingly selective and, in some cases, more concentrated in large-scale projects.
Analysis
The small multifamily sector entered 2026 on a strong note, even as lending conditions remained shaped by persistently high interest rates and regulatory uncertainties.
Articles
The Federal Housing Administration (FHA), a part of the U.S. Department of Housing and Urban Development (HUD), is one of the largest mortgage insurers in the world. The agency insures mortgages on affordable housing, multifamily properties, single-family homes, and healthcare facilities. Since 1934, FHA has financed over 50,000 multifamily mortgages nationwide. Whether you’re interested in acquiring, refinancing, or rehabilitating an affordable housing property, FHA multifamily loans are a financing route you need to know about.
FHA® 232/223(f): Healthcare Refinance, Acquisition or Mod Rehab
Articles
Despite a national slowdown, population growth remained concentrated in a small group of states in 2025, where strong net domestic migration inflows, economic opportunity, and in some cases elevated birth rates drove the annual increases. Overall, 14 states had an annual population growth rate above 0.75%, while 12 states had less than 0.1%, according to a Chandan Economics analysis of the U.S. Census Bureau’s 2024 American Community Survey.
Articles
Build-to-rent (BTR), a compelling solution to the U.S. housing market’s evolving needs, is experiencing record growth. BTR accounted for 8% of all single-family rental (SFR) construction starts in the 12 months that ended in the first quarter of 2024, according to Arbor’s Single-Family Rental Investment Trends Report Q2 2024. As the need for quality rental units remains high, borrowers have much to gain from partnering with an experienced lender who specializes in build-to-rent financing.
Articles
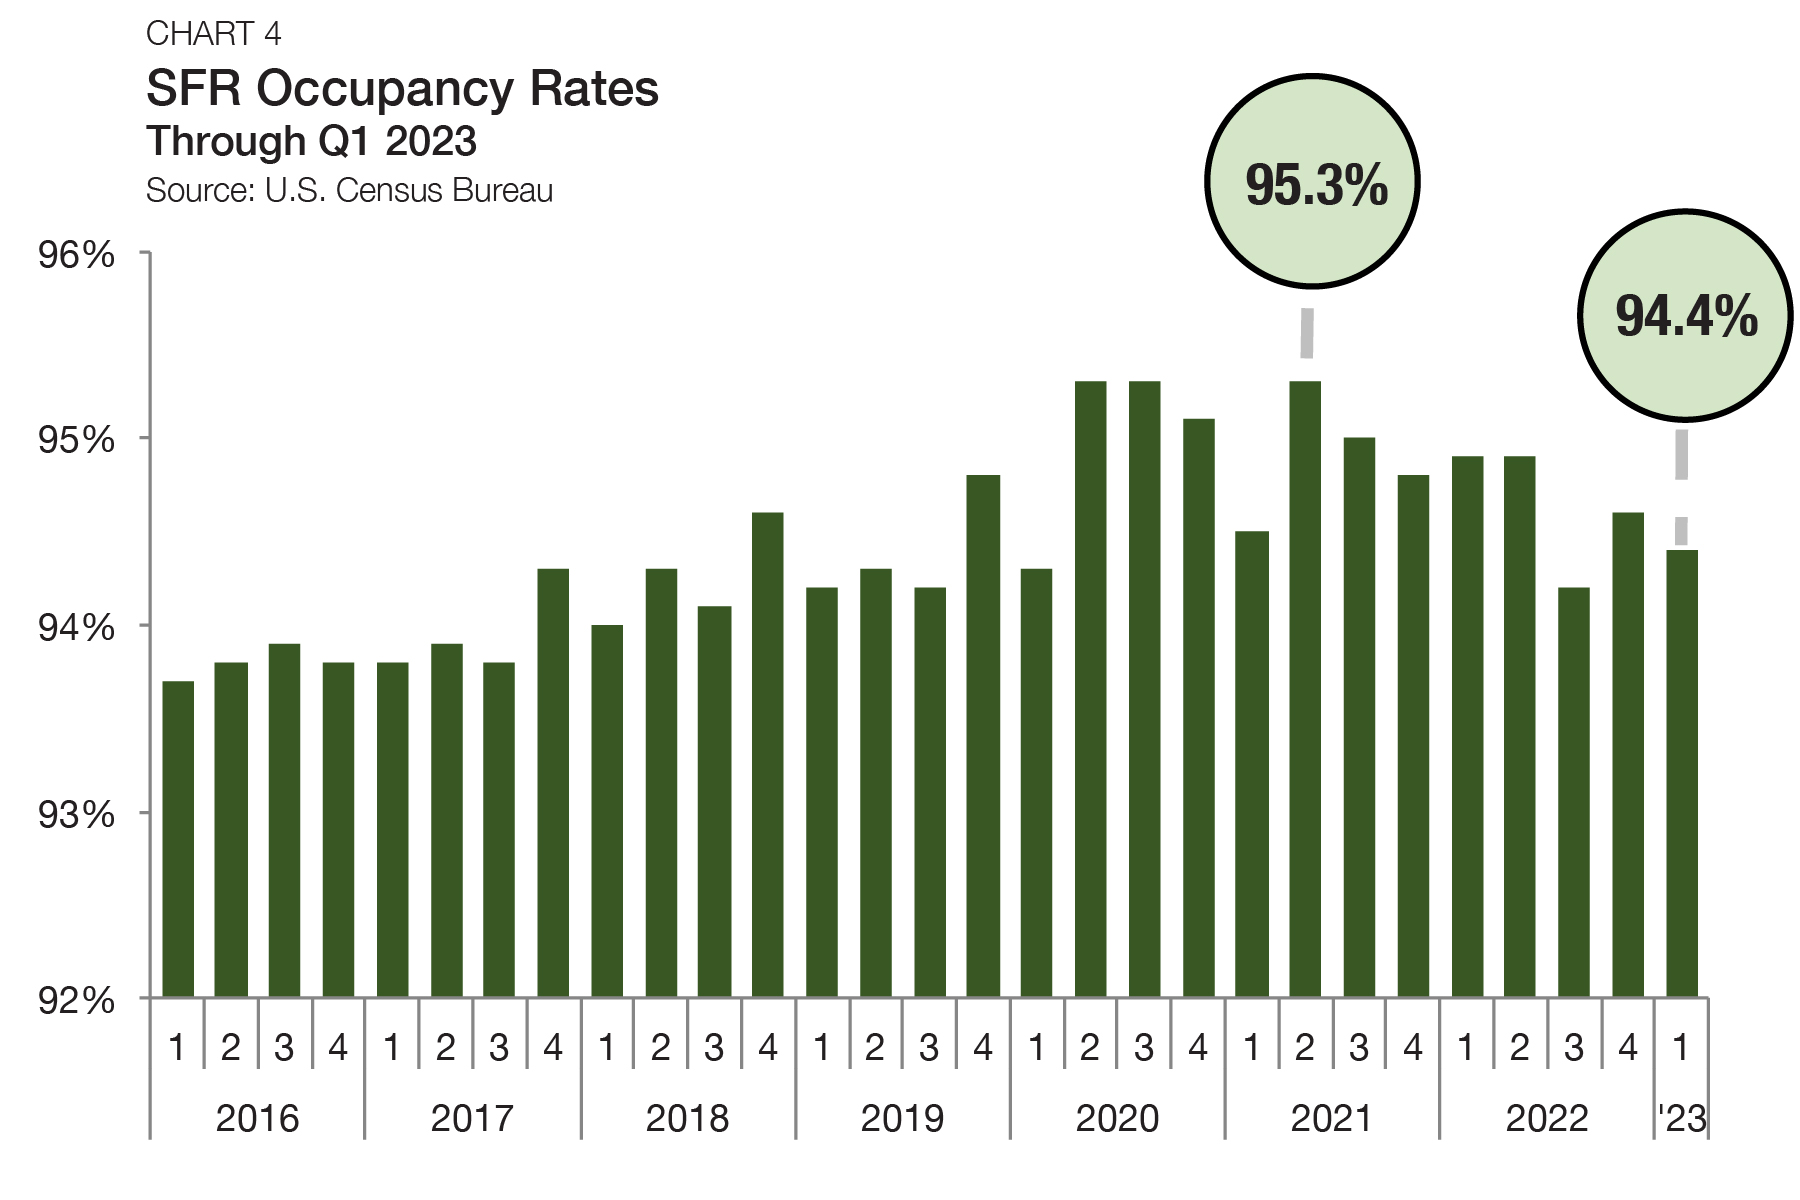
Out of the 75 largest U.S. metropolitan areas, occupancy rates for all types of rental properties, including multifamily and single-family rentals (SFR), remained exceptionally high in 2025.