Q3 2021 Small Multifamily Metro Area Cap Rate Trends

- Smaller metro markets continued to outperform larger gateway markets, notching more small multifamily cap rate compression over the year ending in third-quarter 2021.
- For the first time on record, gateway markets did not have the lowest average small multifamily cap rates, reflecting shifting risk perceptions and investor appetites.
- Regionally, West Coast metros posted the lowest small multifamily cap rates in the third quarter of 2021, led by San Diego and Seattle.
Key Findings
Despite a reshuffling of tenant demand brought on by the pandemic, work from home and domestic migration, average performance in the small multifamily sector has consistently improved following the initial COVID-19 shutdown. According to the latest Arbor Small Multifamily Investment Trends Report, Q3 2021 small multifamily[1] cap rates averaged 5.2% through the third quarter of 2021, nearing their all-time low.
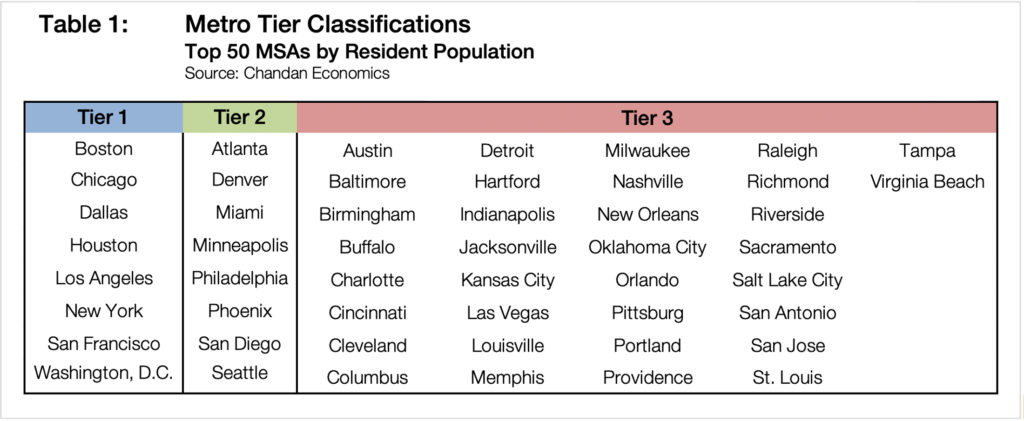
For this briefing, small multifamily data are explored at the Metropolitan Statistical Area (MSA) level, reported individually and aggregated into like-kind metro tiers.
Non-Gateway Markets Outperform
Based on Chandan Economics’ analysis, smaller, non-gateway metro areas with greater renter affordability and higher population growth continued to outperform heading into the final months of 2021.
In a departure from precedent, Tier 2 metros, a collection of eight MSAs that includes Atlanta, Denver, Miami, Minneapolis, Philadelphia, Phoenix, San Diego and Seattle, had the lowest average small multifamily cap rates in the third quarter of 2021, coming in at just 4.8% (Chart 1).[2]
Meanwhile, Tier 1 markets — including Boston, Chicago, Dallas, Houston, Los Angeles, New York, San Francisco and Washington, D.C. — saw average small multifamily cap rates tick up 6 basis points (bps) to 4.9%.
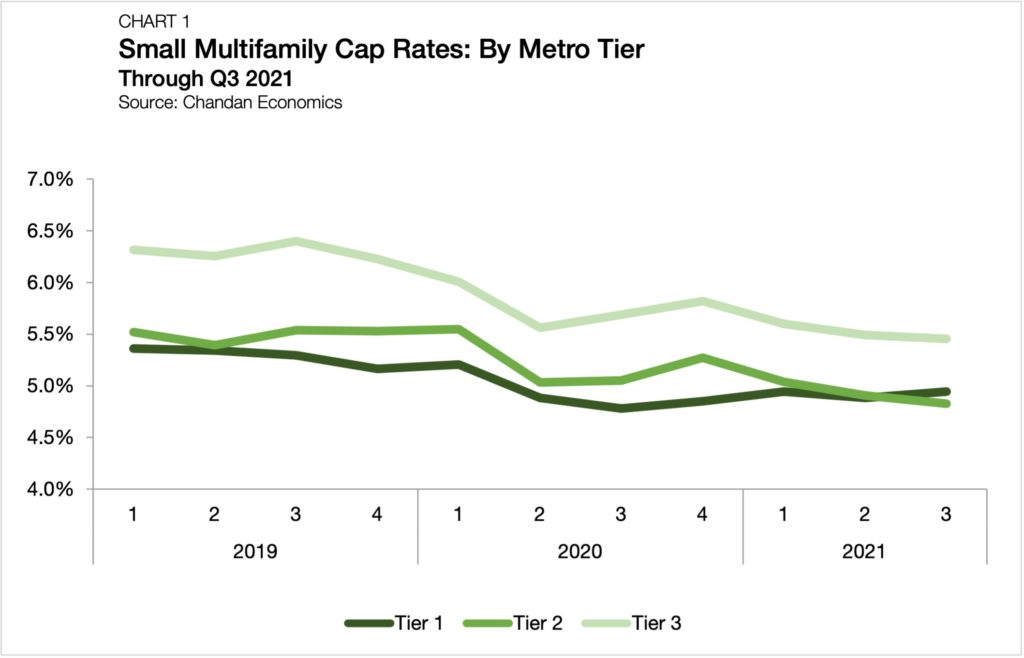
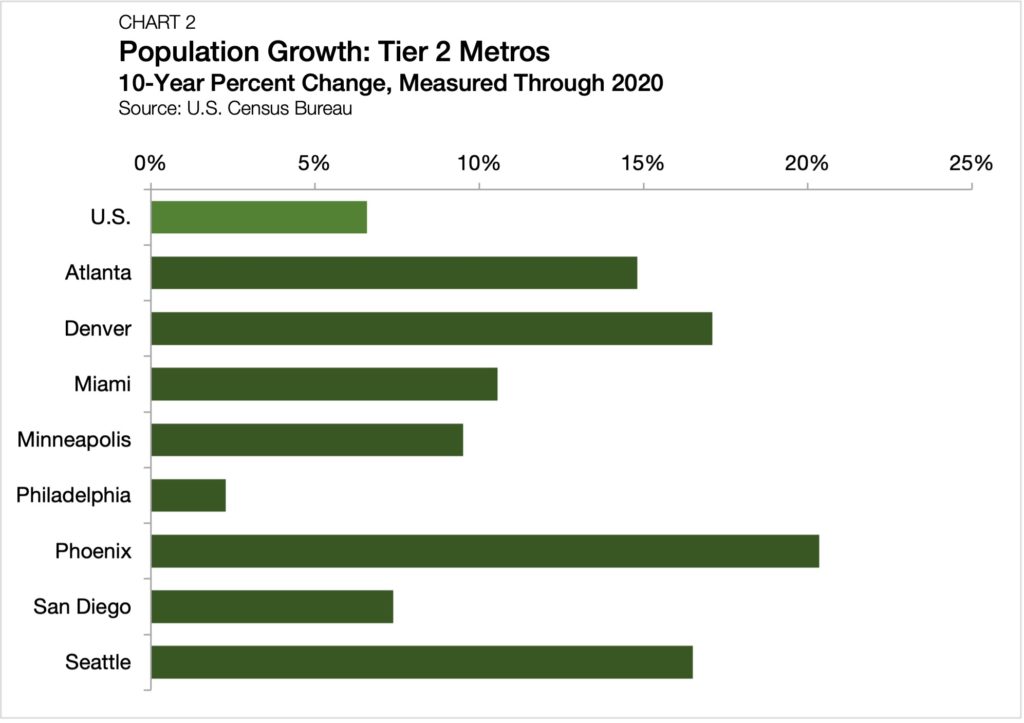
Historically, Tier 1 metros have had the lowest average small multifamily cap rates, as investors tend to view these markets as less risky. Tier 2 metros recording lower average cap rates than Tier 1 metro cap rates reflects evolving momentum. All but one MSA in Tier 2 saw its resident population grow by more than the U.S. average of 6.6% in the past decade. Phoenix and Denver led the way, with 20.4% and 17.1% growth, respectively (Chart 2).
Tier 3 metros, a collection of 34 markets that make up the balance of the top 50 MSAs by resident population, saw cap rates edge down to 5.5% in the third quarter of 2021. Small multifamily cap rates in metropolitan areas outside of the top 50 (“Other”) averaged 5.7% through last quarter — the highest mark of any group.
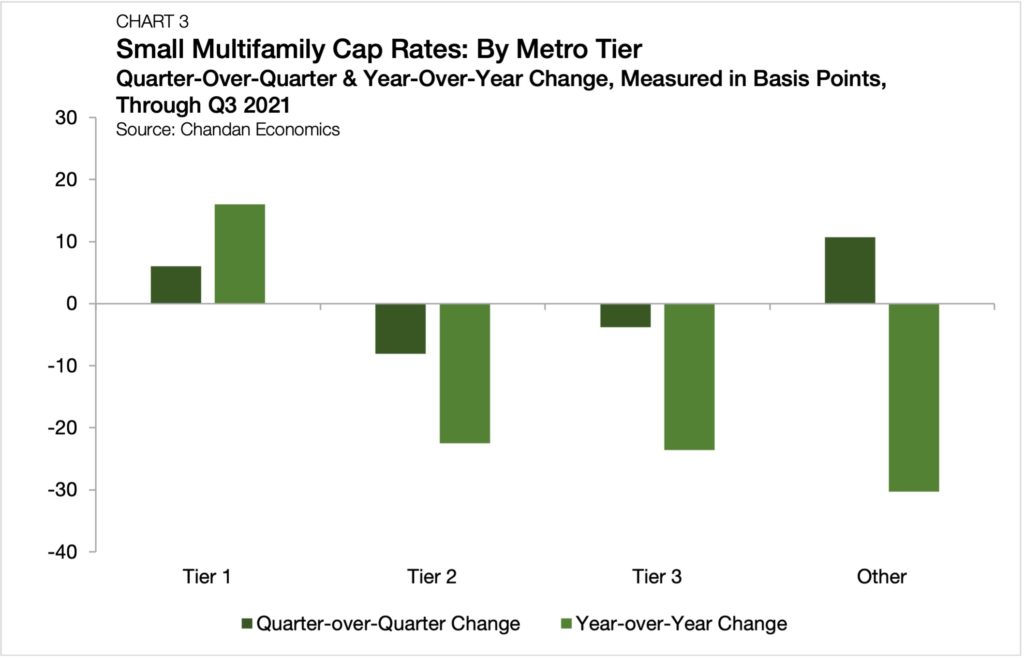
Yields in Tier 2 metros fell the most, declining 8 bps from second-quarter 2021 (Chart 3). Tier 3 metros followed closely behind, ticking down 3 bps. Meanwhile, Tier 1 and Other metros saw cap rates rise in the third quarter, nudging up by 6 bps and 10 bps, respectively.
Tier 2 and Tier 3 metros saw cap rates decline from a year prior, with cap rate compression of 23 bps and 24 bps, respectively. On the other hand, tier 1 markets saw cap rates rise by 16 bps from a year earlier. Meanwhile, metros outside of the top 50 MSAs saw the most significant average annual cap rate declines through third-quarter 2021, totaling 30 bps.
California Markets See Lowest Cap Rates
In the third quarter of 2021, Chandan Economics tracked 19 MSAs with enough observations to report cap rate estimates for both point-in-time and annual change measurements.
Four metros, including three in California markets, held the lowest average small multifamily cap rates in the country, all coming in at 4.3% through the third quarter (Chart 4). At the other end of the spectrum, Oklahoma City and Cincinnati had the highest tracked small multifamily cap rates, averaging 6.0% each.
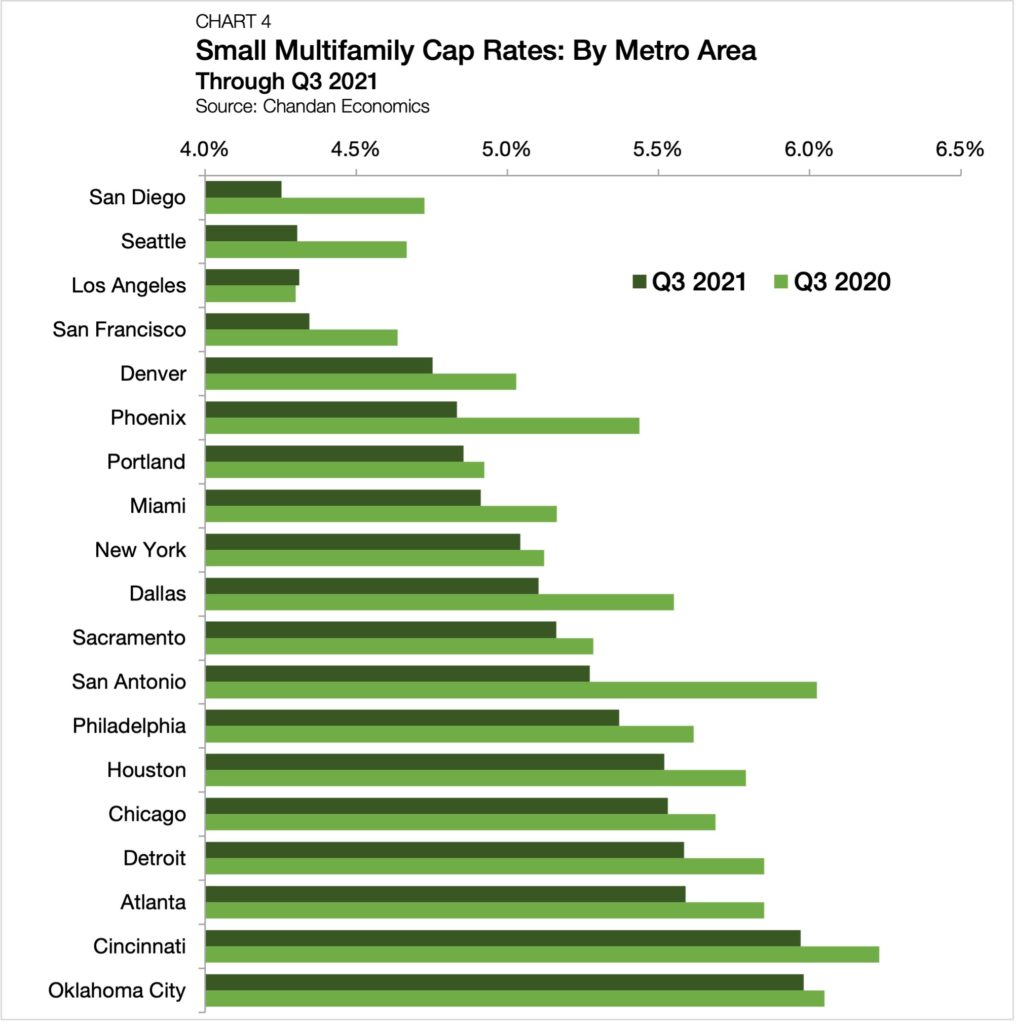
Los Angeles was the only tracked metro to observe a year-over-year increase in cap rates, albeit slightly, ticking up by a 1 basis point. Oklahoma City followed next, with cap rates declining by just 7 bps in the year ending third-quarter 2021.
San Antonio led the country in cap rate compression over the past year, shaving off 75 bps. Three other Sun Belt metros follow closely behind, with Phoenix, San Diego and Dallas posting cap rate declines of 60 bps, 47 bps and 45 bps, respectively.
What to Watch
As much as the pandemic has ushered in a new set of risks and opportunities for investors to consider, it has predominantly accelerated trends that were already underway.
Altogether, the Q3 2021 small multifamily cap rates data suggest that Sun Belt markets continue to outperform. Rising investor appetites for assets in the region are bidding down property-level cap rates. Further, Tier 2 metros, largely comprising Sun Belt markets, had the lowest average small multifamily cap rates in the country.
A trend to watch heading into 2022 and beyond is if Tier 2 metros will continue to be viewed as less risky investments than their gateway market counterparts. The COVID-19 disruption disproportionately impacted high-density, expensive metros. Whether shifting risk perceptions are a permanent change or a temporary trend likely to fade as the pandemic recedes will be under the spotlight in the coming year.
[1] For this analysis, small multifamily properties are defined as assets with valuations less than $15 million and containing less than 50 units.
[2] All data are based on a Chandan Economics analysis of a sample of multifamily mortgages with original balances less than $7.5 million. MSA level data, especially when reported individually, are subject to smaller sample sizes and have a higher margin of error.

